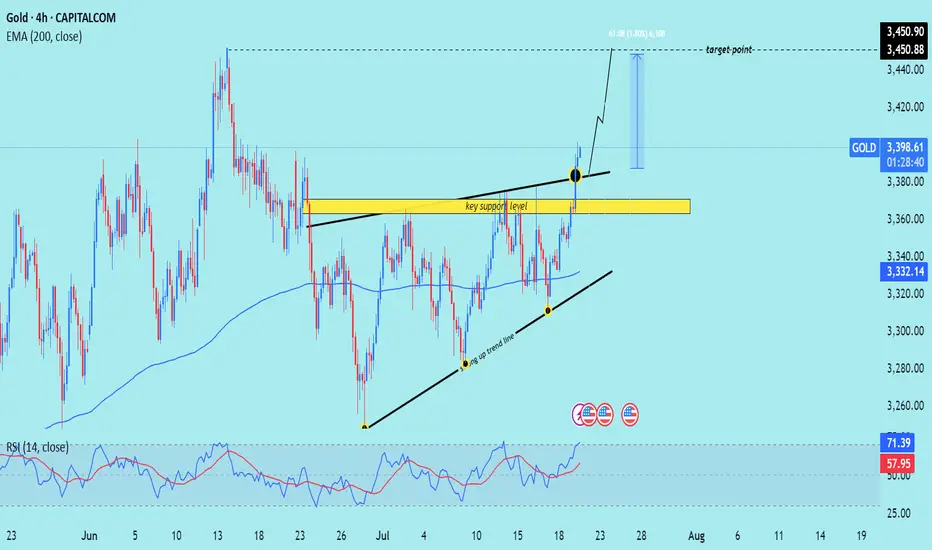
XAU/USD) Bullish trend analysis Read The captionSMC Trading point update
Technical analysis of Gold (XAU/USD) on the 1-hour timeframe. Here's a breakdown of the key trading
---
Technical Overview
Price: $3,428.71 (currently near the upper consolidation)
EMA 200: Around $3,367.38 (well below price, indicating strong uptrend)
Target Point: $3,468.52
Indicators:
RSI (14): 60.19–62.55 → shows moderate bullish momentum, not yet overbought.
---
Key Technical Elements
1. Bullish Breakout Structure:
Price has broken out of a previous range, and is forming a bullish flag or rectangle, which typically leads to continuation higher.
Measured move projection from previous leg (approx. $51.57 gain) targets the $3,468.52 level.
2. Strong Support Zones:
Two yellow zones highlighted:
Upper support level (around $3,415): acting as immediate structure support.
Lower key support (around $3,380): crucial structure level from where the trend initiated.
3. Trend Line Support:
A clearly marked ascending trend line supporting higher lows—indicating bulls are in control.
Expect price to stay above this trend line to maintain bullish bias.
4. Volume & RSI Confirmation:
RSI remains in a bullish zone but isn’t overbought → leaves room for upside.
Volume remains steady, confirming healthy consolidation.
Mr SMC Trading point
---
Conclusion & Trade Idea
Bias: Bullish
Entry Zone: On breakout or retest of minor support ($3,415–$3,420)
Stop Loss: Below trendline or below $3,415
Target: $3,468.52
Confirmation: Hold above trendline + RSI staying above 50
This is a classic bullish continuation setup supported by structure, RSI, and trend momentum. Traders could look for buying opportunities on minor dips or trendline retests.
---
Please support boost 🚀 this analysis)
Goldprice

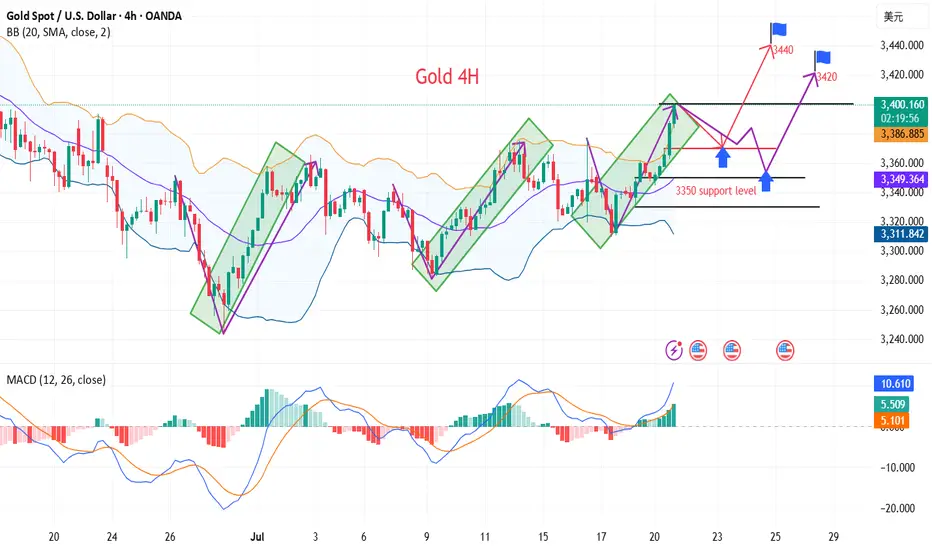
XAU/USD) breakout analysis Read The captionSMC Trading point update
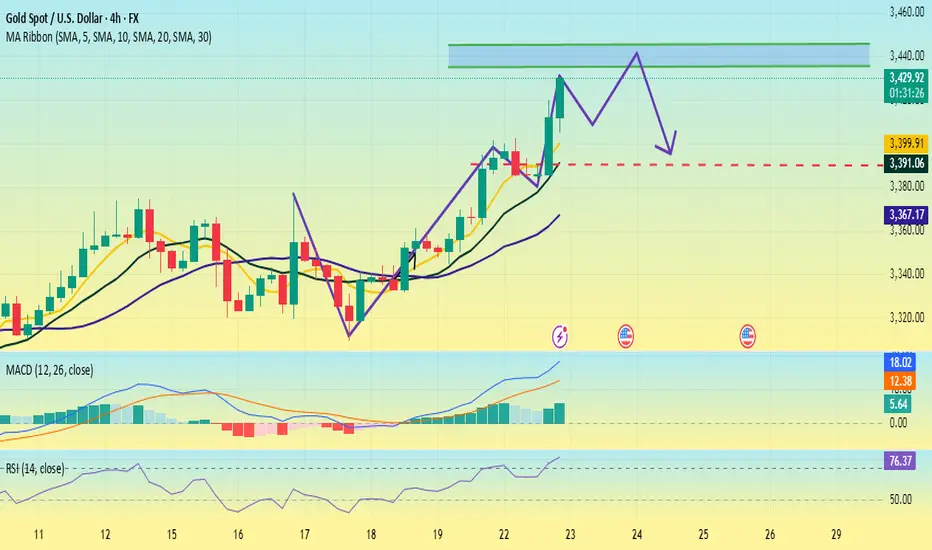
Technical analysis of (XAU/USD) on the 4-hour timeframe, highlighting a move toward the $3,450 target. Here's the full technical breakdown
---
Technical Analysis – Gold (4H)
1. Breakout from Resistance Zone
Price has broken above a key horizontal resistance level (now turned support, marked in yellow).
The breakout is confirmed by a strong bullish candle with momentum, suggesting buyers are in control.
2. Ascending Triangle Formation
Price formed an ascending triangle, a classic bullish continuation pattern.
The breakout above the upper boundary confirms the pattern, projecting a potential measured move.
3. Trendline Support & Higher Lows
The structure shows a rising trendline (black), where price bounced multiple times — confirming a higher low sequence.
The confluence of trendline support + breakout level adds strength to the bullish case.
4. 200 EMA Confluence
The 200-period EMA (3,332.13) has been acting as a dynamic support throughout.
Price retested it earlier in the move, then surged upward — validating trend continuation.
5. RSI Indicator
RSI is at 71.13, entering overbought territory.
This implies strong bullish momentum, but a short-term pullback to retest the breakout level is possible.
6. Target Projection
Target Point: $3,450.90, calculated from the height of the triangle (~61 pts or 1.80%) added above the breakout zone.
A retest of the breakout area (yellow zone) around $3,370–$3,380 could offer a better entry before continuation.
Mr SMC Trading point
---
Summary
Bias: Bullish
Current Price: $3,397.62
Support: $3,370–$3,380 zone (previous resistance turned support)
Trend: Higher lows + breakout above resistance
EMA Support: 200 EMA at $3,332.13
Target: $3,450.90
RSI: 71.13 – bullish but near overbought
Please support boost 🚀 this analysis)
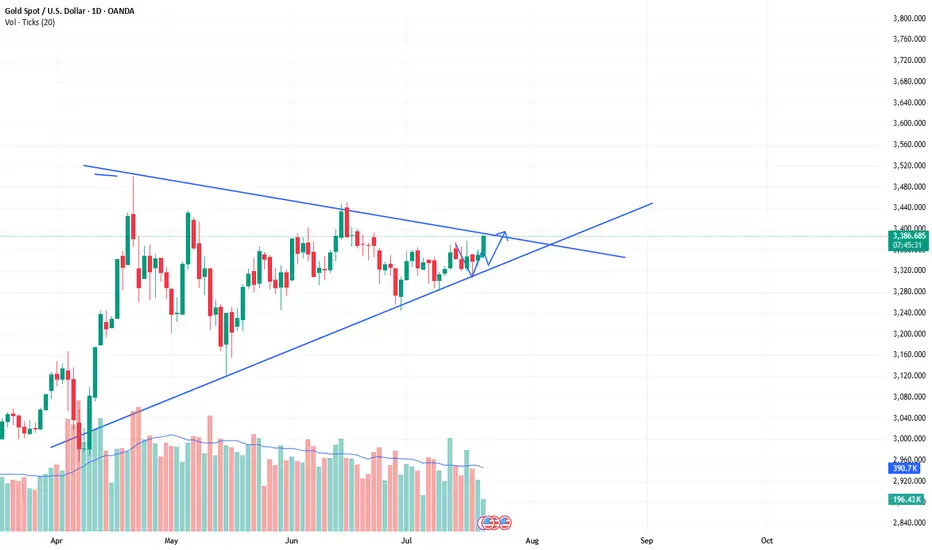
XAU/USD Chart Analysis: Bulls Break Important ResistanceXAU/USD Chart Analysis: Bulls Break Important Resistance
When analysing the XAU/USD chart last week, we:
→ noted that the ADX indicator had reached its lowest level since the beginning of 2025 – a clear sign of declining gold price volatility;
→ highlighted the formation of a large-scale triangle with its axis around the $3,333 level, bounded by a resistance line (marked in red) and the lower boundary of the ascending channel.
Since then, the price has climbed above $3,400 – reaching its highest level since mid-June. According to media reports, the uptick in demand may be driven by escalating geopolitical risks, renewed optimism regarding potential monetary policy easing in the US, and consistent gold buying from central banks.
This suggests that the balance has shifted in favour of the bulls, who have made an attempt to break through the resistance line – an attempt that, so far, appears promising and points towards a potential resumption of the upward trend.
However, today's XAU/USD chart shows that the bulls are now facing a key resistance level at $3,440 – a level that has reversed gold prices downward both in May and June. What will happen in July?
It is possible that, following a prolonged consolidation near the lower boundary of the channel, the bulls have built up sufficient momentum to finally break through this critical level and push gold prices towards line Q, which divides the lower half of the long-term channel into two quarters.
This article represents the opinion of the Companies operating under the FXOpen brand only. It is not to be construed as an offer, solicitation, or recommendation with respect to products and services provided by the Companies operating under the FXOpen brand, nor is it to be considered financial advice.

Gold safe-haven retreat? It will continue to rise!
Why did gold return to 3,400? Reasons explained!
1 As investors continue to focus on US President Trump's August 1 tariff deadline, trade uncertainty and weaker US Treasury yields have pushed gold prices to a five-week high. At the same time, trade uncertainty is also triggering some safe-haven demand.
2 At the same time, investors are also preparing for the Federal Reserve meeting next week. Although the Fed is expected to keep interest rates unchanged, the market expects that the Fed may cut interest rates in October. Gold is traditionally seen as a hedge tool in uncertain times and tends to perform well in a low-interest rate environment.
Views on today's gold trend!
After two consecutive days of rising this week, the sentiment of gold bulls has basically been ignited. There has been basically no obvious retracement in the past few days. Either it is a slow rise in a row, or it is a direct acceleration of the rise after sideways fluctuations. After the first wave of highs at the opening today, the market is still at a rising node!
The watershed of the retracement on the hourly chart is still the break point of 3403, but it is too far from our current position to enter the market at this position. In addition, the current continuous rise of gold and the turning of the moving average have made the market bulls more aggressive, which means that the previous short-term downward trend has ended. The point of today's retracement layout can focus on the vicinity of 3412!
Gold: Long near 3411, defend below 3403, and target 3440-50!

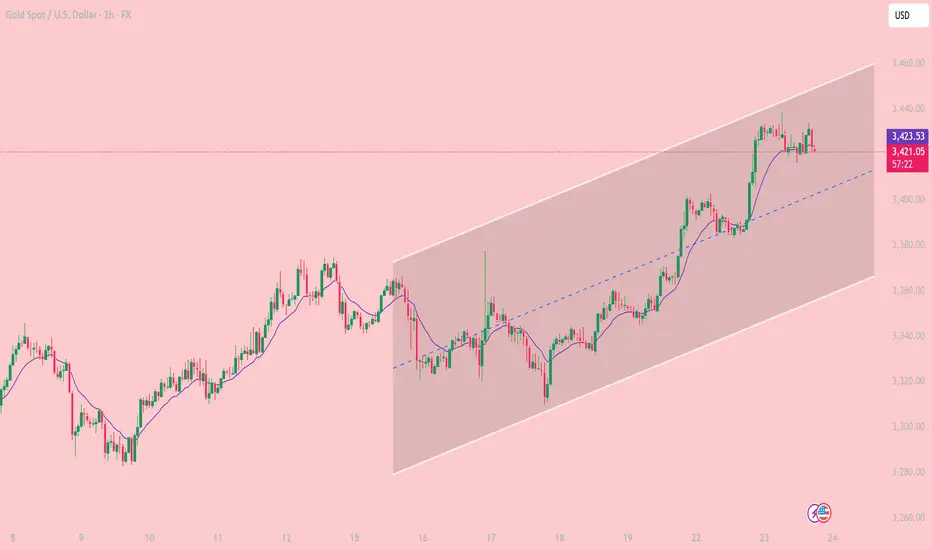
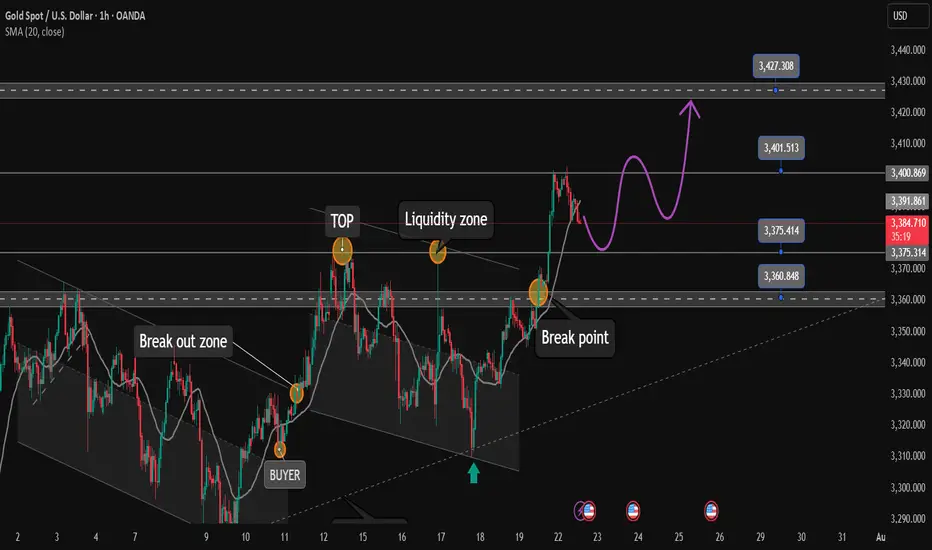
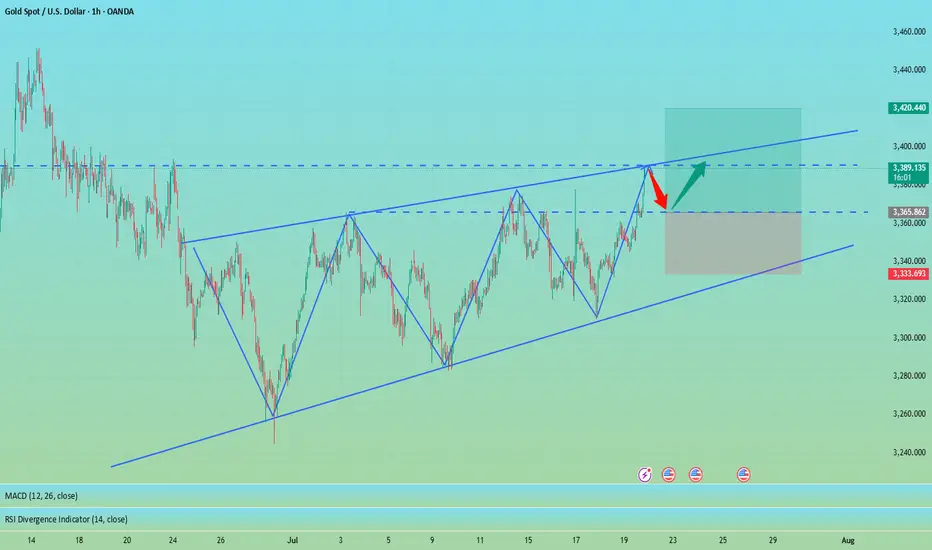
Bullish Channel in Play Key Trading Zones and Strategy for JulyOn the 1-hour chart, XAUUSD is clearly moving inside a well-defined ascending price channel, with price respecting both the channel boundaries and the midline as dynamic support/resistance. The pair continues to print higher highs and higher lows, confirming short-term bullish structure.
Trend Channel: Since July 18, gold has been steadily climbing within an ascending channel, bouncing off the lower boundary and riding above the midline.
EMA Support: The 10-period EMA (purple) has been acting as a dynamic support. Price has yet to close below it during this bullish swing.
Candle Behavior: Recent bullish candles with strong bodies show that buyers still have control, although price is stalling near the upper boundary of the channel.
Technical Level
3,459 USD. Major Resistance. Top of the channel – potential reversal or take-profit zone
3,423 USD.Immediate Support. EMA10 and current consolidation area
3,400 USD. Mid-Channel Support. Key pullback zone if price rejects near highs
3,360 – 3,365 USD. Major Support. Bottom of the ascending channel – break may invalidate bullish setup
Scenario 1 – Buy the Dip (trend continuation):
Wait for price to retest the 3,400 – 3,410 USD area or EMA10.
Look for bullish confirmation (e.g., pin bar, bullish engulfing).
Target: 3,445 – 3,459 USD
Stop loss: below 3,395 USD
Scenario 2 – Short at Channel Top (mean-reversion setup):
Monitor price behavior near 3,455 – 3,459 USD resistance.
If bearish reversal candles appear (e.g., shooting star, bearish engulfing), consider shorting.
Target: 3,420 – 3,410 USD
Stop loss: above 3,465 USD
As long as price remains inside the rising channel, buying pullbacks is the preferred strategy.
Stay alert to macroeconomic catalysts (Fed comments, PMI data, labor market releases) that could increase volatility.
Gold remains in a strong short-term uptrend on the 1H chart. Trading in the direction of the trend with proper risk management continues to offer the best opportunities for intraday traders.
If you found this analysis useful, don’t forget to follow for more trading strategies and ideas!
3400 has been reached, wait patiently for a pullback to go longGold opened on Monday with a volatile rise. After breaking through the 3360-65 area, the bulls turned strong. After breaking through the 3375~80 area in the evening, the bulls accelerated their rise, reaching the highest point of 3402. It fluctuated sideways in the late trading, and the daily line closed at around 3397 with a big positive line! Gold temporarily broke the small range oscillation pattern, but the bulls were not strong, and it still fluctuated upward.
From the perspective of the intraday cycle, after yesterday's rapid rise, the market fell into a serious overbought state; however, yesterday's $60 big positive line supported the bulls, and it is expected that the market will fluctuate; the next focus is still the 3400 mark area. The pressure in the 3400~05 area was dense last night, and adjustments may be made at any time before the breakthrough; and since the rise of 3282, it has just touched the upper edge of the parallel channel. The big sweep will continue, but the range is constantly changing!
So although gold broke the recent volatility yesterday and hit the 3400 mark with a big positive line; however, if it cannot stand above it, then it will continue to fall; recently we have repeatedly and many times emphasized the importance of the 3400 mark. If it stands here, the market will gradually rise to 3420~25 and break through to the 3450 area before looking for a decline.
Today we will continue to focus on the 3400 mark area. First, we will rush to the high altitude, with the goal of retracement to the 3375 and 3356 regional support platforms, and then pay attention to long opportunities; if the bulls stand above the 3400 mark, they will further bullishly impact 3420~25 and break through the 3450 area before falling back.
OANDA:XAUUSD
Gold bulls are on the offensive. Can they continue to chase?On Tuesday, as trade tensions and the conflict between the White House and the Federal Reserve continued, the US dollar index continued to fall, and continued to fall in the early US trading, once hitting a low of 97.28. Gold also continued to rise, once standing above the $3,430 mark, setting a new high in more than a month. From the current point of view of gold, this week has stood firm at two levels, 3,350 and 3,400. Next, it depends on whether it can continue to stand firm at the 3,450 level.
From the current hourly chart, Monday's high is around 3,400, and yesterday's low of the US market retracement on Tuesday was around 3,405. So theoretically, 3,400-3,405 has become a support position. And from the hourly chart range, the bottom trend line support is also about 3,400-3,405. Therefore, it is not ruled out that it will oscillate and retrace like yesterday, and then rise and stretch again.
Secondly, from the daily chart:
After gold stabilized at 3400, the current daily range has become 3400-3450. As we can see above, there have been three times of falling back after touching 3450. If it breaks and stabilizes above 3450 this time, the historical high of 3500 will most likely be refreshed. On the contrary, if it still cannot break through 3500 this time, the possibility of further pullback cannot be ruled out. For the next operation, I suggest paying attention to 3400-3405.
If it can retreat and stabilize at 3400-3405 during the European session, you can continue to enter the market and go long to around 3450. On the contrary, if it falls below 3400 today, then don't go long, as there may be a possibility of further retreat in the future.

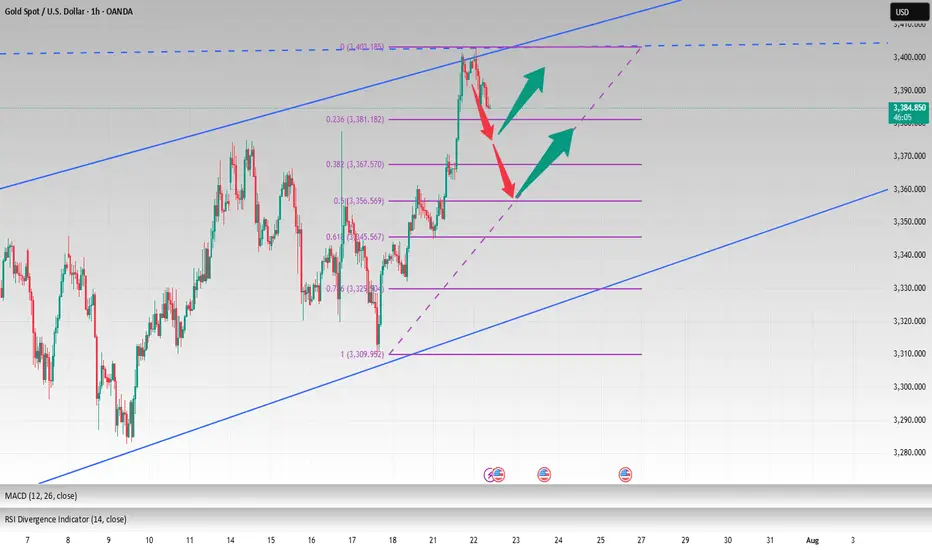
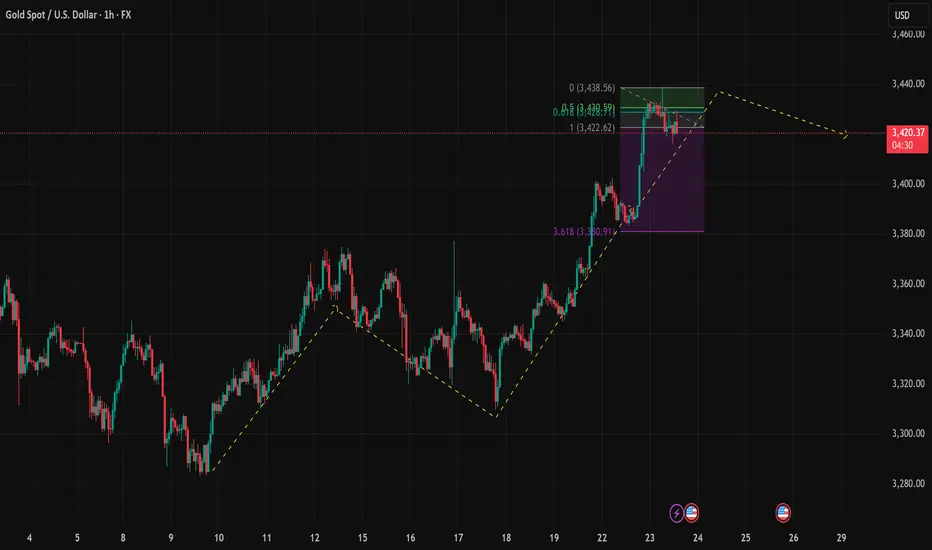
Gold Faces Key Fibonacci Resistance Is the Bullish Momentum FadiTrend Structure: Gold remains in a short-term bullish structure, with a clear series of higher highs and higher lows. However, price action shows signs of hesitation near a critical Fibonacci extension zone.
Key Resistance Zone:
$3,428 – $3,438: This area aligns with the 0.618 Fibonacci extension at 3,428.59 and the 0.0 level at 3,438.56, forming a confluence resistance zone that has started to trigger selling pressure.
Immediate Support Levels:
$3,422.62: The 1.0 Fibonacci extension, serving as the first support on a minor pullback.
$3,408 – $3,410: A potential bounce zone combining short-term trendline support and prior consolidation structure.
Fibonacci & Price Waves: The recent bullish leg from $3,330 to $3,438 has completed a 3.618 extension (noted at $3,330.91 on the purple projection). This increases the probability of a corrective retracement.
EMA & RSI (suggested for confirmation): EMA20 (not shown) should act as a dynamic support. Watch RSI for potential overbought signals or bearish divergence if it crosses above 70.
Trade Setups to Watch: Scenario 1 – Short Setup at Fibonacci Resistance Entry: $3,428 – $3,432, only if price action confirms rejection (e.g., bearish engulfing, pin bar)
Stop Loss: Above $3,438
Take Profit 1: $3,422
Take Profit 2: $3,410 (if trendline breaks)
Scenario 2 – Buy Setup on Pullback Entry: Around $3,408 – $3,410 upon bullish price action confirmation
Stop Loss: Below $3,400
Target: $3,428
Final Thoughts: Gold is approaching a strong resistance zone, and short-term pullback is likely unless bulls break through $3,438 with momentum. Traders should stay patient and wait for confirmation signals before entering. Remember: discipline beats impulse.
Follow for more updated strategies during the US session. Save this idea if you find it helpful! Let’s discuss your view in the comments below.
XAUUSD: Fluctuation of $30/ounce. Do you want to know?Yesterday, I frantically notified followers to buy around 3366-3375, and the market finally rose to 3430. This is a huge profit. I will continue to update it in the Band Trading Center Research Institute later. If you don’t want to miss it, follow me. If you see it but are still not sure how to trade. Then you can leave me a message at the Swing Trading Center Research Institute. I will reply to you one by one when I see it.
This week, some followers have achieved weekly profits of 50%-268%. If your profit is not ideal. Or don’t know how to trade. Remember to like and follow. I will lead everyone to victory.
Buy around 3400-3410. When will it close? I will post the results on the Swing Trading Center. Stay tuned.

XAUUSD:3450-3500The probability of the same direction of the two histories is 95% similar. This shows one thing. The market may repeat history again.
So buy with me. The next target is 3450-3500

Gold is strong. Can it continue?On Tuesday, the overall gold price showed an upward trend. The highest price rose to 3433.32 on the day, and the lowest price fell to 3383.21, closing at 3431.46. On Tuesday, gold prices fluctuated during the early trading session and then corrected downward. During the European session, the price fluctuated mainly and fell weakly. It rose before the US session and hit the high point of the week again in the US session, and finally ended with a big positive line.
From the four-hour level, the technical adjustment needs, but the speculation of risk aversion suppressed this demand. There is a contradiction between the fundamentals and the technical aspects, and it is necessary to wait for the market sentiment to stabilize before clarifying the direction.
In the early Asian session, it hit a high of 3438 and then fell back. It is necessary to pay attention to the possibility of reaching the top. The support position is 3400-3405. If it falls to 3400, it may continue to adjust to around 3385. The probability of closing the negative line today is relatively high. If the price stabilizes above 3400, it is likely to maintain high fluctuations.
Today's market is complicated. Although the bullish trend has not changed, it is not advisable to be overly bullish. The operation is mainly shorting on rebounds, supplemented by long positions on pullbacks. The upper pressure position focuses on 3440-3450.
Operation strategy:
Short near 3440-3450, stop loss 3460, profit range 3420-3410.
Long near 3390, stop loss 3380, profit range 3420-3430.

Gold Maintains Strong Momentum, Eyes 3435+📊 Market Drivers:
• Gold prices surged as the USD weakened further and U.S. bond yields dropped.
• Investors are increasingly betting that the Fed may cut interest rates in 2025, boosting demand for gold.
• Ongoing trade tensions and expectations of comments from Fed officials are adding to bullish momentum.
📉 Technical Analysis:
• Key Resistance: 3435 – 3440
• Nearest Support: 3410 – 3415
• EMA09: Price is above the EMA09 → confirms short-term uptrend
• Pattern & Momentum: Clean breakout from the 3383–3390 range with strong volume, bullish momentum continues
📌 Outlook:
Gold may continue rising in the short term if it holds above 3415. A pullback could offer a chance to re-enter long positions near new support levels.
________________________________________
💡 Suggested Trade Setup:
🔺 BUY XAU/USD: 3415 – 3418 (on pullback)
🎯 TP: 40/80/200 pips
❌ SL: 3412
🔻 SELL XAU/USD: 3435 – 3438 (key resistance)
🎯 TP: 40/80/200 pips
❌ SL: 3442

After reaching FULL TP. Relax and wait for strong support zone✏️Continuing yesterday's bullish wave structure, Gold has reached the Target level of 3400. In the European session, there is a possibility of a correction to some important support zones. And the US session will continue to aim for a level higher than 3400. Today's strategy is still quite similar to yesterday's strategy when waiting for the areas where buyers confirm to enter the market to FOMO according to the main trend.
📉 Key Levels
Support: 3375 - 3363
Resistance: 3400-3427
Buy Trigger: Rejects the support zone 3375 and reacts to the upside
Buy Trigger: Rebound from 3363
BUY DCA: Break and trading above 3400
Target 3427
Leave your comments on the idea. I am happy to read your views.
Gold stabilizes. Sets a new high?Gold continues to rise, with uncertainty in trade negotiations and the outcome of the Federal Reserve meeting being key variables. If no agreement is reached before August 1, the high tariffs imposed by the United States on major trading partners may trigger greater risk aversion demand, pushing gold prices further up; if the negotiations make a breakthrough, the market risk appetite will rebound, and gold prices may face correction pressure.
Gold has shown a strong upward trend recently. It closed with a small positive on Friday last week and closed with positive for two consecutive trading days this week, forming a three-day positive trend, with strong short-term momentum. In terms of indicators, the moving average diverges upward, with obvious bullish trend characteristics, and the support below needs to focus on the moving average performance. At present, the gold price has broken through the trend line formed by connecting the previous high points. The primary focus on the upside is near the previous high of 3452, which is an important short-term resistance level. The upper focus is on the previous high of 3452, which is an important short-term resistance level.
The first support below is the 3390-3385 area, which is close to yesterday's low and is also an early trading intensive area. The second support focuses on the vicinity of 3360.
In terms of operation, it is still mainly low-long, and short selling is not considered before the upward trend reaches 3450.
Operation strategy:
Short around 3450, stop loss 3460, profit range 3430-3310
Long around 3400, stop loss 3390, profit range 3420-3430
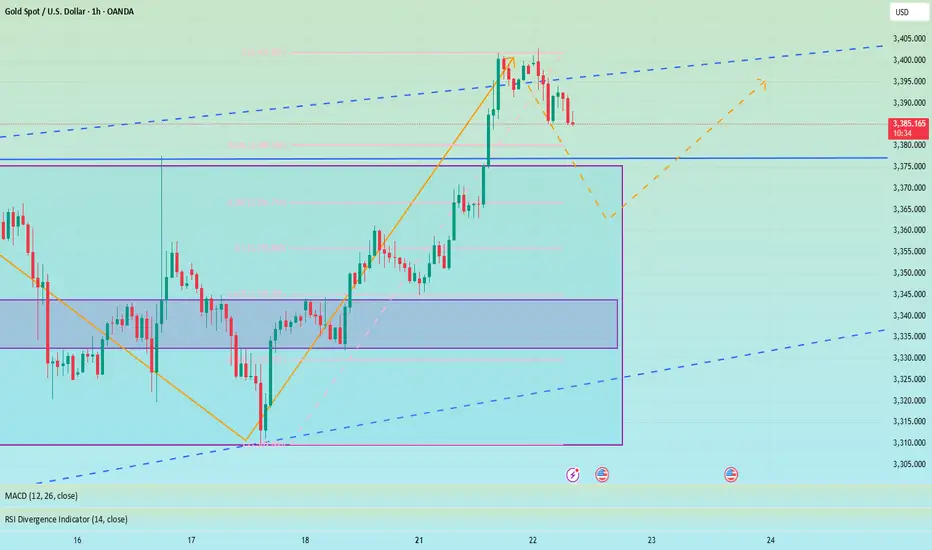
XAU/USD (Gold vs. USD) chart structureXAU/USD (Gold vs. USD) chart structure
**Chart Overview**
* **Current Price:** \~\$3,393
* **Indicators Used:**
* EMA 7, EMA 21 (short-term momentum)
* Bollinger Bands (20 SMA, 2 Std Dev)
* **Support Zones:**
* **S1:** \~\$3,392 – recent demand zone and confluence with EMAs
* **S2:** \~\$3,380 – deeper demand zone below
* **Resistance Zone:** \~\$3,403 – recent swing high and upper Bollinger Band
**Structure & Price Action Analysis**
**Bullish Impulse**
* A strong uptrend is visible prior to the current retracement, with consecutive higher highs and higher lows.
* Volume surged during the breakout around July 21, confirming strong bullish participation.
**Current Pullback**
* Price has rejected the **\$3,403 resistance**, causing a drop back to the **S1 demand zone**.
* This pullback is landing near the **EMA21 and lower Bollinger Band**, where buying interest may reappear.
**Possible Scenarios**
1. **Bullish Scenario (Green Path):**
* Price holds **above \$3,390–\$3,392 (S1)** support zone.
* Forms a **higher low** and reattempts a move toward **\$3,403** and potentially **\$3,420–\$3,435**.
* Confirmation: Bullish engulfing or reversal candles with volume near S1.
2. **Bearish Scenario (Red Arrow Path):**
* Price breaks below **S1 and EMA21**, losing bullish momentum.
* Next support is **S2 near \$3,380**, and if broken, it opens downside toward **\$3,365–\$3,350** zones
**Technical Confluence**
* **EMA Support:** EMA21 and EMA7 are still bullish-aligned but price is now testing them.
* **Bollinger Bands:** The price touched the upper band and is now mean-reverting. If it finds support at the midline or lower band, the bullish trend can continue.
* **Volume:** Volume spike during the breakout; recent drop is on lower volume, suggesting it may be just a pullback.
**Conclusion**
The structure remains bullish **as long as price stays above \$3,390/S1**. A bounce here could lead to continuation toward \$3,420+. However, **a break below \$3,390** may shift the structure toward bearish correction, targeting \$3,380 or lower.

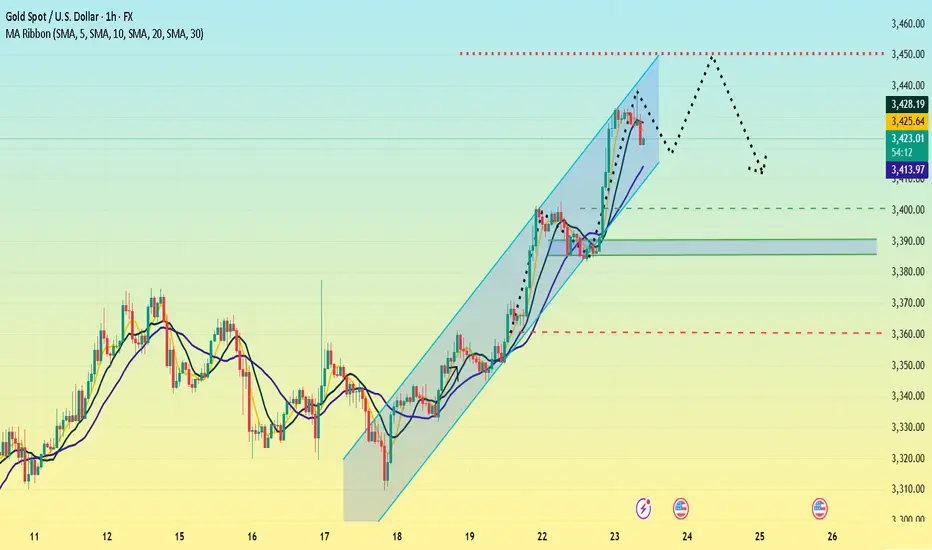
Completion of rising wedge Gold is currently still holding rising channel along with the swing moves we were on buy at 3410 and my optimal target was 3425-3430 which is achieved now I'm expecting the reversal move!!
What's possible scanarios we have?
▪️I'm looking for sell opportunity from 3430-3435 area by following our structural strategy, also we have previous moves on Rising channel, market always respect its prevoius BOS and my Selling trade target will be 3405 then 3395 in extension.
▪️if H4 candle closing above 3435-3438 this Parallel moves will be invalid.

Bulls are still the main theme, 3400 is not the high point📰 News information:
1. Fed Chairman Powell delivers a welcome speech at a regulatory conference
2. The tariff deadline is approaching
📈 Technical Analysis:
Today's opening high reached around 3402, and did not effectively break through the upper resistance of 3405-3415. As I said yesterday, a decline and return to the moving average is an inevitable result. The tariff issue is still there, with the deadline on August 1, and the daily MACD indicator still shows a golden cross. The general direction of short-term bullishness has not changed, but from a technical point of view, gold still has room to fall to correct the overbought part.
Below the day, we first focus on the top and bottom conversion position of 3377-3375. As time goes by, the 4H middle track will probably resonate with the 50% position of the Fibonacci line at 3355, which is also a good long position I expect. Therefore, if the price falls back to 3380-3375 for the first time during the day, you can consider going long. If the price continues to fall, pay attention to the second opportunity to go long at 3355, with the target at 3390-3410.
🎯 Trading Points:
BUY 3380-3375
TP 3390-3410
BUY 3360-3350
TP 3370-3380
In addition to investment, life also includes poetry, distant places, and Allen. Facing the market is actually facing yourself, correcting your shortcomings, facing your mistakes, and exercising strict self-discipline. I share free trading strategies and analysis ideas every day for reference by brothers. I hope my analysis can help you.
TVC:GOLD PEPPERSTONE:XAUUSD FOREXCOM:XAUUSD FX:XAUUSD OANDA:XAUUSD FXOPEN:XAUUSD
Gold is under pressure. Can it break through?Since the "W bottom" pattern was formed at the low of 3344 US dollars, the gold price broke through the neckline of 3380 and further stabilized at 3400 today, confirming the continuation of the medium-term upward trend. The moving average system is arranged in a bullish pattern, with the 5-day, 10-day and 20-day moving averages diverging upward in turn, and the support strength is stable.
The MACD indicator golden cross continues to expand, the upward momentum is enhanced, and no divergence occurs; the RSI indicator rises to around 76. Although it enters the overbought range, there is no obvious turn, indicating that the bullish momentum is still being released.
The current support level has risen to around 3390, and the support level has risen sharply. The resistance position needs to pay attention to 3430-3440. At present, several times have tested above 3430, but they have not stabilized above this position.
Operation suggestions:
3390-3400 light position to try more, stop loss 3360, profit range 3435-3445.
If it encounters resistance and falls back near 3435, you can consider short-term short orders with stop loss at 3445 and profit range at 3400-3380.
Although the upward momentum continues, some risk information still needs to be paid attention to; this week, we need to pay attention to the US June existing home sales data (July 23), the preliminary value of the second quarter GDP (July 25) and the core PCE price index (July 26). If the data is stronger than expected, it may trigger expectations of interest rate cuts.
The bull market of xauusd continues, buy and wait for the rise.As predicted in the band trading center in advance over the weekend. The daily level trend is still very stable, and the breakthrough trend has been perfectly carried out. The current quotation is 3388. It is only a matter of time before it rises wildly to the position of 3430. The short-term will definitely break through. The current bull market is clear and has huge potential. The limit of the triangle consolidation phase is about to be broken. Then the bulls will continue to rise. Therefore, buying is the key operation plan.
XAUUSD:Retracement is a buying opportunityAfter the Asian market hit the highest position of 3403, there was some decline. The current gold price is 3386. From the short-term trend of the hourly level. It is still fluctuating at a high level. Combined with the trend of the daily level, there are signs of retracement and counterattack. There is no news dominance. It is purely a technical repair after hitting the high. This retracement can pay attention to the support near 3382-3378. The London and New York markets are still based on buying and profit.

Don't chase the bullish trend,wait for the short position layout#XAUUSD
The tariff policy recently announced by the US government is undoubtedly the focus of the current gold market. Trump also tied the tariffs to the trial of former Brazilian President Jair Bolsonaro, adding to policy uncertainty. ⚖️
The implementation of the tariff policy may push up commodity prices, thereby exacerbating inflationary pressure, which is both an opportunity and a challenge for gold📊. On the one hand, rising inflation expectations may enhance the attractiveness of gold as an anti-inflation asset; on the other hand, the strengthening of the US dollar and US Treasury yields may offset this positive. 💡
At present, the lower support has moved up to the 3375-3365 area, where a top-bottom conversion position will be formed. The upper short-term resistance level is 3387-3393, the previous high. If the market touches this for the first time, you can try to see a double top fall.
🚀SELL 3385-3390
🚀TP 3365-3355
It’s the right time to go long on gold!Yesterday, gold maintained an overall volatile upward rhythm. Although we maintained a bullish mindset, there was no ideal low-long entry position overall. Currently, gold is above 3380 and below 3410, and the small range remains between 3380-3403. Focus on the top and bottom conversion support position of 3380-3370 during the day. As time goes by, the 4-hour middle track will probably form a resonant support with the Fibonacci 0.5 position, which is an ideal long entry point. Focus on the pressure near 3410-3420. If the upward attack fails to break through this range, you can short sell with a light position.
Gold operation suggestion: go long when it falls back to around 3383-3370, and target the 3400-3410 area.

Gold 3400, gold price returns strongly
💡Message Strategy
The Fed's monetary policy divergence has intensified. Fed Board member Waller advocates a 25 basis point rate cut in July, believing that tariff inflation is temporary; Board member Kugler insists on maintaining high interest rates to fight inflation; Chicago Fed member Goolsbee believes that the latest consumer price index data shows that tariffs have pushed up commodity inflation, and is "slightly concerned" about this, but then expounds on a different view, that is, interest rates are expected to fall sharply in the coming year. It implies that there may be a "substantial rate cut" in the next 12 months.
At present, the Fed has gradually begun to prepare for a rate cut. Whether this is the result of pressure from Trump or the Fed has gradually shown optimism about inflation and concerns about recession, a rate cut is imminent. At present, the market expects the probability of a rate cut in July to rise to 30%, and the probability of a rate cut in September to 54%.
In terms of tariffs, the countdown to August 1 tariffs: the United States plans to impose a 30% tariff on the EU/Mexico, and the EU has drawn up a retaliation list of $84.1 billion. The US Secretary of Commerce expressed confidence that an agreement can be reached with the EU, and small countries need to pay a 10% base tariff. Tariffs will be levied on August 1.
At present, Trump has a tough stance, requiring the minimum tariff of the European and American agreement to be set at 15%-20%, and the scope of exemptions is narrowed (only aviation, medical equipment, etc.). The deadline is approaching, and the market has also begun to start a risk-averse expectation mode.
📊Technical aspects
From the 1H cycle trend structure, gold is currently rebounding upward and breaking through the 4H level downward trend line. From the indicator point of view, the 1-hour level Ichimoku Kinko Hyo indicator breaking through the baseline on the turning line, the delay line stands firmly above the K line, the future cloud is an upward cloud, and the bullish signal is significant.
Gold is currently in the center of the rising channel cloud. Today, we can focus on the support brought by the lower boundary of the channel and try to go long.
Gold rose as expected, and the bulls began to remain strong. Once gold breaks through the upper pressure, it will continue to gain momentum, and gold bulls are expected to reach a higher level.
💰Strategy Package
Long Position:3370-3380,SL:3350,Target: 3420,3400