XAU/USD Chart Analysis: Gold Price Stabilises Around $3,300XAU/USD Chart Analysis: Gold Price Stabilises Around $3,300
Throughout May, a turbulent news backdrop — involving both international trade tariffs and armed conflicts — led to the formation of a peak around $3,430 and a low near $3,130 on the XAU/USD chart. As of today, the price per ounce stands around $3,300 — roughly the same level as at the beginning of the month.
This suggests that supply and demand forces are largely balanced, keeping the price contained between these extremes. The XAU/USD chart provides further confirmation, emphasising the significance of the $3,300 level.
Technical Analysis of the XAU/USD Chart
From a bearish perspective: The A→B→C→D→E sequence forms lower highs and lower lows — a clear sign of a downtrend. This trajectory is marked in red, with the upper line acting as resistance.
From a bullish perspective: Since the beginning of 2025, the gold price has been moving in an uptrend,indicated by a blue channel, with its lower boundary serving as key support (highlighted with arrows).
Notably, these support and resistance lines are converging, forming a narrowing triangle — an indication that supply and demand are balancing, finding consensus around the $3,300 level, where the axis of the triangle lies.
Given this, it is reasonable to assume that in June, the gold price on the XAU/USD chart may continue to fluctuate within this triangle — unless an extraordinary event causes a significant shift in the current balance.
This article represents the opinion of the Companies operating under the FXOpen brand only. It is not to be construed as an offer, solicitation, or recommendation with respect to products and services provided by the Companies operating under the FXOpen brand, nor is it to be considered financial advice.
Goldprice

Gold awaits tariff volatility!
📌 Driving Events
Gold rebounded from a weekly low near $3,245 and broke through the $3,300 mark on Thursday, boosted by optimism following a weaker-than-expected U.S. jobs report and a U.S. court ruling halting President Trump's proposed tariffs.
Gold fell on Friday as the dollar rose slightly, while investors await a U.S. inflation report that could provide further insights into the Fed's policy trajectory.
📊 Commentary Analysis
The market continued to fall for an hour, fluctuating back and forth, lacking continuity - it rose yesterday and fell today. Gold rebounded above $3,320 in early trading before retreating. On the weekly and daily charts, the trend is still dominated by range fluctuations rather than unilateral gains or losses.
I think shorting gold should be considered today, with support below at $3,280-3,270-3,260. However, prices may struggle to make new lows. As today is the monthly close, large fluctuations suggest that we should avoid chasing ups and downs.
💰Strategy plan
XAUUSD
Sell: 3330-3320-3310
tp: 3300-3290-3280

XAU/USD 30 May 2025 Intraday AnalysisH4 Analysis:
-> Swing: Bullish.
-> Internal: Bullish.
Analysis and bias remains the same as analysis dated 23 April 2025
Price has now printed a bearish CHoCH according to my analysis yesterday.
Price is now trading within an established internal range.
Intraday Expectation:
Price to trade down to either discount of internal 50% EQ, or H4 demand zone before targeting weak internal high priced at 3,500.200.
Note:
The Federal Reserve’s sustained dovish stance, coupled with ongoing geopolitical uncertainties, is likely to prolong heightened volatility in the gold market. Given this elevated risk environment, traders should exercise caution and recalibrate risk management strategies to navigate potential price fluctuations effectively.
Additionally, gold pricing remains sensitive to broader macroeconomic developments, including policy decisions under President Trump. Shifts in geopolitical strategy and economic directives could further amplify uncertainty, contributing to market repricing dynamics.
H4 Chart:
M15 Analysis:
-> Swing: Bullish.
-> Internal: Bearish.
Analysis and bias remains the same as analysis dated 22 May 2025.
In my analysis from 12 May 2025, I noted that price had yet to target the weak internal high, including on the H4 timeframe. This aligns with the ongoing corrective bearish pullback across higher timeframes, so a bearish internal Break of Structure (iBOS) was a likely outcome.
As anticipated, price targeted strong internal low, confirming a bearish iBOS.
Price has remained within the internal range for an extended period and has yet to target the weak internal low. A contributing factor could be the bullish nature of the H4 timeframe's internal range, which has reacted from a discounted level at 50% of the internal equilibrium (EQ).
Intraday Expectation:
Technically price to continue bullish, react at either premium of internal 50% EQ or M15 demand zone before targeting weak internal low priced at 3,120.765.
Alternative scenario:
Price can be seen to be reacting at discount of 50% EQ on H4 timeframe, therefore, it is a viable alternative that price could potentially print a bullish iBOS on M15 timeframe.
Note:
Gold remains highly volatile amid the Federal Reserve's continued dovish stance and persistent geopolitical uncertainties. Traders should implement robust risk management strategies and remain vigilant, as price swings may become more pronounced in this elevated volatility environment.
Additionally, President Trump’s recent tariff announcements are expected to further amplify market turbulence, potentially triggering sharp price fluctuations and whipsaws.
M15 Chart:

Monthly closing bet. Opening a falling gap?Information summary:
At 8:30 a.m. on Friday, U.S. time, the U.S. Bureau of Economic Analysis will release the personal consumption expenditure (PCE) price index for April. As the most favored inflation indicator of the Federal Reserve, the year-on-year change in the core PCE price index has a greater impact on policymakers.
If the data is released, the core PCE price index in April rises faster than expected, and the direct reaction of the market may lead investors to prefer the policy rate to remain unchanged in July. In this case, the U.S. dollar may gather strength, causing gold prices to fall before the weekend.
Market analysis:
Gold prices rose as high as 3322 in the early Asian session, and then fell without a dollar line. As of now, the lowest price has retreated to the 3290 U.S. dollar line. At present, it is not ruled out that gold will fluctuate widely; but the trend view is still biased towards the short side. The strength of the current rebound still depends on the strength of the European session. In the European session, the operation will focus on the vicinity of 3310 U.S. dollars first, and the pressure will still look down to 3280 U.S. dollars.
However, if the European session falls directly below $3,285, there is still room for decline, and the support is around 3,250. In addition, today is the last day of the monthly line closing, and the range of fluctuations has not yet left, so you can continue the short strategy.
Operation strategy:
Short around $3,310, stop loss at $3,320, and profit range around $3,250.

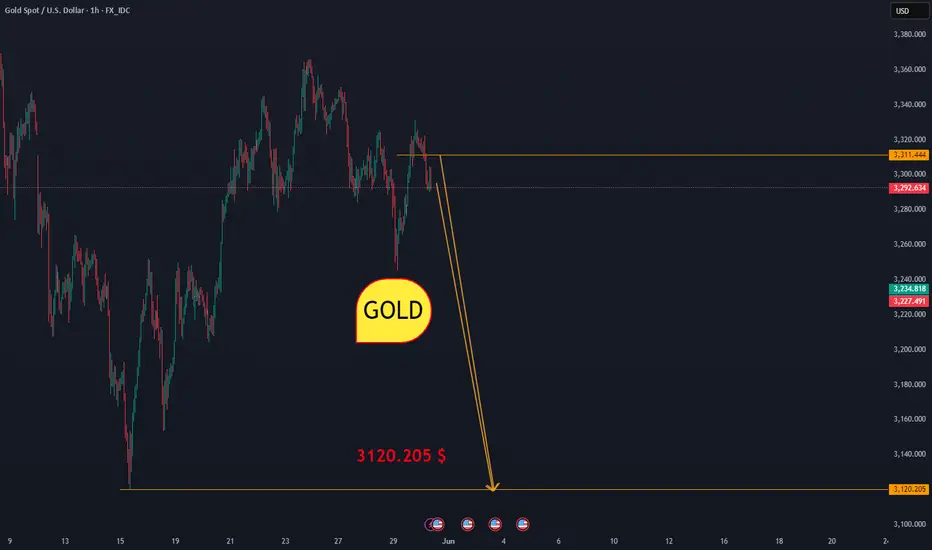
GOLDThe possibility of a fall to 3120.20 is smooth and the situation will only become critical when the price crosses above 3325. This fall may have traps.
CMCMARKETS:GOLD
Tariff policy reversed again? Be careful on Friday.Yesterday, Trump and the US Trade Court ruled that the US International Trade Court had stopped the tariff policy. Gold once fell to a low of 3245, while the US dollar rushed all the way to a high of 100.5. Then it reversed, and gold began to rectify and rise. As of now, it has once touched a high of 3330, close to a rebound of $85.
Today, it reversed again. The US Court of Appeals allowed Trump's tariff policy to continue to take effect temporarily. And impose tariffs on most areas of the global economy, including allowing tariffs of up to 15% within 150 days to address trade imbalances with other countries. Compared with the tariff policy that was deemed illegal this week, this step is more legally defensible.
Looking at the current gold, it is likely that gold will fall sharply today. After gold fell yesterday, everyone wanted to short gold, but gold rebounded all the way.
So, today, Friday, is an opportunity for short-selling strategies. The short positions have been eliminated, so gold has every reason to fall, and it will fall sharply.
Once it falls below 3280 in the downward trend, it will test the low point of yesterday near 3250. If it breaks through 3250 again, it will go directly to the low point near 3200. The current short-selling strategy has little to do with technical analysis, it is completely a test of human nature.

Gold May Undergo Short-Term Correction Amid Technical Resistance📊 Market Overview:
Gold is currently trading around $3,314/oz, slightly down after testing resistance near $3,350. The market faces pressure from a strengthening USD and inflation concerns. Investors are closely monitoring signals from the Federal Reserve regarding future monetary policy.
📉 Technical Analysis:
• Key Resistance: $3,350
• Nearest Support: $3,200
• EMA: Current price is near the 50-day EMA, indicating a potential trend reversal if resistance holds.
📌 Outlook:
Gold may decline in the short term if it fails to break above the $3,350 resistance and the USD continues to strengthen.
💡 Suggested Trading Strategy:
SELL XAU/USD at: $3330
o 🎯 TP: $3,310
o ❌ SL: $3,340
BUY XAU/USD at: $3,230
o 🎯 TP: $3,250
o ❌ SL: $3,220

Gold is still washing out, beware of a fall below 3326!
📊Comment Analysis
After gold fell in the Asian session, the entire European session rebounded continuously, and the US session hit the 3318 line. Overall, it is still a wide range of shocks and washes out. No matter whether it rises or falls, it is not continuous, and the fluctuation range is large, which is difficult to grasp in short-term operations.
The current rise cannot be regarded as a strong trend. The characteristic of the shock market is repetition. The 4H cycle opens at 3326 as a watershed. Beware of a fall below this position in the US session. You can try to go short near 3320/3325. At present, it is a key position to bet on the short position. If it goes up, it will be 3340/3350. The rise in a short period of time is too large, and once it falls back, the strength will be the same.
⭐️ Note: Labaron hopes that traders can properly manage their funds
- Choose a lot that matches your funds
- Profit is 4-7% of the fund account
- Stop loss is 1-3% of the fund account

Gold is still washing out, ready to go short
After gold fell today, the entire European session rebounded continuously, and the US session hit the 3318 line. Overall, it was still a wide range of shocks and wash-outs. No matter whether it rose or fell, it was not continuous, and the fluctuation range was large, which was difficult to grasp in short-term operations.
The current rise cannot be regarded as a strong trend. The characteristic of the shock market is repetition. The 4H cycle opened at 3326 as a watershed. Be careful of falling back below this position. You can try to go short near 3320/3325. At present, it is a key position to bet on the short position. If it goes up, it will be 3340/3350. The short-term rise is too large. Once the fall is strong, it will also be the same. If you step back, you can pay attention to the rising 0.5 and 0.618 supports.

Don't define the price of gold
💡Message Strategy
The U.S. International Trade Court ruled that Trump's tariffs exceeded his authority. Once the ruling was made, market risk appetite quickly rebounded, driving global risk assets up and safe-haven assets such as gold came under selling pressure. The price of gold fell to $3,245 during the Asian trading session, hitting a 10-day low.
In addition to the weakening of risk aversion, the minutes of the Federal Reserve's May meeting reinforced the market's expectation that it would "maintain interest rates unchanged for a long time". In addition, the generally strong US economic data released this week caused the US dollar index (DXY) to return to the 100 mark, which put continued pressure on gold, a non-interest-bearing asset.
📊Technical aspects
Technically, gold price fell below the short-term rising trend line and the 200-period moving average of the 4-hour chart, and the short-term trend turned bearish. If it falls below the key support of $3,245 (50% Fibonacci retracement level), it may further point to $3,215 (61% retracement) or even $3,200 and $3,180. The upper rebound resistance is located at $3,300, $3,325 and $3,350 respectively.
From the daily chart, gold (XAU/USD) closed negative for the fourth consecutive day. The price has effectively fallen below the lower track of the short-term rising channel and continued to run below the 10-day and 15-day moving averages, indicating that the short-term momentum has weakened. The MACD fast and slow lines have a dead cross, and the green column is enlarged, further confirming the short signal.
Currently, the vicinity of $3245 is the support of the previous shock range. Once it is lost, the 61.8% Fibonacci retracement level of $3215 will be tested below, and even approach the psychological integer level of $3200.
If the gold price is supported in this area, it is expected to build a staged bottom; on the contrary, if it falls below $3200, it will look down to the $3150-3110 area. The short-term rebound needs to pay attention to the pressure level near $3300, which is also the dense intersection area of the previous moving averages. The overall structure suggests that the shorts are dominant.
💰 Strategy Package
Short Position:3310-3320,3340-3350

XAU/USD on the 45-minute timeframeSupport Zone Rejection (around 3,250 USD):
Price sharply reversed after testing a key support area (highlighted with a circle).
Volume increased at the reversal point, signaling strong buyer interest.
Break Above Minor Resistance (~3,280 USD):
Price has broken above the immediate resistance level with strong bullish momentum.
A bullish candle has closed above this zone, indicating a potential continuation.
Next Target Resistance Zones:
First Target: Around 3,320 USD, which aligns with a previous structural high and supply zone.
Final Target: Around 3,345–3,350 USD, representing a major resistance zone and previous swing high.
Trade Plan:
Entry: Above 3,280 (already in motion).
Target 1: 3,320
Target 2: 3,345–3,350
Stop Loss: Below 3,260 (below recent low and support zone)
Bullish Structure:
Higher low has been established.
Momentum is supported by volume confirmation

Gold's rebound is weak and the bearish trend is dominant.The 1-hour gold chart shows that the Bollinger Bands open downward, and the gold price is running near the lower track, with a weak short-term trend. If it fails to rebound effectively and break through the 3290 line, the support below will focus on the 3240-3230 area. Overall, the gold price fluctuates downward, the moving average system is in a short position, and the downward pressure is further revealed. It is currently recommended to continue to maintain a high-altitude thinking and focus on short-selling opportunities after the rebound.
In the short-term operation of gold during the day, rebound short-selling is the main focus. Pay attention to the pressure level of the 3290-3280 area above, and the support level of the 3240-3230 area below. In terms of operation strategy, it is recommended to arrange short orders when the gold price rebounds to the 3280-3290 range. This is a key pressure area, and it is necessary to pay attention to the market reaction in this range.

Gold: Primarily HigherIn our primary scenario, we expect gold to set a new all-time high as part of the ongoing beige wave I. To achieve this, the price should soon generate more upward momentum during the subordinate light green wave 5 and surpass the current all-time high from April 22. Once the wave I cycle has concluded at higher levels, we anticipate the start of a new bearish phase. However, there remains a 40% chance that the precious metal has already completed the beige wave alt.I and is now entering a fresh downward cycle. Under this alternative scenario, the price would break directly below the supports at $3,123 and $2,970.
📈 Over 190 precise analyses, clear entry points, and defined Target Zones - that's what we do.

XAUUSD Sniper Plan – May 29, 2025“Grip the Zones or Get Gripped – GDP & Claims Are Loading”
Hey GoldFxMinds crew! 🧠🚨
Hope your charts are zoomed in and your mind is zoomed out — because today is calm before the storm. With Unemployment Claims and Prelim GDP dropping tomorrow, NY is all about positioning before the macro thunder hits. So let's gear up — sniper style. 🎯
Current Price: ~3290
Bias: Neutral-to-Bullish, as long as 3285–3295 holds structure.
🟤 PREMIUM ZONES – SELL INTEREST
🔻 3314–3320 (Refined 🔥)
• M15 OB + clean FVG alignment
• EMA50/100 confluence
• Tuesday’s LH rejection → precision sniper zone
🦅 Sniper Alert: Look for CHoCH or M5 rejection candle to enter short with SL above 3322.
🔻 3328–3335
• Liquidity trap zone above yesterday's rejection
• Quick wicks + FVG gap → ideal inducement zone
🦅 Aggressive Sellers: This is the second defense line — don’t chase, react to confirmations.
🔻 3348–3360
• D1 Supply + historical OB + unfilled imbalance
• Strong selling reaction previously seen here
🦅 Swing Traders: This is your reversal fortress. Watch RSI divergence and HTF reaction.
🟢 DISCOUNT ZONES – BUY INTEREST
🟩 3285–3295
• Active H1 demand zone
• EMA200 support + Asia bounce confirmed
• RSI support holding around 38–40
🦅 Long Setup: M5/M15 CHoCH + bullish engulf = sniper trigger.
🟩 3260–3270
• Unfilled FVG + lower OB from Tuesday
• Mid-range retest level
🦅 Buyers: If NY dips below 3285, this is your second line. Wait for PA shift.
🟩 3235–3250
• HTF demand + deep discount zone
• Untapped FVG + BOS origin
🦅 Last Bullet Zone: If we nuke below all structure — this is where smart money waits.
⚡ MID-ZONE CONTROL
⚡ 3300–3308
• NY equilibrium
• Likely to chop — not for entries
🦅 Use for direction bias only after London open.
📊 STRUCTURE SNAPSHOT – H1 + M30
CHoCH confirmed → 3174 to 3285 HL
Bullish continuation possible if 3295 holds
Rejection from refined 3314–3320 zone = intraday short trigger
If we clear 3320 cleanly → expect test of 3335–3360
🧠 MACRO & NEWS CONTEXT
🗓 Tomorrow:
• 🧾 Unemployment Claims
• 📉 Prelim GDP
Big folders = big liquidity sweeps. Today, the market builds traps for tomorrow’s trigger.
🎯 BATTLE PLAN
Buy from 3285–3295 only with M5 confirmation.
Sell from 3314–3320 only on rejection + CHoCH.
Prepare backup buys from 3260 and 3245 if structure breaks.
Avoid trading in 3300–3308 – it's a trap range.
🚨 Final Note – Be The Trader, Not The Liquidity
Today’s game is reaction, not prediction. Price is setting the stage — your job is to read the script and play the sniper role. 🎯
💬 Drop a comment if you’re watching the 3314 zone like a hawk.
❤️ Smash that like & follow if these breakdowns sharpen your entries.
Let’s crush the day, stay smart, and let price prove the move.
— GoldFxMinds 💛
XAU/USD 29 May 2025 Intraday AnalysisH4 Analysis:
-> Swing: Bullish.
-> Internal: Bullish.
Analysis and bias remains the same as analysis dated 23 April 2025
Price has now printed a bearish CHoCH according to my analysis yesterday.
Price is now trading within an established internal range.
Intraday Expectation:
Price to trade down to either discount of internal 50% EQ, or H4 demand zone before targeting weak internal high priced at 3,500.200.
Note:
The Federal Reserve’s sustained dovish stance, coupled with ongoing geopolitical uncertainties, is likely to prolong heightened volatility in the gold market. Given this elevated risk environment, traders should exercise caution and recalibrate risk management strategies to navigate potential price fluctuations effectively.
Additionally, gold pricing remains sensitive to broader macroeconomic developments, including policy decisions under President Trump. Shifts in geopolitical strategy and economic directives could further amplify uncertainty, contributing to market repricing dynamics.
H4 Chart:
M15 Analysis:
-> Swing: Bullish.
-> Internal: Bearish.
Analysis and bias remains the same as analysis dated 22 May 2025.
In my analysis from 12 May 2025, I noted that price had yet to target the weak internal high, including on the H4 timeframe. This aligns with the ongoing corrective bearish pullback across higher timeframes, so a bearish internal Break of Structure (iBOS) was a likely outcome.
As anticipated, price targeted strong internal low, confirming a bearish iBOS.
Price has remained within the internal range for an extended period and has yet to target the weak internal low. A contributing factor could be the bullish nature of the H4 timeframe's internal range, which has reacted from a discounted level at 50% of the internal equilibrium (EQ).
Intraday Expectation:
Technically price to continue bullish, react at either premium of internal 50% EQ or M15 demand zone before targeting weak internal low priced at 3,120.765.
Alternative scenario:
Price can be seen to be reacting at discount of 50% EQ on H4 timeframe, therefore, it is a viable alternative that price could potentially print a bullish iBOS on M15 timeframe.
Note:
Gold remains highly volatile amid the Federal Reserve's continued dovish stance and persistent geopolitical uncertainties. Traders should implement robust risk management strategies and remain vigilant, as price swings may become more pronounced in this elevated volatility environment.
Additionally, President Trump’s recent tariff announcements are expected to further amplify market turbulence, potentially triggering sharp price fluctuations and whipsaws.
M15 Chart:

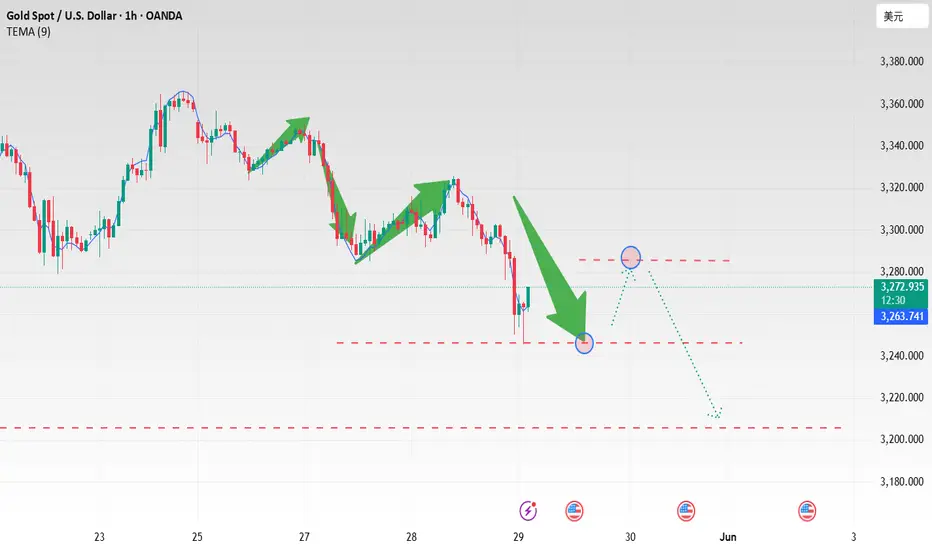
Gold shocks extreme pull, US market layout🗞News side:
1. Musk issued the "strongest" condemnation of Trump
2. Trump and Netanyahu failed to reach an agreement, and the US-Iran negotiations may be "disrupted" by Israel
📈Technical aspects:
The trading strategy we have given is still valid. The current gold price trend on the hourly chart shows a standard descending flag pattern. If this pattern continues to be effective, there is a high possibility that the gold price will fall below 3285-3280. Once it falls below this range, as we gave in the strategy this morning, it may fall to the 3260-3250 line. However, the premise for this expectation to be established is that the gold price cannot break through and stabilize on the upper track of the consolidation channel, otherwise the descending flag pattern will be invalid. Therefore, for US market operations, short positions can be arranged around the upper rail of 3325, paying attention to the suppression effect; for the lower rail, first pay attention to the support effect of 3300.
sell 3325-3330
TP 3310-3300
buy 3290-3280
TP 3310-3320
If you agree with this view, or have a better idea, please leave a message in the comment area. I look forward to hearing different voices.
FOREXCOM:XAUUSD FXOPEN:XAUUSD TVC:GOLD FX:XAUUSD OANDA:XAUUSD

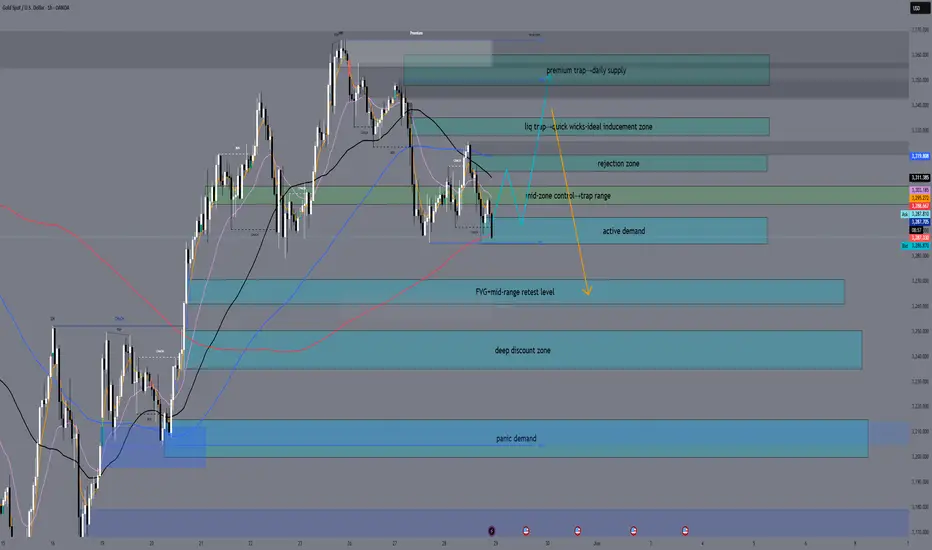
[20250526] Gold - True Bull or Liquidity Trap This Week?Key Dynamic Levels Guide: Previous Grey/Black, Green/Magenta, and Red/Blue dynamic levels mark important zones where Smart Money (SM) has positioned itself. These levels are crucial liquidity pools, as support and resistance (S/R) frequently revisit these zones. Check their values by hovering your mouse for guidance before proceeding.
4H key-level confluence can be refer in published Idea titled: Gold – Structural Bull Bias - One Leg Down Still Anticipated? refer the related post --->
📊 Weekly Market Intent – Gold Analysis
Gold has recently tested the 3360+ zone, showing renewed bullish momentum. However, system-based structure mapping suggests that this move might still be part of a broader setup—rather than a confirmed breakout.
📌 Market Structure & Key Levels
A possible ABCDE triangle structure remains in play, where price is either concluding Wave-C or initiating Wave-D. If this formation holds, a pullback toward 3044–2950 could materialize before Wave-E completes and resumes the larger bullish trend.
The market also aligns with a potential 3-Drive bearish trap, where recent highs attract late buyers before deeper liquidity moves unfold.
🔹 Key Dynamic Levels (4H Confluence):
Bull VAH (Grey Line): 3317.52 – Key retracement level in a bullish environment.
Bull POC (Light Green): 3313.55 – Defines bullish sentiment zone.
Blue Line (Bull Bias Limit): 3254.26 – A breach would indicate deeper pullback risk.
Red Line (Bear Bias Limit): 3369.81 – A decisive break suggests bullish continuation.
Liquidity Levels: 3401.21 (upper target) | 3212.57 (lower target).
🧐 Market Sentiment & Next Move
Current sentiment indicates bullish bias with bear presence, as the market attempts lower support levels before a bullish continuation.
Bullish Continuation: Price moving past 3366 could signal a breakout, with unconfirmed top resistance levels remaining untested before further upside.
Bearish Presence: Below 3313.55, sell-side pressure could intensify. Below the bull bias limit (3254.26), deeper downside traction suggests a short-cycle bearish move until a rebound occurs above the newly formed dynamic bear bias limit.
🧠 Reversal / Invalidation Conditions
Bullish Strength Holds: Trading above 3253.57, with unsuccessful bear attempts, suggests bullish sentiment remains intact.
Bearish Shift: A failed support at 3290 and successful retest reinforce downside pressure. Momentum and volume remain key for validating the shift.
📌 System-Based Order Limits
Daily Order Limits
Buy: 3350.95 | SL: 3281.20 | TP: 3399.82
Sell: 3302.39 | SL: 3372.14 | TP: 3253.52
Weekly Order Limits
Buy: 3335.02 | SL: 3192.49 | TP: 3434.89
Sell: 3235.80 | SL: 3378.33 | TP: 3135.93
Monthly Order Limits
Buy: 3374.47 | SL: 3097.33 | TP: 3568.65
Sell: 3181.54 | SL: 3458.68 | TP: 2987.36
📌 Final Insight
Market intent unfolds dynamically, and structure-driven decision-making ensures anticipation zones remain valuable references.
📢 Gawai Festival Notice: As I’ll be away for the season’s harvest festival, I may not provide further updates on next shifts. However, this weekly confluence bias should guide traders in navigating market ranges effectively.
Stay disciplined, wait for liquidity validation, and let Smart Money footprints lead the way.
Wishing all traders a profitable week ahead! See you next week. 🚀

Don't chase gold if it falls below $3,300
The Trump administration's tariff policy has been stopped through judicial procedures. Affected by this news, it is inevitable that gold will continue to fall back today: yesterday's rebound hit the resistance level and fell back to $3,325. The market fell sharply in the early trading, and the market pattern quickly changed from range fluctuations to bearish dominance. From a technical analysis, the bearish pattern of the medium-term weekly cycle is forming effective pressure. Even if there is a sharp rebound in the future and breaks through the recent highs, it is very likely to be a bull trap-essentially a precursor to a return to a downward trend after a decline.
Gold/USD
Sales @3270-3280
TP: 3250-3240
sl: 3290
⭐️ Note: Labaron hopes that traders can properly manage their funds
- Choose a lot size that matches your funds
- Profit is 4-7% of the fund account
- Stop loss is 1-3% of the fund account

Gold trading zones: 29-May-2025Good morning! Find today's Gold trading zones and enhance your market analysis.

Gold rebounded after hitting the bottom. Don't shortOn Wednesday, the New York International Trade Court of the United States stopped Trump's planned tariff policy; it ruled that Trump's act of imposing comprehensive tariffs on countries that export more to the United States than imports without the authorization of Congress was an overstep. This means that most of Trump's tariffs will be suspended.
After the news came out, gold fell rapidly, hitting a low of $3,245. It has now adjusted back and maintained around 3,270 for consolidation. From the current point of view, most traders with short strategies have taken profits around 3,250.
From the hourly chart, gold has started to pull back from $3,265 this week, and as of the current low of $3,245, it is a three-wave downward trend. The first wave fell to $3,225, and then rebounded to $3,350. The second wave fell from $3350 to $3285, and then rebounded to $3325.
The third wave of decline has been completed. According to the early decline and then the rise, the current rebound from $3245 is likely to test around $3300.
However, considering that $3285 is the previous low point, $3285 is also the upward pressure position this time.
Therefore, we should pay close attention to the pressure range of $3285-3295. If it can stabilize below $3295, then we can rely on the $3295-3285 range for short operations.
On the contrary, if the rebound is stabilized above 3300, it is necessary to stop loss in time.

Gold – Structural Bull Bias - One Leg Down Still Anticipated?Overview:
Gold has shown renewed bullish momentum, recently testing the 3360+ zone. While the rally appears impulsive, system-based structure mapping suggests it may still be part of a broader setup — not the true breakout.
We're observing a possible ABCDE triangle structure, where price is either concluding Wave-C or initiating Wave-D. If this scenario holds, the market could revisit levels below 3044, possibly toward 2950–3000, before completing Wave-E and resuming the larger bullish move.
This aligns with a potential 3-Drive bearish trap, where current highs serve to attract buyers before a deeper liquidity move unfolds.
❗ If the 3-Drive pattern is invalidated and price sustains above 3366, the downside leg may already be complete — meaning Wave-E might be in progress.
🔍 Market Intention
Signs of liquidity hunting above 3360 hint at unfinished business by Smart Money (SM) - drawing in late buyers.
Market may be positioning to sweep lows before revealing its actual direction.
🎯 Action Zone
Anticipate rejection or weakness in the 3360–3370 resistance zone.
If a lower high confirms here → potential downside toward the 3040–2950 zone.
If price breaks and holds above 3366 impulsively, it may signal early Wave-E continuation.
Bullish setups become favorable below 3044, where liquidity is likely absorbed — confirmation from the system remains key before acting.
📌 System-Based Order Limits (4H–Daily Confluence)
Bias >Entry Zone >Stop Loss (SL) >Take Profit (TP)
Sell Setup >3354.33 >3364.14 >3342.15
Buy Setup >3345.86 >3336.05 >3358.04
📌 System-Based Order Limits (Daily–Weekly–Monthly Confluence)
Levels derived based on structured order-flow logic. Not financial advice. Use them as context for anticipation and invalidation.
🔹 Daily Order Limits
Bias Entry Level Stop Loss (SL) Take Profit (TP)
Buy 3350.95 3281.20 3399.82
Sell 3302.39 3372.14 3253.52
🔸 Weekly Order Limits
Bias Entry Level Stop Loss (SL) Take Profit (TP)
Buy 3335.02 3192.49 3434.89
Sell 3235.80 3378.33 3135.93
🔻 Monthly Order Limits
Bias Entry Level Stop Loss (SL) Take Profit (TP)
Buy 3374.47 3097.33 3568.65
Sell 3181.54 3458.68 2987.36
🔁 How to Use This Information
Anticipation Zones: These are not "trade calls" — rather, they’re zones of interest where Smart Money might act.
Cross-Validation : Look for price reactions around these levels aligned with structure, volume, and bias thresholds.
Invalidation Clarity: If price breaks and holds above/below the SL levels, reassess the current wave position or pattern unfolding.
🧠 Final Insight
Including these order levels allows traders to:
Frame entries based on their preferred timeframes
See how short-term setups may align or contradict macro levels
Plan decisions more systematically, reducing emotional entries
🧠 Decision Framework
Instead of reacting emotionally, allow structure to lead the logic.
Let the market show its hand — real confirmation comes after traps are complete.
The true opportunity lies after the liquidity event, not during it.
> Timing Consideration: > When price moves past the Red, Grey, Green, and Blue dynamic levels , it signals a potential shift—prompting readiness for entry. However, action should only be taken once a Buy/Sell order signal appears and is confirmed by the next closed candle. This ensures structured execution and prevents premature entries.
💡 This scenario is structured based on system rules, not prediction. Market intent unfolds dynamically — understanding the setup allows better anticipation and discipline.
The key-level to watch for Grey, Green and Blue dynamic level for guides:
Daily TF
Weekly TF
Monthly TF
As of the time writing this update – the micro cycle and key-level are relevant for watch:
2H TF
M45 TF
M15 TF

Fed Uncertainty and Rejected Trendline ResistanceOANDA:XAUUSD TVC:GOLD Gold trades around $3,270 after rebounding from the $3,240 support zone, but remains capped below the $3,287–$3,290 resistance zone, which now acts as resistance after the breakdown. Technically, the price is struggling under a descending trendline (TL2), and the $3,287 zone also aligns with previous support turned resistance.
Fundamentally, the rejection of Trump's “Liberation Day” tariffs by the U.S. trade court helped ease risk sentiment, reducing safe-haven demand and pressuring gold. At the same time, market focus shifts to today’s U.S. GDP data and Friday’s Core PCE inflation report—both of which may sway Fed expectations and drive short-term volatility.
If XAU/USD fails to break back above $3,287, a renewed test of the $3,240 breakout zone is likely. Sustained downside may open the path to $3,207 or lower. On the upside, reclaiming $3,290 would weaken the bearish bias and challenge the TL2 trendline.
Resistance : $3,287 , $3,302
Support : $3,240, $3,207

Risk aversion cools down, gold may continue to fall
📌 Driving events
The International Trade Court in Manhattan, USA, blocked Trump's "Liberation Day" trade measures. This news is conducive to shorting gold. This news is undoubtedly a reversal of Trump's "reciprocal tariff" policy implemented on April 3, slapping Trump in the face! Gold has been mainly driven by tariffs this year, and the decline is mainly due to the easing of tariffs. Spot gold has fluctuated sharply recently. After opening at $3285.91/ounce in the Asian session, it reached a high of $3294.46/ounce, and then fell sharply. The lowest reached around $3240 and continued to fall.
📊Comment analysis
The volatility of the Asian session highlights the fierce game between long and short positions. The changes in risk aversion caused by previous geopolitical and economic data, and investors' profit-taking and other factors are intertwined. Subsequent investors need to keep a close eye on key information such as the minutes of the subsequent Federal Reserve meeting in order to grasp the trend of gold prices.
💰Strategy Package
After the Asian session opened, gold was affected by the news and quickly plunged through the 3280-85 area support. After a rapid decline in important support, the upper 3280-85 constituted the next strong resistance, the strong and weak dividing line. Below it, the weak position is expected to gradually fall to 3245-50 before reversing the short pattern, and further to 3225-20 and 3200. Given that the 3250-45 area is a recent bullish breakthrough, the 3245-50 area support is bound to usher in a strong rebound during the day, and further attention will be paid to the 3220-25 area and the 3200 mark support rebound. Refer to it to formulate trading strategies!
⭐️ Note: Labaron hopes that traders can properly manage their funds
- Choose the number of lots that matches your funds
- Profit is 4-7% of the fund account
- Stop loss is 1-3% of the fund account