With Bullish bias into new Week - 2025/05/26Last week, I published my idea for a whole week with daily updates for the first time. You can read about it here:
🎯 The target of $3348 was reached on Friday due to the announcement of new tariffs against the European Union.
💡 Here is my idea for the week from May 26-30, 2025.
First things first, the Friday session last week ended with bullish momentum. Even though the gold price consolidated more at the $3366 mark, it was obviously to allow time to pass and calm down stressed values like EMA or MACD. This is a very good sign for the start of the week because if the Asia timezone takes the invite, the gold price has a good chance to rise. My expectation is a bullish GAP right at the beginning; if so, it's a clear sign for the rest of the day, in my opinion. These thoughts would support my goal from above $3500 during the week.
📰 Geopolitical News Landscape
India / Pakistan
The ceasefire from May 10 remains tense but intact. Both sides claim victory, while Pakistan strengthens ties with China. Cross-border attacks have ceased, but mutual distrust persists.
➡️ Situation remains fragile; renewed escalation is possible.
Gaza Conflict
Israel intensifies "Gideon’s Chariot" with ground forces in Khan Younis. Mass evacuations and high civilian casualties worsen the humanitarian crisis. Peace talks have stalled as the offensive continues.
➡️ No relief in sight; humanitarian conditions are deteriorating further.
Russia / Ukraine
On May 24, Russia launched its largest air assault yet with 367 missiles and drones—13 civilians were killed. Just before, both sides exchanged 1,000 prisoners. Peace talks remain suspended.
➡️ Violence is escalating; a ceasefire remains out of reach.
U.S.–China Trade War
The 90-day tariff pause triggered a rush to import from China. Shipping bottlenecks and high freight rates are straining businesses. Structural issues remain unresolved.
➡️ Short-term easing; long-term tensions persist.
Trade War on global view
The global trade war has escalated in May 2025, with the U.S. imposing a 50% tariff on EU imports and a 25% levy on foreign-made smartphones, citing trade imbalances. The EU has condemned these moves, warning of potential retaliation. In response to U.S. tariffs, China has restricted rare earth exports, impacting global supply chains. ASEAN nations, heavily affected by U.S. tariffs ranging from 10% to 49%, are urging deeper regional integration to mitigate economic disruptions. The IMF has downgraded global growth forecasts to 2.8% for 2025, citing trade tensions and policy uncertainty. Supply chains are being restructured, with companies shifting production to countries like Vietnam and Mexico. Financial markets are volatile, with increased inflationary pressures and investor anxiety.
➡️ Emerging markets face currency volatility and economic instability due to the ongoing trade conflicts.
⚖️Trump vs. Powell
President Trump increases pressure on Fed Chair Powell to cut rates. The Fed holds interest rates at 4.25–4.5% and warns of inflation. A 10% staff reduction is planned to boost efficiency.
➡️Political interference is increasingly destabilizing markets.
U.S. Inflation – April 2025
Inflation dropped to 2.3%, the lowest since February 2021. However, consumer inflation expectations remain high at 7.3%. The University of Michigan Consumer Sentiment Index fell to 50.8—a historic low.
➡️A clear gap is emerging between official data and public perception.
🔋 Technical Analysis – Short-Term
📊 Analysis: May 19–24, 2025
Weekly Low: $3,204 (May 20)
Weekly High: $3,366 (May 23)
Weekly Close (May 23): approx. $3,358
Total Gain: +5%
🟢 Trend: A clear uptrend is evident. After hitting a low of $3,204 on May 20, gold experienced a strong rally, forming consistently higher highs and higher lows. A brief pullback on May 22 was quickly bought up.
📈 Structure: A series of bullish flag patterns developed, each resolving to the upside. The high at $3,366 currently marks the most significant resistance level.
🔮 Outlook from May 26, 2025
Resistance: $3,366 (recent high)
Support: $3,310 (last local low), below that $3,280 (breakout zone)
Bias: Bullish as long as price holds above $3,310
📌 Scenario 1 – Bullish Breakout: A sustained breakout above $3,366 could unlock further upside potential toward the $3,390–$3,410 area. When Asia session starting with bull GAP the Scenario is the one i preffer.
📌 Scenario 2 – Pullback: A retracement to the $3,310–$3,280 zone would be a healthy correction within the trend, provided this zone holds.
🧭 Conclusion:
Gold remains in a steady uptrend. As long as support levels hold, a continuation toward $3,500 is likely. RSI may be overbought on higher timeframes, so short-term consolidations are possible, but structurally the setup remains bullish.
Anything to ad? Feel free to tell your thoughts.
-------------------------------------------------------------------------
This is just my personal market idea and not financial advice! 📢 Trading gold and other financial instruments carries risks – only invest what you can afford to lose. Always do your own analysis, use solid risk management, and trade responsibly.
Good luck and safe trading! 🚀📊
Goldprice

XAU/USD) 3 top technical analysis Read The ChaptianSMC trading point update
Technical analysis (XAU/USD) on a 4-hour timeframe, with key elements and potential price scenarios illustrated. Here's a breakdown of the idea behind this analysis:
---
1. Key Levels and Zones
Resistance Zone (~3,320–3,330):
Marked with red arrows indicating multiple rejections.
A crucial supply zone that the price failed to break several times.
Support Zone (~3,280–3,290):
Labeled as “nak support level” (likely means "neckline" support in a possible head-and-shoulders structure or just a key level).
Important for bullish structure continuation.
Lower Target Zone (~3,205):
A demand zone if the support fails.
Labeled as another “target point” indicating a bearish projection.
---
2. Trend Context
The price was in an upward channel (highlighted as "up trend"), which has now been broken.
EMA 200 (~3,251) is acting as a dynamic support.
---
3. Potential Scenarios
Bullish Scenario (Red/Blue Arrows Up):
If the price holds the “nak support level” and breaks back above resistance (~3,320):
A bullish move toward 3,367 and even 3,435 is expected.
The blue arrow shows a projected upside target of ~105 points.
Bearish Scenario (Black Arrow Down):
If the price breaks below the neckline/support and EMA 200:
A drop toward the 3,205 area is anticipated.
Target aligns with previous structure lows and a clean demand zone.
---
4. RSI Indicator (Bottom Panel)
RSI is hovering around neutral (~45–50), offering no strong momentum bias.
Could support either a bounce or a breakdown, depending on upcoming moves.
Mr SMC Trading point
---
Conclusion / Idea Summary
This chart presents a conditional trade setup:
Above 3,320: Long toward 3,367–3,435.
Below 3,280–3,250 (and EMA 200): Short toward 3,205.
The market is currently at a decision point, and traders should wait for confirmation (breakout or breakdown) before entering a trade.
Pales support boost 🚀 analysis follow)

XAU/USD) Bearish trand analysis Read The ChaptianSMC trading point update
Technical analysis for Gold (XAU/USD) on the 4-hour timeframe. Here's a breakdown of the key ideas and strategy behind it:
---
Key Elements of the Chart:
1. Descending Channel Pattern:
Price is moving within a descending channel (downward sloping resistance and support lines).
The red arrows mark previous rejections from the upper boundary of the channel.
2. Supply Zone / Resistance Area:
Highlighted in yellow, the price has entered a supply zone (between 3,412.00 and 3,440.42), historically where selling pressure has emerged.
The analysis suggests sellers may dominate again in this zone.
3. Price Action Projection:
Expected to reject from the supply zone, possibly forming a lower high.
Price is projected to break the short-term upward trendline, then fall sharply.
4. Target Points:
First target: 3,206.96 – likely aligned with a minor support level or Fibonacci retracement.
Second target: 3,085.56 – near the lower boundary of the descending channel.
5. EMA 200 (3,238.55):
Price is currently above the 200 EMA, but the projection anticipates a breakdown below it, confirming further bearish sentiment.
6. RSI Indicator:
RSI is at 67.56, near overbought territory, suggesting limited upside and a possible correction.
---
Trade Idea Summary:
Bias: Bearish
Entry Zone: Between 3,412 – 3,440 (supply zone)
Confirmation: Rejection at the trendline + RSI divergence
Targets:
TP1: 3,206.96
TP2: 3,085.56
Invalidation: Break and hold above 3,440.42 (channel breakout)
Mr SMC Trading point
---
Risk Management Note:
Ensure stop-loss is placed above the resistance zone (e.g., around 3,450) to mitigate false breakouts. Monitor fundamentals like upcoming US economic data, as they can heavily impact gold.
Pales support boost 🚀 analysis follow)

Is Gold’s Momentum Strong Enough to Break $3,400?📊 Market Overview:
Gold prices retreated slightly as stronger-than-expected U.S. consumer confidence data boosted expectations that the Federal Reserve may keep interest rates elevated for an extended period. This lent strength to the U.S. dollar, weighing on gold. Meanwhile, a more stable geopolitical tone—particularly in U.S.-EU trade discussions—has reduced safe-haven flows into gold.
📉 Technical Analysis:
• Key Resistance: $3,345 – $3,355
• Nearest Support: $3,270 – $3,280
📌 Outlook:
Gold may remain under pressure in the short term if the U.S. dollar stays firm and the Fed’s hawkish stance persists. However, the $3,270 support zone remains a key pivot for any potential rebound.
💡 Suggested Trading Strategy:
SELL XAU/USD at: $3,345 - $3,350
🎯 TP: $3,325
❌ SL: $3,355
BUY XAU/USD at: $3,270 – $3,280
🎯 TP: $3,290
❌ SL: $3,260

GOLD (XAU/USD) 4H Update GOLD (XAU/USD) 4H Update
Price is holding strong above the $3,250, $3,280 demand zone with trendline support intact.
A pullback into this area could trigger the next leg up toward $3,498.
Structure remains bullish unless this zone breaks.
Watching for a bounce Target: $3,499
DYRO, NFA

Key data will be released, gold will usher in a turning point🗞News side:
1. Musk issued the "strongest" condemnation of Trump
2. Trump and Netanyahu failed to reach an agreement, and the US-Iran negotiations may be "disrupted" by Israel
📈Technical aspects:
Gold prices continued to fall this week as Trump extended the impact of increasing tariffs on the European Union. After stabilizing at 3285 and rebounding yesterday, the gains and losses at 3315 during the day are the key to the subsequent layout. The current Asian session did not stand above 3315 in the morning, which means that the short-term retracement and decline have not ended, and only by breaking through 3315 can there be a chance to continue upward. The 4H level of gold is not so strong at present. The market encountered resistance and fell back at the upper track. Now the market has touched the lower track. The Bollinger Bands have not opened and are still flat, indicating that the market is in a volatile trend in the short term. The support below 3280 just coincides with the lower track. The upper side pays attention to the resistance near the middle track of 3325. If the pressure near the middle track of 3325 is broken, it can be seen to the upper track of 3365. If the market breaks below 3280, it is expected to go to 3260-3250. The European session will temporarily maintain a high-altitude low-multiple cycle. Pay attention to 3315-3325 on the upper side and 3285-3280 on the lower side.
If you agree with this view, or have a better idea, please leave a message in the comment area. I look forward to hearing different voices.
OANDA:XAUUSD FX:XAUUSD TVC:GOLD FXOPEN:XAUUSD FOREXCOM:XAUUSD

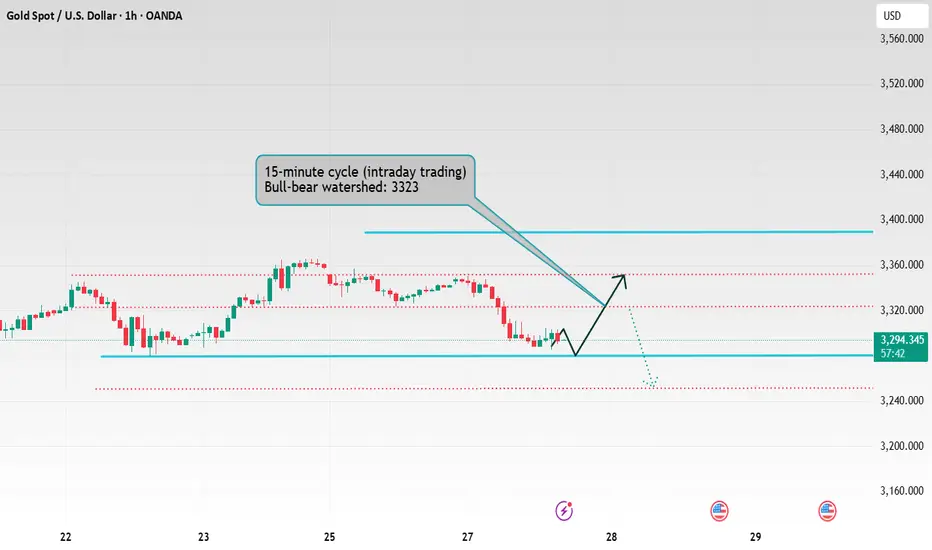
Gold is waiting for a breakthrough? A new trend?In the Asian market, gold has repeatedly tested the downward trend near $3,300. As of now, it has stabilized above $3,300 again. The current highest rebound is around $3,323. The price is under pressure at this position and keeps testing to break through this position.
From the hourly chart, the previous trend of falling from $3,365 was a decline and then rebound. The current trend from $3,350 is the same. The current market is around $3,325, which is the position we need to pay attention to.
If gold breaks through and stabilizes at $3,325 next, it will test the intraday high of $3,335.
Therefore, I suggest that you can maintain the 3,325-3,335 US dollars to enter the market for short selling. You can use yesterday's high of $3,350 as a defense. The target is the support of $3,300 below today.

Gold May Undergo Short-Term Correction as USD Rebounds📊 Market Overview:
Gold (XAU/USD) is trading around $3,320/oz on May 28, 2025, after failing to break above a key resistance zone. The US dollar’s recovery and rising Treasury yields are putting short-term pressure on gold, despite lingering geopolitical tensions.
📉 Technical Analysis:
• Key Resistance: $3,330 – $3,360
• Nearest Support: $3,280 – $3,235
• EMA 09: Price is currently above the EMA 09, indicating that the upward trend remains intact.
• RSI Indicator: RSI stays above the 50 level, suggesting momentum is still bullish.
• Candlestick Pattern: A doji near the $3,330 zone signals market indecision.
📌 Outlook:
Gold may see a mild correction if the USD continues to strengthen. However, holding above $3,280 would keep the bullish momentum alive.
💡 Suggested Trading Strategy:
🔻 SELL XAU/USD at: $3,330
🎯 TP: $3,310 (200 pips)
❌ SL: $3,340
🔺 BUY XAU/USD at: $3,285
🎯 TP: $3,305 (200 pips)
❌ SL: $3,275

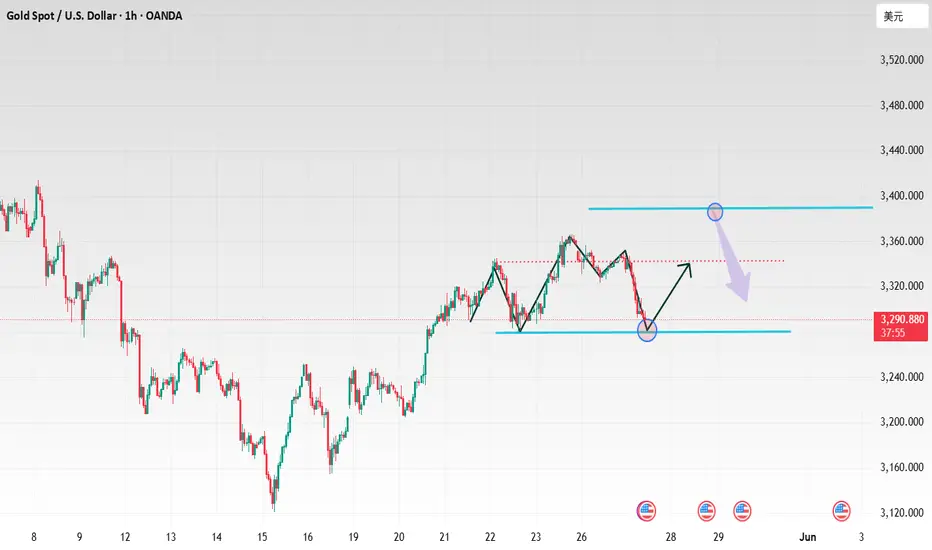
Gold is about to reach the shorting zone
The tariff policy against Europe and Apple was temporarily shelved last Friday due to the decline in the credibility of the Trump administration, which failed to push gold prices up this week. Instead, gold prices continue to fluctuate within the downward channel. Currently, the focus is on the resistance level of $3,325-3,335, and shorting can be attempted near this level.
Pay close attention to whether the support level of $3,280 and the resistance level of $3,365 are broken.

Gold fluctuates upward. Waiting for a breakthrough?Since the trend of today's Asian session is a drop before an increase, and we are currently holding long orders near 3292, the trend is still looking upward. It is about to reach the resistance position near 3325 that I predicted. This is a strong and weak dividing point in the short term. Whether it can continue to break through and move upward depends on the situation in the European session. If you hold a long position, you can continue to hold it and wait for the price to break through.
For those who have not entered the market yet, you can continue to wait and see if the upper resistance level can break through strongly. The market changes drastically. I hope everyone will make a profit today.

Gold closed with a big negative line, and may fall below 3285
📌 Driving events
On Monday, gold prices fell nearly 2%, falling below the $3,300 mark. Investor sentiment improved after U.S. President Donald Trump decided to postpone the imposition of tariffs on EU imports. The recovery in risk appetite, coupled with the dollar's small rebound from last week's decline, put pressure on the non-yielding precious metal.
Earlier, President Trump and European Commission President Ursula von der Leyen had a call over the weekend and finally decided to postpone the U.S. plan to impose a 50% tariff on EU goods to July 9. The move eased global trade concerns, prompted investors to shift away from safe-haven assets other than the dollar, and pushed global stocks higher.
📊Commentary Analysis
Gold showed a downward trend on Tuesday and has now broken below the 5-day moving average. This change has turned the market from a previous strong rise to a volatile trend. However, to determine whether the market has weakened, further observation is needed.
From the perspective of upper resistance, focus on the position near 3350. This position is not only yesterday's high point, but also the resistance position formed by the extension of the line connecting the high points of 3350 and 3438. Once the price breaks through this resistance level, it means that the market will return to a strong upward trend. In fact, it is near 3325 or the low point in the previous decline. It is necessary to pay attention to the top and bottom conversion here. The support level below is first yesterday's low of 3285 and the previous low of 3280.
💰Strategy Package
Operation strategy;
Short gold near 3325, defend 3335, target 3305-3285
Long gold near 3280, defend 3270, target 3300-3320
⭐️ Note: Labaron hopes that traders can properly manage their funds
- Choose the number of lots that matches your funds
- Profit is 4-7% of the fund account
- Stop loss is 1-3% of the fund account

Mr. President repeatedly wavered, new trend?Last Friday, Trump threatened to escalate the trade war again, suggesting that a 50% tariff be imposed on the EU from June 1. The US dollar index continued to decline during the day, falling to a low of around 99. Due to increased risk aversion demand, spot gold once rose by more than 2%, reaching a daily high of $3,365. At the opening of this Monday, Trump issued a statement to postpone the imposition of tariffs on the EU, extending the deadline for the EU to face 50% tariffs to July 9. Gold was also affected, and it has continued to rectify its downward trend this week. Yesterday, the lowest point was near 3285.
From the current daily chart, the trend support line here on the daily chart has been broken. So it is very likely that there will be a short-term correction trend on the daily line next. Once the lower 3250-3260 is broken, it will directly test the lower trend line of the daily line at 3160-3170.
From the 4-hour chart:
We can reverse the market. If we take the previous daily low of 3160 as the target, we can see that 3285 is exactly where it stopped and stabilized yesterday. So, it is normal for 3285 to rebound and consolidate. We can also see that the range of the 4-hour chart has been broken, so 3285 may fall directly and break through next. Then the next position to pay attention to is 3260-50. If it falls below this range, we can directly see the trend line support position of 3160-70 in this round of daily lines.
Trading is risky, and I hope my analysis can help traders reduce the risk of trading.

Gold 3315 gains and losses are the key
📌 Driving events
From the news perspective, data released by the U.S. Department of Commerce on Tuesday showed that U.S. durable goods orders in April plunged 6.3% month-on-month, with an expected value of -7.8% and a previous value revised from 9.20% to 7.50%. Volatile commercial aircraft orders plunged 51.5% in April after rising in March. Boeing said it received only eight aircraft orders in April, the lowest since May 2024, far lower than the 192 orders in March, the highest since 2023. Affected by the sharp drop in commercial aircraft orders, U.S. durable goods orders fell more than expected in April, with core capital goods orders (excluding aircraft and military hardware) falling 1.3%, the biggest drop since October last year. Under the influence of uncertainty in tariffs and tax policies, corporate investment willingness is weakening.
Through the data, it is not difficult to find that American companies have shown obvious caution in assessing the demand outlook and have shifted their focus to cost reduction, which directly reflects the impact of uncertainty brought about by Trump's trade policy. At the same time, the tax legislation being debated in Congress has also put companies on the sidelines, further suppressing the impulse to invest.
📊Comment Analysis
After the pullback on Monday this week, the decline accelerated on Tuesday, and the continuous decline came back, changing the strong upward trend of last week
💰Strategy Package
In terms of operation, in the short term, long and short operations can be carried out in the range of 3315-3297 US dollars, and the support position of 3285/80 should be paid attention to below; medium and long-term investors can buy on dips and take advantage of geopolitical risks and the trend of weak US dollars to gradually establish long positions.
⭐️ Note: Labaron hopes that traders can properly manage their funds
- Choose the number of lots that matches your funds
- Profit is 4-7% of the fund account
- Stop loss is 1-3% of the fund account

Will the gold market usher in a new trend?The Trump administration postponed the imposition of a 50% tariff on the European Union and extended the implementation date to July 9. This unexpected decision became the fuse for the violent market fluctuations. The European Union responded positively, and the US-EU trade negotiations ushered in a buffer period, but the global market has been affected, and the gold market has fallen into a dilemma of long and short interweaving.
On Tuesday, the overall gold price showed a downward trend. The price rose to $3,349.85 on the day, and the lowest price reached $3,285.21, closing at $3,300.4. After the opening of the US market, the price fluctuated upward in the short term, and the price ended in a big negative on the day. It is not suitable to be bearish at present before the price falls below the daily support.
From the daily level, the current daily level support is around $3,275, and the price may fluctuate upward above this position. At the same time, from the four-hour level, yesterday's price fell below the four-hour support of $3,320, and then continued to fall below the important support position of $3,300 on the daily line; and the short-term pressure is relatively large, so it is necessary to pay attention to the 3275-3320 range for the time being; this fluctuation range is also the middle area between the 5-day MA moving average and the 10MA moving average, and the price will continue after breaking through the range.
Operation strategy:
Scalping transactions are carried out in the fluctuation range of $3,290-3,315.
Quaid reminds all traders: You need to always pay attention to the direction of price trends, take profits in time, and avoid losses caused by unexpected events affecting price trends.

Gold retracement adjustment. Pay attention to the timing.Gold prices continued to fall today, hitting a low of $3,285, and are currently recovering briefly.
I think there is room for profit in the long strategy, but the hourly line is only a single positive rise. Overall, the probability of volatility correction is still high. Compared with the short-term resistance position of 3,320, the correction is still within the normal range.
From the 4-hour chart, the 60-day MA of $3,320 has a certain suppression position on the upward trend, followed by the 90-day MA of $3,285, which provides strong short-term support. Today's price drop also failed to break through this support position; so this week will continue to fluctuate sharply, and the large fluctuations up and down are to accumulate momentum for the next wave of rise. The basic operation strategy of the bulls has not changed, but just a halftime break.
Operation strategy:
Buy near $3,295, stop loss at $3,285, and the profit range is $3,320-3,330.

GOLD HUNTER MODE: XAUUSD H1 OUTLOOK + DAILY PLAN (May 26, 2025)Hey GoldFxMinds crew! 🌟 Hope you’re ready for a fresh week with the kind of sniper focus that turns confusion into clarity. Let’s break down Monday’s key levels and structure, so you trade with confidence, not hope.
Current price: ~3358
Bias: Neutral-to-Bullish, but caution is king as price sits at the top of a major H1 range.
🟤 PREMIUM ZONES – SELL INTEREST
🔻 3358–3368
H1 premium supply zone (last week’s local high + FVG unfilled)
Price hit premium, strong reactions likely
🦅 Eyes on — watch this area for potential sharp rejections or fakeout spikes!
🔻 3380–3395
M15/M30 extension, just above the current HH, in unmitigated OB + FVG
High risk for wicks and “bull trap” inducement
🦅 Aggressive sellers: this is your upper defense — don’t get faked!
🟢 DISCOUNT ZONES – BUY INTEREST
🟩 3325–3335
H1 demand/FVG + retest zone, previous breakout base
CHoCH confirmed, so first bounce possible here
🦅 Eyes on — look for bullish PA or quick rebounds, but wait for confirmation!
🟩 3295–3312
M15/M30 deep demand, oversold last week, zone of confluence with 50 EMA
If price nukes through first demand, this is the next major long trigger
🦅 This is where real buyers step in — be patient, don’t rush!
🟠 INTRADAY MID-ZONE
⚡ 3340–3348
Intraday equilibrium, lots of chop expected
Not ideal for entries; instead, use this zone to judge direction after NY open
🦅 Eyes on — let price tell the story, don’t force trades in the middle!
📊 STRUCTURE RECAP (H1 + M15/M30 Confluence)
Bullish structure intact above 3325–3330, but buyers need to defend each demand zone or we retrace lower.
Premium zones above 3358 are loaded with liquidity and can reverse fast. If price fakes out above 3368–3395 and rejects hard, expect a selloff to next demand.
If buyers defend 3325–3335 with a strong CHoCH/BOS, we can see a new impulse leg higher.
👋 Final Note: Watch, Don’t Chase!
This is a week for patient, sniper-style entries. Watch the 3358–3368 zone like a hawk — every wick, every fakeout counts!
Don’t get trapped in the chop; let price come to your key POIs and wait for confirmation.
If you found this plan helpful, smash that like, follow, and drop your questions or thoughts below! Your feedback fuels the next level of analysis.
Let’s crush the week, team! 🚀
— GoldFxMinds

Spot gold fell below the 3330 mark
📌 Driving events
The trend of gold prices this week needs to focus on the following three major risk events:
First, the confrontation between Israel and the Houthis intensified this week. On May 25, the Houthis used hypersonic missiles to attack Israel's Ben-Gurion International Airport for the first time, resulting in the interruption of airport operations. Israel subsequently launched a retaliatory air strike. Iran has made it clear that it "will not give in on uranium enrichment activities" and warned that it will take hundreds of alternatives if it is sanctioned
Second, although the Trump administration's threat to impose a 50% tariff on the European Union has been postponed to July 9, the market is still concerned about it. If the trade war escalates, it may lead to increased global economic uncertainty, which will in turn boost the safe-haven demand for gold. However, the repetition of tariff policies may also trigger changes in market risk preferences and have a two-way impact on gold prices.
Third, record-breaking air strikes in the Russian-Ukrainian conflict Russia launched the largest air strike since the war on Ukraine on May 26, launching 355 drones and 9 cruise missiles, and many parts of Ukraine suffered heavy losses. The attack has heightened market concerns about geopolitical risks, pushing gold prices higher in the short term. However, due to expectations of a prolonged conflict, market demand for safe-haven assets may gradually weaken. Technically, gold has performed strongly at support levels near $3,330.
📊Commentary Analysis
This week, gold prices will remain highly volatile under the intertwined influence of multiple risk events. Investors need to remain vigilant and flexibly adjust strategies to respond to market changes. Analyze the market, make plans, and manage risk.
💰Strategy Package
In terms of operations, investors are advised to pay close attention to the situation in the Middle East and the progress of Trump's tariff policy. In the short term, short selling can be carried out in the range of $3,330-3,305, with a target of around $3,290-3,280. Profits can be taken in batches, and a light position can be taken long after breaking through $3,310, with a target of $3,360-3,380. Profits can be taken in batches, and medium- and long-term investors can make layouts on dips, taking advantage of geopolitical risks and the trend of a weak dollar, and gradually establish long positions.
⭐️ Note: Labaron hopes that traders can properly manage their funds
- Choose a lot size that matches your funds
- Profit is 4-7% of the capital account
- Stop loss is 1-3% of the capital account
Analysis of gold trend at night and how to arrange it🗞News side:
1. Trump's view on Russia is not optimistic
2. Trump boasted in a post that his threat to impose tariffs on the EU worked
📈Technical aspects:
Gold does not seem to have a strong rebound. After touching 3305, the rebound momentum has weakened and it has been hovering between 3300-3290. Judging from the hourly chart, I think it is still in a state of correction. Then we may see another drop in the evening to accumulate momentum. This is why I chose to manually close the position near 3300 while waiting for the rebound just now. In the evening, bros can pay attention to the support line of 3280-3270 below to look for entry trading opportunities.
If you agree with this view, or have a better idea, please leave a message in the comment area. I look forward to hearing different voices.
FOREXCOM:XAUUSD FXOPEN:XAUUSD TVC:GOLD FX:XAUUSD OANDA:XAUUSD

Economic data released. Start of a new trend?The international gold market suffered a sharp sell-off, and the spot gold price once fell below the key psychological mark of $3,300/ounce, reaching a low of $3,392.59, as the US dollar index rebounded from a low of more than a month and concerns about the international trade situation cooled down.
The gold price is currently in a short-term recovery phase, and the downside risk is temporarily lifted. In the long run, the expansion of the US fiscal deficit may support the gold price; but in the short term, according to the latest data released by the United States, it is conducive to the long operation of gold, and the gold price will rise briefly.
Gold is strong in the short term, but traders need to take profits in time to avoid unexpected events that cause trend changes.
Overall, the short-term trend of gold prices is still subject to the US dollar, interest rate expectations and economic data, and the competition for the $3,300 mark will become the key.
The US economic data is within the expected range, and gold has a short upward trend.
Operation strategy:
Buy near $3290, stop loss at $3280, profit range at $3320-3330.

Am I the only one who still insists that gold will fall back?
💡Message Strategy
The dollar rebounded strongly, and gold fell under pressure
The primary driver of the gold price decline this time was the sudden strength of the dollar. After a brief correction, the US dollar index rebounded strongly, reaching a high of 99.40, with a daily increase of 0.4%, which is expected to be the best performance in the past two weeks. Since gold is denominated in US dollars, the appreciation of the US dollar directly weakened the attractiveness of gold to holders of other currencies, leading to an intensification of market selling.
US fiscal crisis + interest rate expectations, gold bulls suffered a double blow
In addition to the strengthening of the US dollar, the uncertainty of the US fiscal outlook also makes investors cautious. Although the market is worried that the US government debt may further expand (or increase by another $3.8 trillion in the next decade), it has not stimulated safe-haven buying of gold in the short term. On the contrary, the market is more concerned about the Fed's interest rate policy. The recent speeches of Fed officials tend to be hawkish. At present, traders generally bet that the Fed may restart interest rate cuts after September, but before that, gold may continue to be under pressure due to the high interest rate environment.
📊Technical aspects
1. The daily line lost the lifeline, and the lifeline was used as a downward pressure to find the lower track of the pattern
2. The four-hour pattern opened downward, indicating a wave of large-volume decline
3. The double lines of the hourly chart turned from support to resistance, suppressing further decline
4. In the large channel range, determine the upper track position of the channel, re-suppress the decline to find the lower track position of the channel, with a space range of about 200-300 US dollars
As shown in the figure: the middle track of the small blue channel line and the yellow large channel overlap the 3350 mark
The price fell below the middle track of the small blue channel. As time goes by, the price position reaches 3320-3330, which happens to be the pressure of the 3350 mark area and the position along the large channel line.
We are still looking at the action of holding high and breaking low, and the price will suppress the 3350 mark and fall below the lower track position of the channel at 3320 area.
💰 Strategy Package
Short Position:3320-3330,3340-3350

Gold hits around 3280, please go long in the short term
📌 Driving Events
Gold prices fell more than 0.50% on Monday as demand for safe-haven assets decreased after U.S. President Donald Trump announced a postponement of tariffs on the European Union. Trading activity remained subdued as the U.S. and UK markets were closed for public holidays. As of this writing, the gold/dollar exchange rate was around $3,294. Trump issued a statement on Sunday, postponing the date of the 50% tariff on EU goods to July 9, and market sentiment improved. As a result, gold prices came under pressure and fell after a sharp rise of 4.86% last week (the strongest weekly performance since early April)
📊Commentary Analysis
Focus on the support level of 3285/80. If this area is touched for the first time, go long
💰Strategy Package
🔥Selling area: 3345-3350 SL 3355
TP1: $3333
TP2: $3325
TP3: $3308
🔥Buying area: $3280-$3285 SL $3275
TP1: $3312
TP2: $3330
TP3: $3345
⭐️ Note: Labaron hopes that traders can properly manage their funds
- Choose a lot size that matches your funds
- Profit is 4-7% of the fund account
- Stop loss is 1-3% of the fund account
The mouth can't drive gold up
💡Message Strategy
US President Trump announced that the deadline for EU trade negotiations will be extended to July 9, and at the same time withdrew the threat of a 50% tariff on EU goods originally scheduled for June 1. This decision marks a phased easing of US-EU trade tensions, leading to a significant cooling of market risk aversion.
The statement of European Commission President Ursula von der Leyen revealed the key reason for the extension: "The EU needs more time to reach a comprehensive agreement that is beneficial to both sides." It is worth noting that just three days ago on May 23, Trump also threatened to impose high tariffs on EU cars and other goods in a tough manner, and even considered wielding the tariff stick against iPhones produced outside the United States. These remarks pushed the gold price up more than 2% in a single day.
📊Technical aspects
At present, the direction of gold is only a correction and decline. The market is not driven by words. The idea of gold trend that has been emphasized last week is to pull back to high altitudes. Facts have proved that gold cannot break through the high pressure position.
All the news is filled with the atmosphere of gold rising. The truth is often in the hands of a few people. We should correctly judge the changes in the market and not blindly follow them.
💰 Strategy Package
Short Position:3340-3350,3360-3370

Gold is about to clarify its trend direction
📊Technical aspects
1. The double-line position of the hourly chart is now in the 3290-3310 area. After the price fell below the double line, it used the lower track of the double line (purple trend line) as suppression and continued to fall and break the low
Then after breaking through the double line, it turned into support, especially after breaking through the repeatedly suppressed purple trend line position 3250, forming an accelerated sprint, and the space amplitude exceeded 100 US dollars
Then the purple trend line position, as the space switching line position, the subsequent space breakthrough will achieve at least 100 US dollars of space switching
2. The four-hour lifeline position is now at 3320. Due to the price surge After the high, there was no increase in volume and acceleration of the rise, but a continuous rise and fall. The four-hour pattern also began to close. The lifeline position is the dividing line. The double-line lower track and the pattern lower track are superimposed in the 3283 area. Special attention should be paid to it. Together with the 3270 position of the hourly chart, it will become the space switching point for the subsequent market.
3. Interestingly, the daily lifeline position is in the 3285 range, which is also the low point of the second half of last week and the final support point determined by the retracement. Multiple supports are superimposed here, which means that the subsequent price can fall below this point and realize the space switching.
💰 Strategy Package
Short Position:3340-3350
