GoldGold analysis: I expect a decline from these prices, or we may rise slightly to $3,500, then we will start a medium-term corrective wave for the overall chart, i.e. approximately two years of correction, and after that comes a five impulse wave. TVC:GOLD
Goldprice

Smells Like a Trend ReversalWeekly Recap – Gold Market
Monday, May 12, 2025
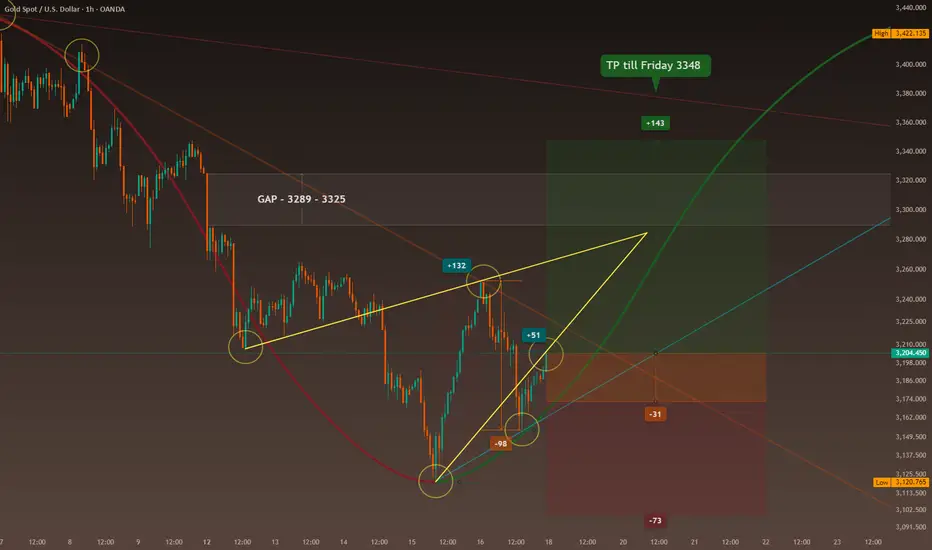
The week began with a sharp GAP during the Asian session (starting around 1:00 AM London / 8:00 PM New York on Sunday) :
Gold dropped abruptly by $60, from $3,325 to $3,266.
The catalyst was a temporary easing of trade tensions between the U.S. and China, following weekend negotiations that led to a 90-day tariff pause.
During the European session (starting at 8:00 AM London / 3:00 AM New York) , the downtrend continued, pushing the price further down to $3,207.
Tuesday–Wednesday, May 13–14
Between these two sessions, the price consolidated within a narrow range of $3,265 to $3,202 (63 $ range).
Despite better-than-expected U.S. inflation data, there was no significant breakout—the market remained indecisive.
Wednesday, May 14 – European Session
The price continued its descent, falling from $3,243 to $3,168—a $75 drop—indicating persistent downward pressure despite macroeconomic stability.
Thursday, May 15
The Asian session (1:00 AM London / 8:00 PM New York) began quietly, with a range between $3,168 and $3,192.
Then a sharp drop to $3,123 followed (down $71), triggered by new statements from President Trump, who announced potential trade deals with India, Japan, and South Korea.
In the European session (8:00 AM London / 3:00 AM New York) , a strong reversal occurred.
After failed peace negotiations between Russia and Ukraine in Istanbul, and due to growing geopolitical uncertainty plus a weakening dollar, gold surged by $132, from $3,120 to $3,252.
Friday, May 16
The Asian session opened slightly bearish, with gold dipping from $3,252 to $3,218.
However, bullish momentum returned during the European and U.S. sessions, continuing Thursday’s upward trend and adding $51 by day’s end.
📰 Geopolitical News Landscape
India / Pakistan
Since the Kashmir terror attack on May 9, 2025, tensions have escalated again.
Cross-border airstrikes and border closures have resumed. A fragile ceasefire, brokered by the U.S., is under pressure.
Disputes over water rights further strain relations.
➡️ Short-term outlook: high tension remains.
Gaza Conflict
On May 9, Israel launched Operation Gideon’s Chariot against Hamas, aiming to dismantle the group and rescue hostages.
Over 300 deaths have been reported. A leaked plan suggests Gaza will be divided into three heavily controlled zones.
The humanitarian situation is catastrophic (over 53,000 deaths since 2023).
Peace talks are underway in Doha, but the situation remains dire.
➡️ No relief in sight.
Russia / Ukraine
Direct talks were held in Istanbul for the first time in three years.
While a prisoner exchange (1,000 each side) took place, no substantial progress was achieved.
Russia demands Ukrainian troop withdrawals from contested areas—Kyiv refuses.
Simultaneously, Russian attacks intensified, including drone strikes on Sumy.
➡️ A ceasefire remains unlikely in the near term.
U.S.–China Trade War
A 90-day tariff pause was announced the weekend before May 12:
U.S. tariffs cut from 145% to 30%
Chinese tariffs reduced from 125% to 10%
Markets reacted positively at first—especially in retail and shipping sectors.
➡️ However, unresolved structural issues (e.g., tech transfers, export controls) keep tensions fragile.
No comprehensive deal is in sight.
⚖️ Trump vs. Powell
Tensions escalate between President Trump and Fed Chair Jerome Powell:
- Trump demands aggressive rate cuts
- Powell warns of inflation risks
- The Fed holds the interest rate steady at 4.25–4.5%
- A 10% staff reduction is planned at the Fed for “efficiency”
➡️ The growing political interference is increasing market instability.
📉 U.S. Inflation – April 2025
The official inflation rate dropped to 2.3%, the lowest since February 2021.
However, consumer inflation expectations soared to 7.3%, the highest since 1981.
The University of Michigan Consumer Sentiment Index fell to 50.8—a historic low.
➡️ A clear gap between perception and data is emerging.
📊 Technical Analysis – Short-Term
Since May 12, an open GAP exists between $3,289 and $3,325 (36 $ range)
A V-shaped reversal formed from the low on May 15 ($3,120) to the Friday close ($3,204)
Symmetrical triangle formation suggests a convergence around $3,284 (possible by Tuesday)
➡️ Current trading range: $3,172 to $3,285 (113 $ range)
💡 Outlook for Monday, May 19
Time-Zone-Based Expectations:
Asia session (starting 1:00 AM London / 8:00 PM New York Sunday):
👉 Potential retest of $3,154
Europe session (8:00 AM London / 3:00 AM New York):
👉 Bullish outlook toward $3,234
U.S. session (2:30 PM London / 9:30 AM New York):
👉 Possible continuation of bullish move — open-ended potential
📌 Trade Setup – Monday 8:00 AM (London) / 3:00 AM (New York)
If price is below $3,154 → I stay flat and wait for clear signals
If price is above $3,172 → I consider a long position, unless conflicting news emerges
🎯 Weekly Target
My goal for the week is $3,348, provided the U.S. Dollar Index (DXY) holds near the 100-point level.
🧠 Conclusion
I am increasingly convinced that news-driven trading delivers the best results—if one can properly interpret the signals.
🔢 Fibonacci Levels
1h chart: low $3,131 → high $3,500 (April 22)
Levels: 0.315, 0.382, 0.5
1h chart: low $3,131 → high $3,435 (May 6)
Levels: 0.315, 0.382, 0.5
1h chart: low $3,131 → high $3,252 (May 16)
Levels: 0.315, 0.382, 0.5
-------------------------------------------------------------------------
This is just my personal market idea and not financial advice! 📢 Trading gold and other financial instruments carries risks – only invest what you can afford to lose. Always do your own analysis, use solid risk management, and trade responsibly.
Good luck and safe trading! 🚀📊
Gold Rises on Tariff News, But Caution NeededGold prices surged after the U.S. President announced a 50% tariff on EU imports, triggering safe-haven demand. However, analysts warn that this may be a short-term FOMO reaction rather than the start of a sustainable rally.
📰 Key Drivers:
- The tariff announcement spooked markets, boosting gold temporarily.
- The U.S. dollar dipped slightly, but bond yields remain high – a bearish sign for gold.
- No immediate EU retaliation weakens the long-term bullish case.
🔍 Technical Outlook:
- Resistance: $3350 – being tested but not yet clearly broken.
- Support: $3310 – may be revisited if upward momentum fades.
- EMA 09: Price remains above, but fading volume and long upper wick suggest weakening strength.
- Price Action: Sharp move looks emotion-driven; correction likely if no follow-up catalyst appears.
📉 Short-Term View:
Despite the surge, gold’s rise may be temporary. If no escalation occurs, a short-term pullback is likely as markets reassess the impact.
💡 Suggested Trade Setup (Short-Term Bearish):
SELL XAU/USD at 3345 – 3350
🎯 TP: 3330
❌ SL: 3355
BUY XAU/USD at 3310 – 3312
🎯 TP: 3325 – 3327
❌ SL: 3305

Tariffs are on the rise again, gold is jumping.Information summary:
The Trump administration has once again launched a tariff war, threatening to impose a 50% tariff on the EU from June 1, and said that the negotiations between the United States and the EU have made no progress. Because the timing of this threat is quite delicate. Just earlier this week, the EU just submitted a new framework proposal to the US to restart bilateral trade negotiations. This directly led to a jump in gold.
Faced with the tough stance of the United States, the EU is not without countermeasures. It is reported that the EU has formulated a contingency plan. If the negotiations fail, it will impose additional tariffs on US exports worth 95 billion euros in response to Trump's "reciprocal" taxation and 25% tariffs on automobiles and some parts, which will inevitably cause further impact on the market.
Market analysis:
Today, the European session was under pressure at 3335 and the correction method was adopted. This correction method can better show that the price is strong, and the bulls are not willing to give the bears too many opportunities. Therefore, the layout should be aggressive. The stronger the market, the less likely it will fall back. At the same time, the correction of the strong market will definitely not break the low for the second time.
Operation strategy:
Short near 3375, stop loss at 3380, and target 3350-3340.
The price fell back to around 3335, and we will adopt a long strategy based on the downward trend.

Gold can be shorted near 3365-3370 in the US market
📌 Driving Events
Gold prices fell about 0.48% on Thursday, retreating from a two-week high of $3,345 and falling below the key $3,300 level. Although U.S. Treasury yields retreated from intraday highs, the renewed strength of the U.S. dollar still pushed gold prices down. The pressure on gold intensified after the U.S. House of Representatives passed President Trump's budget proposal, which is now submitted to the Senate for final approval. At the time of writing, XAU/USD was trading at $3,289, down 0.83% on the day. Although the market sentiment has rebounded slightly, it remains fragile after Moody's recently downgraded the U.S. sovereign debt rating. The fiscal package approved by the House of Representatives is expected to increase the national debt ceiling by a staggering $4 trillion, which has exacerbated concerns about long-term fiscal sustainability.
📊Comment Analysis
Gold is now facing strong resistance and buying power is weakening.
💰Strategy Package
🔥Sell Gold Zone: 3365- 3370 SL 3375
TP1: $3350
TP2: $3335
TP3: $3320
⭐️ Note: Labaron hopes that traders can properly manage their funds
- Choose the number of lots that matches your funds
- Profit is 4-7% of the fund account
- Stop loss is 1-3% of the fund account

Daily Sniper Plan for Friday, May 23👋 Hey Gold Snipers, Ready to Slice Through the Noise?
The market has been throwing shadows and traps all day — but structure doesn’t lie. As we head into May 23, we’ve mapped out the real levels that matter. No hype. Just clean logic. You want sniper entries? Here's where we hunt 🧠🎯
🔭 Bias for May 23: Bearish-to-Neutral
Short-term bias is bearish as long as 3298 holds as resistance
If bulls reclaim 3300+ with momentum, we shift into bullish continuation bias toward 3332–3345
Until then, we’re playing inside structure → fading premium, buying deep discount only on confirmation
🧭 Market Update
Gold spent most of Thursday chopping inside indecision, dancing between reclaimed zones and rejected premiums. But smart money leaves a trail — and tonight, structure gave us the blueprint:
CHoCH confirmed from 3345 → now forming a lower high structure
EMA 5/21 still locked bearish on M15–H1, while price holds under the OB flip zone
RSI is showing divergence near key demand
FVGs still exposed both above and below = imbalance-driven reactions likely
Momentum is building... but direction depends on how we react to these zones👇
🧩 Plan for Friday, May 23 – Built Around Key Zones
🔺 Sell Zone: 3314–3320
💥 Premium OB reaction area
→ If price taps and rejects, this is where shorts load
→ EMA 100 and previous LH sit here — high probability fade level
→ Watch for M5 CHoCH or bearish engulfing to trigger sniper logic
⚖️ Flip Zone: 3292–3298
🧠 Former demand turned resistance — now the pivot of truth
→ If price rejects here again, expect quick drop to 3260s
→ BUT... if bulls reclaim and hold above 3300, this flips the script
→ In that case, structure opens doors to:
🟡3314
🟡3332
Even 3345+ (liquidity sweep zone)
We adapt with structure — not emotions.
🟩 Buy Zone #1: 3263–3273
✅ CHoCH support base + FVG + RSI bounce
→ This is sniper ground if price returns here cleanly
→ Look for EMA 5/21 bull lock + M15 BOS
→ Reactive zone, not for the impulsive — confirmation or nothing
🟩 Buy Zone #2: 3242–3250
🔑 Deep liquidity sweep + fib 78–88.6%
→ If price runs the 3260 zone and traps liquidity, this is the reload zone
→ Needs strong wick + RSI divergence + internal BOS to act
❌ Breakdown/Invalidation Zone: 3222–3230
🚨 Below here = no more sniper longs
→ Structure flips HTF bearish
→ If it breaks with volume and OB rejection on retest = prepare for deeper slide
🧠 Final Thoughts:
This isn’t about signals. It’s about structure.
Gold moves best when we wait — not when we guess. We mapped every key zone. Now we wait for confirmation, follow the logic, and let the amateurs get baited in between.
🎯 Bias stays bearish under 3298. Above 3300, we start building toward higher liquidity zones — but confirmation is king.
💬 Let me know which zone you're watching.
🔁 Share this plan if it helped clarify your direction.
🟡 Like + Follow GoldFxMinds for sniper-level structure — every session.

Tariff threat. Gold prices rose sharply?Information summary:
Gold prices climbed in the short term during trading after Trump threatened to impose new tariffs on the European Union, as this increased market uncertainty and increased demand for safe-haven assets. Trump said in a post on Truth Social that he suggested a 50% tariff on the European Union starting June 1, and complained that trade negotiations were stalled.
After the news came out, gold prices rose rapidly, breaking the $3,345 resistance level, but did not stabilize above the $3,365 resistance level I predicted in the morning; it reached a high of around $3,360 and then fell back slightly.
I think the short-term gains have been too large, and if there is a rapid adjustment, the amplitude will also be large.
Technical analysis:
From the 4-hour chart, gold prices continue to trade above all moving averages, and the 20-day moving average has broken through the 100-day and 200-day period moving averages. At present, indicators show that the upward momentum is not very strong.
If the price breaks through the 3365 resistance level strongly, it may hit the cycle high of around 3380.
Because of the weekend, if the resistance level fails to be broken strongly, the price may adjust in the range of 3360-3330 US dollars, and a new trend needs to be found.

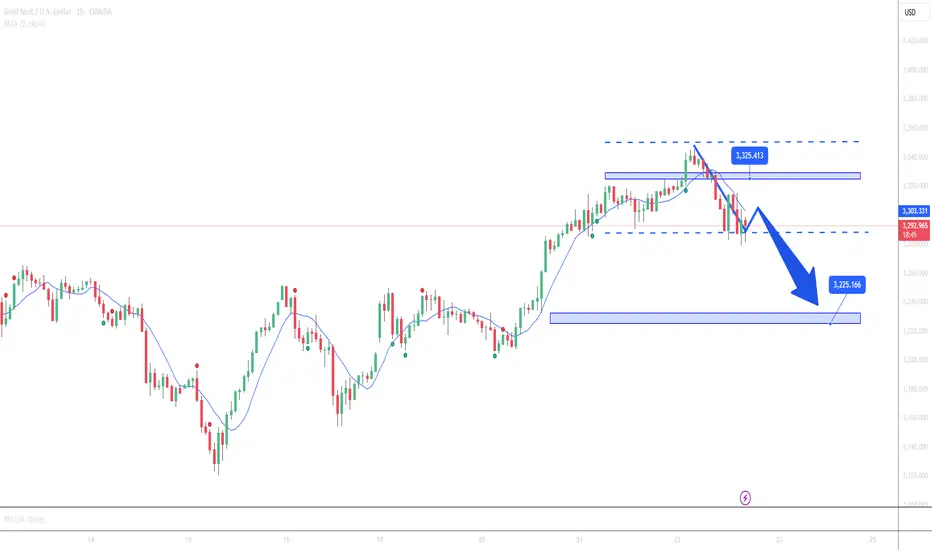
XAU/USD: It's time for Fall? (READ THE CAPTION)By analyzing the gold chart on the 2-hour timeframe, we can see that after our last analysis, the price continued to rise as expected and reached $3344. As I anticipated last week, the gap between $3311 and $3322 has finally been filled! This analysis has delivered a return of over 1090 pips so far. After hitting the $3340 zone, the price faced strong selling pressure and is currently trading around $3294. If gold manages to hold below $3284, we could expect further downside. This analysis will be updated!
Please support me with your likes and comments to motivate me to share more analysis with you and share your opinion about the possible trend of this chart with me !
Best Regards , Arman Shaban

3330 is in stalemate 3335 is the key to long and short positions🗞News side:
1. PMI and initial jobless claims data
2. Geopolitical situation
3. Progress of the G7 meeting
📈Technical aspects:
Currently, the gold price is caught in a fierce battle between bulls and bears at the 3330 level. From a technical point of view, gold is still in the weekly level adjustment and no clear unilateral trend has emerged. Recently, there has been frequent changes in long and short positions, and the rise and fall of prices depends on the impact of news on the market. Even if gold experiences a correction at present, it is likely to be only a small range. Therefore, in the short term, attention should be paid to the resistance line of 3330-3335. If it breaks through, it is expected to look towards yesterday's high of 3345. If it encounters resistance and pressure at 3330-3335, it may retreat to 3310-3300 in the short term for correction. The upper strong pressure is still at 3350-3360, and the lower support of 3300-3290 is still strong. There is no good entry trading opportunity at present, so brothers should wait patiently.
If you agree with this view, or have a better idea, please leave a message in the comment area. I look forward to hearing different voices.
FOREXCOM:XAUUSD FXOPEN:XAUUSD TVC:GOLD FX:XAUUSD OANDA:XAUUSD

Will gold continue to rise? Be alert on Friday.On Thursday, the US dollar rebounded after three consecutive days of decline and once returned to above the 100 mark, but failed to stand firm here. It is still maintaining at the 100 mark for consolidation. Due to the strengthening of the US dollar, gold began to retreat after hitting a high of 3345 yesterday, and once lost the 3300 US dollar mark, with the lowest reaching around 3280.
First of all, from the current 4-hour chart of gold:
In the Asian session, the lowest gold touched around 3290, and then rebounded. As of now, the highest reached around 3330. At present, 3310 should be a relatively important support position for gold. If it can be maintained above 3310, then gold may continue to rise. It can also be seen from the figure that once it continues to rise, 3345 is likely to be refreshed, and the highest should be around 3360.
From the 1-hour chart:
3280-3330 range, around 3310 is exactly the current 618 position. Therefore, if gold cannot pull back below 3310 again, it is highly likely that it will continue to reach a new high.
Secondly, as time goes by, the early low of 3290 can no longer be touched, and the current support is already near 3300. That is to say, it cannot fall below 3300 again. Once it falls below 3300, gold will refresh the low of 3280 and continue to fall.
Operation strategy:
If it can retreat to 3310 and stabilize, then we will go long at 3310.
On the contrary, if it falls below 3310, then we will focus on 3300. Once it falls below 3300, the trend will go down.
Then you can short at 3290-3300, and the profit range is around the early intensive trading area of 3260-3250.

Gold May Continue Rising – Signs of Short-Term Recovery EmergingGold is showing a strong recovery from the recent low of $3280/oz and has now surpassed the key resistance at $3325, currently trading around $3330. The upward momentum remains intact as gold continues to trade above the EMA 09, indicating that bulls are still in control in the short term.
There is a possibility that gold could retrace slightly to the $3310 zone to gather momentum before pushing higher toward the next resistance at $3350.
Key factors supporting the short-term bullish outlook:
• The US dollar has temporarily weakened after economic data came in less impressive, giving gold room to rise.
• Gold demand has seen a slight rebound from ETFs after recent sell-offs.
• Geopolitical tensions in the Middle East and cautious sentiment in equity markets continue to support gold as a safe-haven asset.
🔍 Technical Analysis:
• Price remains above the EMA 09, indicating the bullish trend is still intact.
• Nearest support: $3310 – could be an attractive entry point for buyers.
• Next resistance: $3350 – serves as the immediate upside target.
• Bullish candlestick patterns are forming with no strong reversal signals so far.
💡 Suggested Trade Strategy (Short-Term Bias: Bullish):
• BUY XAU/USD at 3310 – 3312
🎯 TP: 3325 – 3327
❌ SL: 3307
• BUY XAU/USD at 3320 – 3322
🎯 TP: 3335 – 3337
❌ SL: 3317

How will the price of gold go? Prospect analysis is here.In the Asian session, spot gold rebounded modestly after a sharp drop in the previous trading day, and the price of gold is currently around $3,330.
Gold prices lost some upside momentum on Thursday, but downside remains limited. Gold prices suffered a correction on Thursday, ending the previous three consecutive trading days of gains, mainly due to the rebound of the US dollar and traders taking profits after the price of gold hit a two-week high. Spot gold closed down $20.14, or 0.61%, at $3,294.81 per ounce on Thursday.
We see gold encountering some profit-taking selling pressure after its recent gains, while a stronger U.S. dollar index is another bearish factor. However, affected by the turmoil in the global bond market, the gold market continues to be bullish and the decline is limited.
Short-term technical analysis:
Looking at the gold daily chart, the high point of gold prices on Thursday moved up from the previous trading day, while the low point moved down. Buyers continue to defend on the downside near the flat SMA 20-day, which provides support near $3,288.00. The 100-day and 200-day moving averages continue to move upwards at levels well below current gold prices, consistent with the dominant bullish trend. Finally, technical indicators have lost bullish power but are flat within positive levels, limiting the possibility of further declines.
Looking at the 4-hour chart, there is no sign that gold will fall further. Gold prices continue to trade above all its moving averages, with the 20-period SMA crossing above the directionless 100-period SMA and 200-period SMA. Meanwhile, technical indicators are moving lower, but with limited downside power, they remain above their midlines.
Short-term focus on important support and resistance levels:
Support: $3,290; $3,270; $3,250.
Resistance: $3,325; $3,345; $3,360.
I hope my analysis can help you make profits easily in the trading market.

PMI Boosts USD but Caution Lingers Ahead of Fed DecisionOANDA:XAUUSD TVC:GOLD The recent release of stronger-than-expected S&P Global PMIs in the U.S. has offered short-term support to the dollar, pressuring gold from intraday highs. Manufacturing and services PMIs both improved to 52.3 in May, fueling speculation that the U.S. economy may still be resilient despite persistent concerns over Trump's proposed tax reforms and renewed tariffs.
Still, market sentiment remains cautious. While Wall Street recovered slightly, it continues to post weekly losses. Investors are balancing upbeat data with longer-term risks — including a potential economic slowdown triggered by aggressive fiscal tightening and global demand headwinds.
With the FOMC meeting approaching (June 17–18), gold traders are likely to remain reactive to macroeconomic signals. Any dovish shift or mention of a potential rate cut timeline could reignite demand for non-yielding assets like gold. Until then, price action around the $3,289 support and the Quasimodo pattern will be crucial for short-term direction.
Resistance : $3,319 , $3,343
Support : $3,289 , $3,239

Gold starts to go down? Double opportunities.Analysis of Asian market trend:
To summarize the short-term trend, "continue to step back and continue to seek key support". Gold rose and then fell in the Asian market yesterday, and the final rebound stopped at 3350. The trend is in line with our short-term bearish expectations. As for the market falling and breaking, it is a normal market. This means that the adjustment needs to continue. Today, the main focus below is still the support level of 3280. The early decline has approached this point, but it has not been completely touched; if this position is not broken, the bullish rebound is still there and it will rise at any time.
Operation adjustment, mainly low and high, supplemented by high and low, look at the shock sideways, wait for the market to break through the range and gradually look down; then the two main points of short-term focus, if the downward trend does not break 3280, then the rebound will first look at the high point of 3320. Strong breakthrough and stabilization at this position, if it does not break through yesterday's high point, it will continue to be mainly shocking; at the same time, unlike the previous consecutive rises in the past few weeks, this week's trend is slightly weak, and it is almost the weekend, so let's look at the amplitude of the range trend first.
Operation strategy:
Short around 3320, stop loss at 3328, target at 3290;
Long around 3280, stop loss at 3270, target at 3315.
Short-term trading is temporarily operated in this range, and a new layout will be made if it breaks.

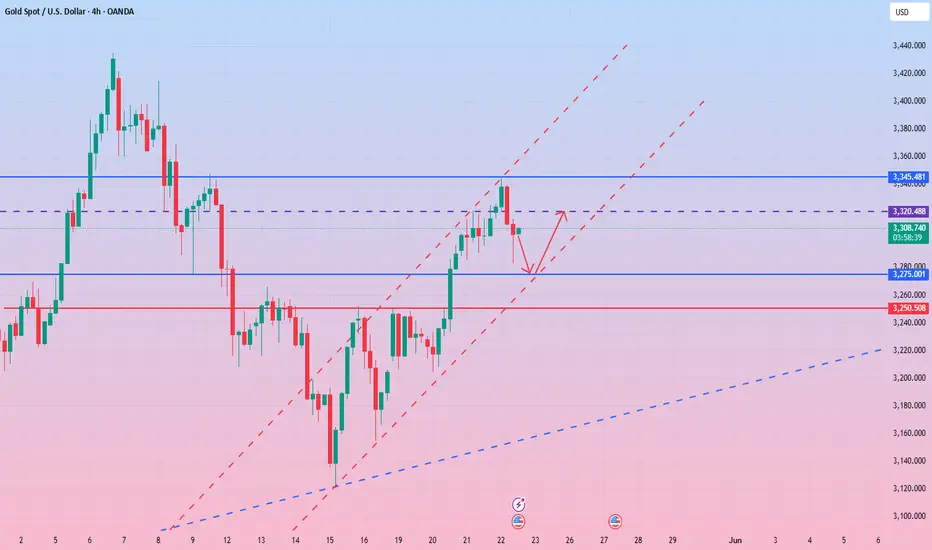
Gold Price Analysis May 22The recent consecutive bullish candles have brought gold close to ATH. With the current candlestick force, gold is still not strong enough to close above 3400 today and will still encounter some selling force creating a new half wave that can push it back above 3400
The immediate barrier zone is 3344 that the Asian session needs to pay attention to. If it does not break through at the end of the session, it is possible to SELL around this area, the target will not be long because the buying force is still strong according to the main trend. In case of breaking 3344, 3360 is the next price reaction zone for the European and American sessions. The resistance at 3395 will play a key role in preventing gold from a strong slide.
On the other hand, any retest is considered a good opportunity to buy. 3322 and 3290 are the targets of SELL orders and are also buying opportunities when there is confirmation of buying force around this area.

Dangers and opportunities for gold? Trend change?In early Asian trading, spot gold fluctuated in a narrow range and is currently trading around $3,300. After rising in the first three trading days of this week, gold prices briefly hit a two-week high of $3,345 in Asian trading on Thursday, then fell sharply and finally closed around $3,294. This rapid change hides the fierce struggle between the strengthening of the US dollar, the turmoil of US bonds and geopolitical changes.
The rebound of the US dollar is the biggest pressure for the rise in gold prices.
Another major pressure on the gold market comes from the sharp fluctuations in US bond yields. The 30-year US bond yield hit a 19-month high, reflecting the market's deep concerns about the $3.8 trillion in new debt. The cold auction of $16 billion in 20-year US bonds on Wednesday further confirmed the judgment that the demand for sovereign bonds is undergoing structural changes.
The current gold market is being pulled by multiple forces. In the short term, the technical rebound of the US dollar and the selling of US bonds do pose pressure. But in-depth analysis shows that the pressure of currency depreciation brought by the $3.8 trillion fiscal expansion, the safe-haven demand caused by the damaged credit of US debt, and the risk of stagflation are three factors that are building long-term support for gold.
I think the shadow of global bond market turmoil will become a potential factor for the bullish gold market.
There are relatively few economic data during Asian trading hours. The focus should be on the annualized total number of new home sales in the United States in April after seasonal adjustment and the speeches of Federal Reserve officials, as well as news related to the geopolitical situation and the international trade situation.
I will also analyze the latest international news and its impact on gold prices for you as soon as possible.
Short-term operation strategy:
First rise: short near 3345, stop loss 3255, profit range 3280-3270.
First fall: long near 3275, stop loss 3265, profit range 3300-3310.

Gold bulls push prices to around 3355
📌 Driving events
Gold prices rose more than 0.50% and held above the $3,300 mark, driven by renewed safe-haven demand and rising geopolitical tensions in the Middle East. As of writing, gold/USD is trading around $3,317, rebounding from an intraday low of $3,285.
Market sentiment remains fragile, with US stocks falling into negative territory and US Treasury yields slightly higher. All eyes are on the upcoming vote on President Trump's tax reform plan. According to estimates by the Congressional Budget Office (CBO), the plan could lead to an approximately $3.8 trillion expansion of the US national debt. Uncertainty about the fiscal outlook continues to stimulate demand for gold as a defensive asset.
📊Comment Analysis
Gold price recovery is good, pay attention to the 3358 price area, adjust downward, and continue to accumulate funds around 3300
💰Strategy Package
🔥Sell gold area: 3358-3360 SL 3365
TP1: $3350
TP2: $3337
TP3: $3322
🔥Buy gold area: $3284-$3276 SL $3270
TP1: $3300
TP2: $3320
TP3: $3340
⭐️ Note: Labaron hopes that traders can properly manage their funds
- Choose the number of lots that matches your funds
- Profit is 4-7% of the fund account
- Stop loss is 1-3% of the fund account

Gold Remains Under Pressure – Further Decline Likely Not OverGold has touched the key support level at $3290/oz as expected and is now hovering around $3295, indicating that the downward momentum remains intact. Recent U.S. economic data has been positive for the U.S. dollar, adding to short-term pressure on gold.
➡️ The strong data reinforces the Fed’s hawkish stance , increasing expectations that interest rates will remain elevated for longer. As a result, both the U.S. dollar and Treasury yields have risen, weighing heavily on gold prices.
🔍 Technical Analysis:
• Price is tracking below the EMA 09 , suggesting the downtrend is still in play.
• The $3290 support has been tested; a break below this level could open the door to the next target at $3225.
• A consistent bearish candlestick pattern shows no clear signs of reversal.
• Lack of strong buying interest at current levels suggests further downside is likely.
💡 Suggested Trade Strategy (Short-Term Bias: Bearish):
• SELL XAU/USD in the $3294 – $3297 zone
🎯 TP1: $3275
🎯 TP2: $3225
❌ SL: $3305
• BUY XAU/USD only if price pulls back to the $3225 zone with clear support signals
🎯 TP: $3260 – $3270
❌ SL: $3210
Seize the opportunity in the gold marketGold fell after reaching a high point during the day, reaching a high of 3345 before going out of the big drop space, and the evening star appeared in the 4H cycle. Combined with the correction of the top divergence of the indicator, the short-term will enter the adjustment stage. Pay attention to the middle track support around 3280-75 in the future market. If it does not break, you can consider going long. Pay attention to the upper pressure of 3320 and 3335. Keep the idea of shock in operation!
Operation suggestion: Go long on gold around 3280-3275, and look at 3300 and 3320. Go short if the rebound pressure of 3320 is not broken.
Gold is going down? Is the trend going to change?The previous rally continued in the early Asian session on Thursday, reaching a high of around 3345.
However, it then began to fall rapidly. So far, gold has fallen below the 3300 mark again, with the lowest point reaching around 3280.
From the daily chart:
Gold is currently at 3280, which is the moving average support position. If it falls below 3280, the market will test 3250-3260 below. This position is not only the current daily moving average support position, but also an important barrier position in the past. This is an important suppression position for the upward trend of gold this time.
Similarly, if it wants to fall, 3250-60 is also an important support position.
Secondly, let's look at the 4-hour chart:
If it really falls below the bottom of the range at 3280, then as I said above, it will test 3250-3260. However, if it fails to break the support near 3280, it is very likely to maintain consolidation in the 4-hour range.
And from the range point of view, the fluctuation range is very large. It is basically maintained in the range of 3320-3280, which is about 40 US dollars. I suggest that we should still pay attention to whether the support here at 3280 can stabilize. If it can stabilize at this position, and there is a bottom signal at 3280, then you can go long near 3280. Sell high and buy low according to the range of 3280-3320.
On the contrary, if it falls below the support of 3280, don’t go long. It is very likely to directly test the support position of 3250-60 later.

Gold Shows Clear Signs of Weakness – Short-Term Downtrend LikelyGold is showing clear signs of weakness after failing to break the strong resistance level at $3350/oz. Bullish momentum has faded as gold broke below the $3325 support and continued its decline, now trading around $3310. Current technical signals indicate that the downtrend remains dominant, and there is a high probability that gold will continue correcting toward the $3290 support level, possibly even testing the $3225 area if the bearish pressure persists.
📰 Key Economic Data Scheduled for Today (U.S.):
• Unemployment Claims
• Flash Manufacturing PMI
• Flash Services PMI
These reports could trigger strong short-term volatility, especially if the data is positive and strengthens expectations that the Fed will maintain a tight monetary policy. This scenario could put further downward pressure on gold, as the USD strengthens and Treasury yields rise.
⚠️ Recommendation: Investors are advised to avoid trading during news releases to minimize risk from high volatility.
🔍 Short-Term Technical Analysis:
• Key Resistance: $3350 – remains unbroken, confirming weakening buying power.
• Nearest Support: $3290 – crucial level to monitor if the downtrend continues.
• Deeper Support: $3225 – could be tested if no strong rebound occurs.
• Short-Term EMA: Price is currently below the EMA 09, signaling further downside momentum.
• Bearish Candlestick Pattern: Series of long red candles reinforce the ongoing bearish trend.
💡 Short-Term Trade Scenarios:
SELL XAU/USD Zone : 3325$ - 3328
💰 TP : 3310 - 3313
🚨 SL $3335
BUY XAU/USD Zone: 3288$ - 3290$
💰 TP : 3313 – 3315
🚨 SL $3283

GOLD UPDATES – XAUUSD -MAY 22nd ahead of Unemployment claims&PMIGold is walking on a tightrope today — and below it is a pit full of retail stops. With a full lineup of high-impact USD news and price tapping into key supply zones, you already know:
The first move is bait. The second pays the sniper.
🧨 FUNDAMENTAL MINEFIELD – MAY 22
Today is packed with market-moving data — every piece adds fuel to the fire:
🕒 15:30 – Unemployment Claims
230K forecast vs. 229K previous
👀 A miss = USD weakness, gold spike
🧨 A beat = potential pressure on gold
🛠️ 16:45 – Flash PMIs (Manufacturing & Services)
Manufacturing: 49.9 → contraction
Services: 51.0 → weak expansion
💥 This is the real bias decider. Two beats = gold down. Two misses = gold up. One of each = chop zone.
🌍 G7 Meetings – All Day
Geopolitical tension brewing? That’s the stealth trigger gold always loves.
🧠 MACRO STRUCTURE OUTLOOK
• HTF still shows price moving inside key supply
• D1/H4 momentum looks bullish but stretched
• No clean HTF BOS, and no new structural dominance post-May 21 sell setup
⚠️ Translation: Rally looks strong but smells like trap. NY session will expose the truth.
🗺 GOLDMINDSFX SNIPER ZONE MAP ✅
🔴 SUPPLY / SHORT BIAS ZONES
• 3355–3364
→ H1/H4 supply + internal sweep zone
→ Primary area for fakeouts/premium fades
• 3385–3395
→ Old POI + unmitigated H4 OB
→ Algo zone for stop-hunt before dump
• 3418–3427
→ Daily imbalance extension
→ Low-touch, high-R:R trap — news only
🟢 DEMAND / LONG BIAS ZONES
• 3315–3308
→ H1 OB + micro break zone
→ Must hold for bullish continuation
• 3298–3288
→ Post-CHoCH FVG + OB = sniper buy zone
→ High-prob bounce zone
• 3270–3260
→ H4 breaker + old demand
→ Key flip zone — if lost, bears take control
• 3236–3228
→ D1 OB + FVG tail
→ Only valid in a meltdown. Deep liquidity final boss.
🎯 CONTROL ZONE: 3315–3308
→ Holds = bulls stay in the game
→ Breaks = we open the door to 3288–3260 slides
⚔️ PLAYBOOK
✅ BULLISH SCENARIO
News comes in weak → price sweeps 3308 or 3288 → reclaims on M15
→ Enter on confirmation
❌ BEARISH SCENARIO
USD data strong → gold nukes 3308 → flips it to resistance
→ Short confirmed rejection at 3355 or 3385
⚠️ TRAP SCENARIO
Expect first move post-news to be fake. Spike above 3355 or below 3308 is bait.
→ Real sniper entry = the second move, after reclaim or rejection with structure
🎯 FINAL WORD
No confirmation = no entry.
The market doesn’t care how you feel. It only respects execution.
“Structure is the setup. News is the trap. Your job is to wait.”
If this helps you stay clear and deadly — drop a 🚀 and follow for sniper-grade clarity daily.
📌 Important Notice!!!
The above analysis is for educational purposes only and does not constitute financial advice. Always compare with your plan and wait for confirmation before taking action.

Gold consolidates. Changing trend?Asian market: Gold continues to rise, and the current highest is near the high of $3345.
The next trend is very critical, let's look at it from the 4-hour chart.
It can be seen that there is absolute suppression at $3340. It is just near the top of the trend line, and it is difficult to break through directly.
Therefore, it will definitely be maintained near $3340 for consolidation in the future.
In addition, from the 1-hour chart:
I think the most critical bottom support position today is $3315. As long as gold is above this point, it will be in a consolidation and rise, or it will be maintained at $3315-3340 for consolidation. The position above that needs to be paid attention to is near $3350. Once it breaks through $3340 and stabilizes above $3350, gold may rise further to test $3360-3370.
However, if gold falls below $3315, it may trigger a sharp decline.
Operation strategy:
I suggest you focus on the fluctuation range of 3315-3340 USD and buy low and sell high.
However, it should be noted that once the upper or lower range is broken, you should be alert to the possible trend change.
