Is the gold price far from 3,400?Information summary:
The trade war is a continuous war, and it has just begun. During Trump's four years in office, trade conflicts will continue to occur. Trade conflicts are means, not ends. The goal of the United States is to transfuse blood to its own economy through trade negotiations.
In addition, US inflation fell to a historic low of 2.3% in April. The Federal Reserve has not cut interest rates on the grounds that inflation will rebound. The Federal Reserve can't hold on for long. Cutting interest rates is the only antidote to boost the economy, and it is also a special medicine.
Next, once the Federal Reserve releases the wind of interest rate cuts, the market's risk aversion will be ignited again. In June, 6 trillion US bonds will mature. Regardless of the result this time, market sentiment will be worried, which is the key to driving price fluctuations.
Market analysis:
The 1-hour gold price broke through yesterday's high of $3,320. The previous pressure formed a new top-bottom conversion position, and the strong market was only a small correction in the middle. There is no need to worry about whether it will peak, but there must be a standard for judging the peak; this standard is: breaking the support position before the last decline, and the second rebound does not set a new high.
Operation strategy:
Go long when the price falls back to around $3,330, stop loss at $3,320, and profit range at $3,365-3,380.
Goldprice

Chart Analysis (45-Minute Timeframe):1. Breakout Confirmation:
The chart shows a bullish breakout from a rising wedge or channel structure, marked with two red trend lines.
Price has closed above the Ichimoku cloud, confirming bullish momentum.
2. Key Resistance Levels:
First resistance: $3,324.89 (being tested currently).
Major target/resistance zone: $3,368.18 (highlighted by the upper red line and arrow).
This zone aligns with a previous strong supply area visible on the left of the chart.
3. Support Levels:
Immediate support at the breakout zone around $3,310.
Additional supports lie at:
$3,308.23
$3,305.13
$3,266.45 (bottom of the recent move and key invalidation zone).
4. Volume Profile:
Increased bullish volume is supporting the breakout.
No significant bearish volume spikes yet, indicating momentum is still in favor of buyers.
5. Ichimoku Cloud Insight:
Bullish signals:
Price is above the cloud.
Lagging span (Chikou) is above price.
Cloud ahead is green, indicating potential continued bullish trend.
6. Expected Move:
If price holds above $3,310, we could see a continuation toward the target zone at $3,368.
However, failure to hold above $3,310–$3,305 could lead to a pullback toward the base of the channel or cloud support.
Summary:
Gold is in a bullish breakout phase. A sustained move above $3,324 and holding support at $3,310 increases the likelihood of a move toward the $3,368 resistance zone. Watch volume and lower trend support for any signs of a reversal or failed breakout.

How to arrange after gold falls into consolidation🗞News side:
1. US officials said Trump's statement was related to the Golden Dome Project, which may affect the flow of funds
2. The tension in the Middle East has intensified, and the risk aversion sentiment has increased, which is good for gold
3. Although the withdrawal of Indian and Pakistani troops has eased the regional situation, geopolitical risks still exist
4. Trump mentioned the tax bill, which affected economic expectations and affected gold investment sentiment to a certain extent.
📈Technical aspects:
At present, gold is in consolidation, and the upward trend is slightly stagnant. From the hourly chart, there are signs of downward correction after the upward test of 3320. In the short term, the upper 3320 line has a certain suppression, so gold may test the support again and then rise after stabilizing. Then the first support below is the 3292 line, followed by the 3285 line. If it falls below, it may test the two key support points of 3273 and 3265. The current trend is not clear. In the future trading, we will wait patiently for the gold price to stabilize before entering the market.
If you agree with this view, or have a better idea, please leave a message in the comment area. I look forward to hearing different voices.
OANDA:XAUUSD FX:XAUUSD TVC:GOLD FXOPEN:XAUUSD FOREXCOM:XAUUSD

Will gold continue to rise as risk aversion heats up?
📌 Gold driving factors
At present, the current market sentiment has turned cautious, driving safe-haven funds into gold. Previously, Moody's downgraded the US sovereign credit rating, and President Trump's promotion of a large-scale tax cut bill is expected to be passed by Congress, further strengthening the theme of "selling the United States" and exerting continuous pressure on the US dollar.
In addition, the resurgence of disputes between the United States and China on the chip issue, and the news that the Group of Seven is considering imposing tariffs on cheap Chinese products, have exacerbated the uncertainty of the global economic outlook, further suppressing the US dollar, while supporting gold, a traditional safe-haven asset, to an eight-day high. Gold prices also benefited from the heating up of geopolitical tensions. CNN reported that several US officials revealed that Israel is preparing to launch a strike on Iran's nuclear facilities.
📊Commentary Analysis
The current market is still running in a range of shocks. Therefore, the US market is still trading repeatedly around the range for the time being. For the time being, the small range will temporarily look at the 3320-3285 line!
💰Strategy Package
Gold: Short when it retreats to around 3325-3320, stop loss at 3330, target around 3290! For long orders, look at the support situation and then enter the market at the right time!
⭐️ Note: Labaron hopes that traders can properly manage their funds
- Choose the number of lots that matches your funds
- Profit is 4-7% of the fund account
- Stop loss is 1-3% of the fund account

7 Gold Trades That Banked Over $2,500 LAST WEEK – Steal My StratMy strategy is straightforward: I trade order blocks, target premium/discount zones, and capitalize on liquidity sweeps. When these three signals align on the chart, I enter without hesitation.
Gold triggered a strong reaction off a bullish order block at $3192-3120 after forming it on May 15th( also can be seen as STB), confirming a robust uptrend and a global reversal from a deep discount zone( can be seen on 4h time frame). For the bullish momentum to solidify, price must break and close above $3250
So i will keep an eye on GOLD chart and prefer long trader to shorts

Potential Selling Opportunity on Gold from 3374 level!Hello traders, 👋
I’m closely watching Gold (XAU/USD) for a possible short setup around the 3374 zone, and here’s my breakdown:
📉 Trend Structure:
Gold continues to respect its bearish market structure, consistently forming Lower Highs (LHs) and Lower Lows (LLs) — a clear sign of sellers maintaining control.
📐 Key Confluence at 3374:
Price is currently retracing toward a descending trendline that perfectly aligns with the 78.6% Fibonacci retracement level, drawn from the previous swing highs. This confluence zone strengthens the case for a potential reversal.
📍 Sell Zone:
I’m watching the 3360–3380 region, with 3374 being my preferred level to look for entries.
Entry Confirmation:
Before executing a trade, I’ll be waiting for:
A bearish engulfing candle
A bearish breaker block
Or a strong rejection pin bar on the lower timeframes
🎯 Targets:
TP1: 3321
TP2: 3253
TP3: 3210
🔒 Risk management is key – always wait for confirmation before entering!
Let me know what you think in the comments — agree or disagree? 👇
Trade safe and stay sharp!

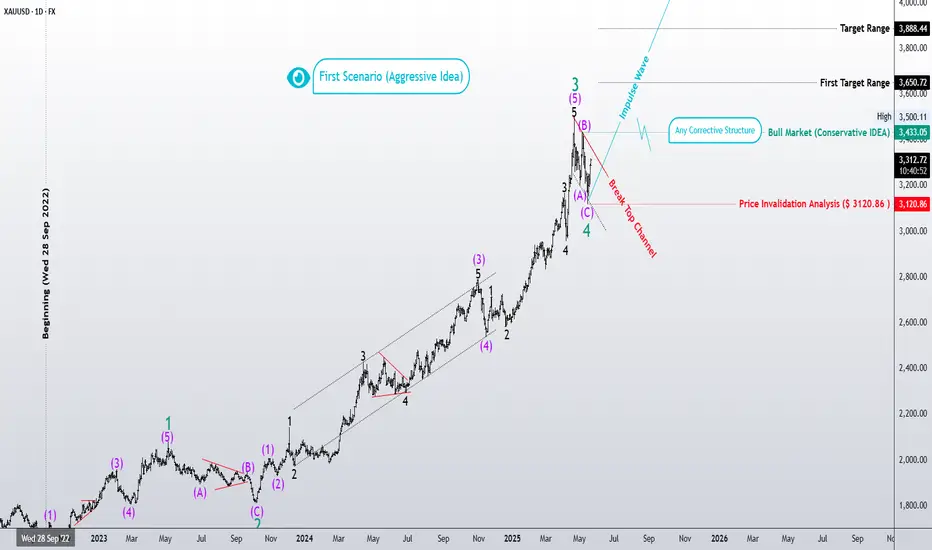
“Gold Surfer – Is Wave 5 About to Begin?”📈 This daily Elliott Wave analysis of the gold market (XAUUSD) tracks the impulsive advance from the September 2022 low ($1614). We now stand at a critical juncture: has Wave 4 completed, opening the path for Wave 5?
🔹 **Aggressive Scenario:** If the correction (ABC) is over, a new bullish Wave 5 could take gold first toward the $3884 zone, and potentially to expanded targets of $4126–$4275.
🔹 **Conservative Scenario:** If the correction continues, alternate patterns (flat, triangle, or complex correction) may still unfold. However, as long as price holds **above $3120**, the bullish wave structure remains valid.
🔻 **Invalidation Level:** $3120.86
🟢 The wave structure so far aligns with Elliott’s classic principles, and the bullish momentum still has room to unfold.
– Patterns whisper. I listen.
– Mr. Nobody 🎧📊
Gold 1h Analysis - What to expect from Gold today 21st May🌏 XAU/USD Outlook – Asian Session, May 21, 2025
Market Bias: 🔼 Strongly Bullish
Current Price: $3,299.34
Timeframe: 1H (with 5 & 21 EMA)
📊 Chart Breakdown:
Gold has surged cleanly through $3,243.28 and $3,268.13, now testing near-term resistance at $3,301.88.
Momentum is strong — candles are full-bodied with minimal wicks, showing solid buyer control.
EMAs are sharply angled and separated, indicating high momentum. No signs of reversal yet.
This is the strongest 1H push since the bounce from $3,157.35.
🔍 Key Levels:
Immediate Resistance: $3,301.88
Next Targets: $3,329.84 and $3,363.11 if breakout continues
Support Zones: $3,268.13 (structure low) → $3,243.28
Break below $3,268 would be first sign of a pullback starting
🗓️ News Ahead:
No major events during Asia session
Watch for U.S. Existing Home Sales later in NY
Big focus this week remains on FOMC Minutes (Wed) and PMIs (Thu)
📌 What to Expect:
Gold is entering the Asian session on strong bullish momentum
If buyers hold above $3,268, we could see another leg toward $3,329 during the London or early NY session
Likely to see sideways or slight pullback during Asia, but buyers are clearly in control — dips into structure may attract entries

Gold Breaks 3300 – Rally or Pullback Ahead?Gold has just broken through the critical support level at 3300 USD/oz and is currently trading around 3307. This movement aligns with previous forecasts, as gold continues to maintain a short-term bullish cycle. The next target investors are eyeing is the 3350 zone — a new resistance level that could define the upcoming trend.
📈 Technical Analysis:
• EMA 09: Candles are consistently closing above the EMA 09 line, indicating that bullish momentum remains dominant.
• Momentum remains strong, though profit-taking pressure could emerge as prices approach the 3310–3320 range.
• Short-term support: 3290 – a potential rebound area in case of a pullback.
• Major resistance ahead: 3350 – a key level that must be breached to confirm continued upside momentum.
💡 Short-Term Trade Scenarios:
🔻 SELL XAU/USD
Entry Zone: 3348 – 3350
Take Profit (TP): 3328 – 3330
Stop Loss (SL): 3360
🔺 BUY XAU/USD
Entry Zone: 3305 – 3307
Take Profit (TP): 3325 – 3327
Stop Loss (SL): 3295

Gold breaks upward, space opens up
📌 Driving events
Internationally, US media reported that US intelligence agencies found that Israel was preparing to attack Iran's nuclear facilities, and gold and crude oil both soared in the short term.
Recently, the Iran nuclear talks and the Russia-Ukraine talks were carried out simultaneously, and the market risk aversion sentiment fluctuated greatly
📊Comment analysis
While the medium and long-term outlook continues to be bullish on gold's performance this year, short-term operations are mainly based on news. Pay attention to light positions and maintain flexibility in short-term operations.
💰Strategy Package
🔥Buy Gold Zone: 3310-3315 SL 3307 Scalping
TP1: $3318
TP2: $3325
TP3: $3330
🔥Sell Gold Zone: 3354-3356 SL 3361
TP1: $3345
TP2: $3332
TP3: $3320
🔥Buy Gold Zone: $3252 - $3250 SL $3245
TP1: $3260
TP2: $3270
TP3: $3280
⭐️ Note: Labaron hopes that traders can properly manage their funds
- Choose the number of lots that matches your funds
- Profit is 4-7% of the fund account
- Stop loss is 1-3% of the fund account

Gold breaks through 3300, where is the next stop
📌 Driving events
Beth Hammack, president of the Federal Reserve Bank of Cleveland, stressed that the current US government's policies make it increasingly challenging for the Federal Reserve to effectively guide the economy and fulfill its dual mission of maintaining price stability and full employment. She also warned that the risk of a stagflationary environment (characterized by stagnant growth and persistent inflation) is rising. In contrast, Alberto Musalem, president of the Federal Reserve Bank of St. Louis, recently said that the current monetary policy stance is still appropriately adjusted.
Despite rising US Treasury yields, gold has struggled to gain support, indicating that higher yields alone are not enough to drive safe-haven demand under the current circumstances.
However, global monetary easing policies may provide support for this precious metal. In the latest moves during the Asian trading session, the People's Bank of China (PBoC) cut its benchmark interest rate, followed by the Reserve Bank of Australia (RBA) unexpectedly cutting the cash rate from 4.10% to 3.85% - moves that usually support non-yielding assets such as gold.
📊Comment Analysis
Spot gold prices have extended gains in recent intraday trading, taking advantage of its stability above EMA50 and trading along a bullish trend line on a short-term basis, strengthening its ability to reach the main resistance level of $3,300 and break it. Some weak signals have appeared on technical indicators. We noticed that a negative overlap signal has formed on the RSI, and after reaching overbought levels, this indicates that a temporary adjustment is needed on the upward action. Therefore, gold has reduced some of its early gains and waited for clearer signals to continue the bullish trend.
💰Strategy Package
🔥Sell Gold Zone: 3354-3356 SL 3361
TP1: $3345
TP2: $3332
TP3: $3320
🔥Buy Gold Zone: $3252 - $3250 SL $3245
TP1: $3260
TP2: $3270
TP3: $3280
⭐️ Note: Labaron hopes that traders can properly manage their funds
- Choose the number of lots that matches your funds
- Profit is 4-7% of the fund account
- Stop loss is 1-3% of the fund account

Gold : Sell or Wait for Pullback to buy?Price is approaching a strong Sell Zone (3320–3345), which aligns with Daily & Weekly Resistance.
🔻 Sell Idea:
Entry: 3325–3330
🟢 Buy Idea (if pullback):
Entry: 3245–3255
I will update SL and TP once trade is activated.
Watching for rejection in the Sell Zone or a retest of the Buy Zone before entering.
Share your opinion below. Trade safe! 💥

Ready to Rob the Gold Market? XAU/USD Heist Plan Revealed!🌟 Gold Heist Masterplan: XAU/USD Profit Raid 🚀💰
Thieves and profit hunters! 🤑 Ready to raid the XAU/USD gold market? This *Thief Trading Style* fuses sharp technicals with key fundamentals for a slick long-entry plan targeting the high-stakes Red Zone. Let’s grab those gains! 📈🎯
**Entry Plan 📈**
Strike when the breakout hits! Watch for a Moving Average crossover at 3380.00 to jump in for bullish profits. 🔔
- Set *buy stop orders* above the MA for breakout trades.
- Prefer pullbacks? Place *buy limit orders* at recent swing low/high on 15M or 30M timeframes.
📌 *Tip*: Set a chart alert to catch the breakout candle in action! 🚨
**Stop Loss 🛑**
Guard your stash with a *Thief SL* at the recent 4H swing low/high (3200.00).
Tweak your SL based on risk tolerance, lot size, and open orders. Stay alert! 🔍
**Profit Target 🎯**
Aim high for 3680.00, or lock in gains early to avoid overplaying your hand. Stay disciplined! 💪
**Scalper’s Edge 👀**
Scalpers, stick to quick long-side trades. Big players can dive in now; smaller traders, ride the swing with a trailing SL to secure profits. 💰
**Market Pulse 💵**
XAU/USD is charging bullish, driven by macro trends, COT data, sentiment, quantitative signals, and intermarket flows. Keep your eyes on fast-moving fundamentals! 🌎📊
**Latest Market Snapshot (UTC+1, May 21, 2025)**
- *Forex (XAU/USD)*: Hovering around 3155.00, testing key 200-day SMA support after a 2%+ sell-off.
- *COT Report (May 16, 2025)*: Non-commercial net long positions up by 5,200 contracts, reflecting strong bullish sentiment among speculators.
- *Commodities & Metals*: Gold stabilizing near monthly lows; oil prices steady, supporting commodity-linked currencies.
- *Indices & Crypto*: Risk-on sentiment in global indices aligns with bullish XAU/USD bias; crypto inflows up $785M last week.
**Trading Caution 📰**
Steer clear of new trades during major news to avoid volatility spikes.
Use trailing stops to protect open positions and lock in profits. 🚫
**Power Up the Heist! 💥**
Smash that Boost Button to fuel our trading crew! 🤝 With the *Thief Trading Style*, we’re snatching profits daily. Watch for the next plan! 🐱👤🚀
Happy trading, and let’s stack that cash! 💸🎉

Gold AnalyticsHello Everyone,
Some Wise tactical for our Gold chart.
it seems like the price would become much higher then expect, i don't see the cause but they pushing it to the limits, i guess gold has some valuable future value from now on in the world.
be careful trading this pair because it is definitely not stable.
Thank you.

XAUUSD DAILY PLAN UPDATE – MAY 19-20, 2025“We don’t redraw zones. We validate their power.”
Chart: ✅ Full SMC + Imbalance + Macro flow (no guesswork)
📍 STRUCTURE FOLLOW-UP FROM YESTERDAY
Price respected the key mapped zones with surgical precision:
✅ Confirmed reaction from "LTF FVG + Unmitigated OB": Price tapped this zone and has been coiling since, showing hesitation near 3245–3255 supply.
✅ Demand at 3182–3190 (Confirmed demand + liquidity seep) held the entire bullish wave.
❌ No break above 3255 = No RAKET yet. Bulls haven’t pushed through the supply.
So far, structure remains short-term bullish, macro still in correction, premium rejection active.
✅ STILL VALID ZONES FOR MAY 19
🔵 BUY ZONES
3182–3190 = "Confirmed demand + liquidity sweep"
→ 2x successful rejections = highly reactive if retested.
If this breaks = deeper retracement expected.
3120–3140 = “MACRO must-hold demand”
→ Cleanest long-term demand block. If we ever break this, macro flow turns fully bearish.
3060–3085 = “FVG fill + wick rebalancing”
→ Only for deep selloffs. High reward zone.
🔴 SELL ZONES
3248–3255 = “LTF FVG + Unmitigated OB”
→ In-play now. Watch for reaction + breakdown below 3228 = short confirmation.
(Great for intraday NY/Asia reversal plays)
3280–3292 = Internal LH / last supply
→ Valid swing short zone if market expands.
3360–3380 = “Supply + imbalance rejection”
→ Macro invalidation zone if broken.
⚠️ INVALIDATED / USED ZONES
❌ 3221–3228 minor demand → Already wicked through, structure closed above and below.
❌ 3230 OB → No longer fresh. Consolidated, weak edge.
❌ 3235–3240 scalp supply → Broken in Asia session, now used for liquidity inducement.
🔎 PLAN SCENARIOS
🔽 BEARISH:
Rejects again from 3248–3255, breaks 3228, targets 3182, then 3120.
🔼 BULLISH:
Clean break & hold above 3255, continuation toward 3280–3292 next.
💡 FLOW INSIGHT:
"Price has memory. Respect the zones, not the hype."
We are in a premium coil → until 3255 breaks, sellers have the edge.
Until 3182 breaks, bulls still breathe.
🔔 FINAL RAKET NOTE:
All the zones marked yesterday have proven structure today.
We hold them, refine them—not redraw them.
Drop a 🧠 if you still trust your chart.
Drop a 🚀 if you're ready for the next clean leg.
—
With logic & flow,
GoldFxMinds 💛

Gold Bullish Momentum – Entry from 3244 Holding StrongAfter recovering from the 3235–3244 demand zone, where buyers stepped in forcefully after a clean accumulation phase, gold (XAUUSD) has demonstrated strong bullish momentum. A short-term bullish trend appears to be continuing as price action has been making higher highs and higher lows.
Volume and candle strength support the entry for a buy position, which is confirmed by the breakout above 3244. The supply zone between 3256 and 3265, where rejections have happened in the past, is currently being pushed toward by the market. However, based on how the price responds within that zone, the current strength indicates that a clean tap or even a breakout may be possible.
📌 Trade Setup Summary: 🔹 Entry: 3244 (following confirmation of the breakout)
🛑 Stop-Loss: 3235 (see demand structure below)
🎯 Profit 1: 3256 (the supply zone's first resistance)
🎯 Profit 2: 3265 (supply zone top)

GOLD - WAITING FOR BREAK OUTOverall Price is still bearish, however, we may get short term buy opportunity as well.
Trade idea 1: SELL below 3207
Trade idea 2: BUY above 3225
Please note these trade ideas are for 100-200 pips target only.
Once trade is activated, I will update SL too.
Share your opinion below, Thank you.

Gold Under Pressure from USD and the FedThe gold market is currently under pressure due to:
- Recent statements from the U.S. Federal Reserve (Fed).
- A stronger U.S. dollar, which reduces gold’s appeal.
Previously, gold had been supported by:
- A weaker dollar following Moody’s downgrade of the U.S. credit rating.
- However, increased interest in risk assets and hopes for peace between Russia and Ukraine have reduced demand for gold.
Key factors to watch going forward:
• Statements from the Fed
• Developments in trade negotiations
Possible scenario:
• The bearish trend remains dominant.
• A short-selling wave and a breakdown from the triangle pattern may occur.
• A further drop toward the 3150–3120 zone is possible.

Is the gold trend caught in a vicious circle of ups and downs?
In the short term, the trend of gold prices has been separated from the influence of fundamentals, and is more dominated by emotional games. In particular, the price of gold once rose by 30% in 2025, which seriously stimulated the speculative sentiment in the market and made it easy for gold prices to fall into a vicious circle of "big ups and downs".
Next, the price of gold will become more sensitive to a series of factors, especially trade wars and tariff policies, geopolitical turmoil, the Federal Reserve's monetary policy and US macro data, as well as global central banks' gold purchases and physical demand, etc., will cause violent fluctuations in the short term. These are the points we need to pay close attention to!
Views on the trend of gold in the European session!
Looking back at the gold trend of the daily line in the past few days, the high resistance is generally maintained at around 3165-3150. This is also the fundamental reason why gold has been jumping up and down during this period, but it is still weak and under pressure overall. In addition, the current trading price is at the upper end of Friday's range, and the bullish momentum is not large, basically maintaining near a neutral point!
Since the market continued to be under pressure at 3250 yesterday, the market's bullish considerations need to be lowered first. At the same time, since it has been under pressure below 3265, the current short-term adjustment is obvious on the technical side, and short orders still need to be followed up! At present, we can only wait and see whether the market breaks upward or downward, and follow the trend.
Gold: Retreat to low longs near 3200 once, defense at 92, target at 3235! Retracement to near 3240-45 to gamble on short orders!

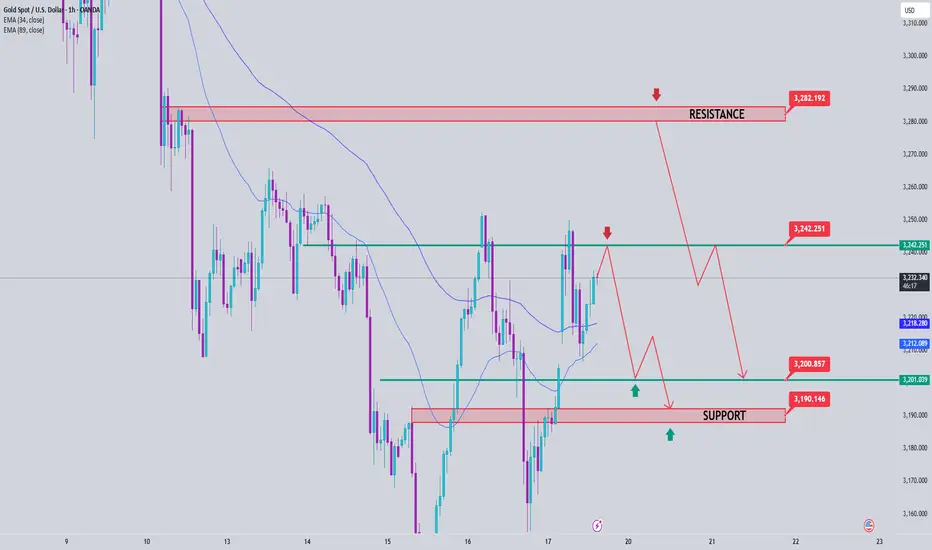
Gold trading plan May 19Gold is trading in a wide range and needs a few more factors to confirm whether the corrective downtrend of gold will continue or not.
3242 will be an important upper boundary in the current price channel. With the m30 candle force in the European session being able to break through the 3230 area, the prospect of reaching 3242 in the European session is very high. We can watch the price reaction and give a SELL signal in this area and the buy break point is 3230
On the further side, we have the daily resistance zone of 3282 when the 3242 border is broken and on the opposite side, the Asian session support zone around 3202-3200 acts as a barrier ahead before the gold price reaches the daily support level around 3192.
Gold fluctuates, and the profit range is in this area
📌 Driving events
After a phone call with Trump yesterday, Russian President Vladimir Putin said that efforts to end the war in Ukraine are on track and Moscow is ready to work with Ukraine on a memorandum of understanding for a future peace agreement. The United States has begun serious trade negotiations with the European Union, which has slightly improved investor sentiment. These negotiations broke the long-standing deadlock and brought some hope for more deals after Washington signed a framework agreement with the United Kingdom earlier this month. Trump had previously said that he could also reach an agreement with India, Japan and South Korea, but the negotiations with Japan seemed to be deadlocked over the issue of automobile tariffs.
📊Commentary Analysis
Gold prices fluctuated narrowly throughout the day, mainly due to the weakening of the US dollar and safe-haven demand after Moody's downgraded the US government's credit rating.
💰Strategy Package
For intraday short-term operations, pay attention to the 3200 area for long opportunities and defend 3193. Pay attention to the 3235 area for short opportunities and defend 3242.
⭐️ Note: Labaron hopes that traders can properly manage their funds
- Choose the number of lots that matches your funds
- Profit is 4-7% of the fund account
- Stop loss is 1-3% of the fund account

Fed Signals No Rate Cuts Until Sept – Gold Under PressureFed’s Interest Rate Outlook:
- Two senior Federal Reserve officials – New York Fed President John Williams and Atlanta Fed President Raphael Bostic – signaled that the Fed is unlikely to cut interest rates before September 2025.
- The Fed needs more time to assess the economic impact of new trade policies from the Trump administration.
- Trade tariffs and ongoing negotiations are creating major uncertainties, making it difficult for businesses and households to plan financially.
- The probability of a rate cut in June has dropped to just 10%, and expected rate cuts for 2025 have been revised down from four to only two.
Impact on Global Gold Prices:
✅ 1. Short-term – Downward Pressure:
Prolonged high interest rates → stronger US dollar → gold prices face downward pressure as gold yields no interest.
🔄 2. Medium-term – Mixed Outlook:
- If trade talks fail and tariffs increase, leading to economic and inflation risks → gold may benefit as a safe-haven asset.
- Conversely, if trade tensions ease and inflation stays under control, expectations for rate cuts will decline further → gold may continue facing selling pressure.
💡 Short-Term Trade Scenarios:
SELL XAU/USD Zone : 3249 - 3252
💰 TP : 3247 – 3242
🚨 SL $3257
BUY XAU/USD Zone: 3190
💰 TP : 3195 – 3200
🚨 SL $3185

XAU/USD 20 May 2025 Intraday AnalysisH4 Analysis:
-> Swing: Bullish.
-> Internal: Bullish.
Analysis and bias remains the same as analysis dated 23 April 2025
Price has now printed a bearish CHoCH according to my analysis yesterday.
Price is now trading within an established internal range.
Intraday Expectation:
Price to trade down to either discount of internal 50% EQ, or H4 demand zone before targeting weak internal high priced at 3,500.200.
Note:
The Federal Reserve’s sustained dovish stance, coupled with ongoing geopolitical uncertainties, is likely to prolong heightened volatility in the gold market. Given this elevated risk environment, traders should exercise caution and recalibrate risk management strategies to navigate potential price fluctuations effectively.
Additionally, gold pricing remains sensitive to broader macroeconomic developments, including policy decisions under President Trump. Shifts in geopolitical strategy and economic directives could further amplify uncertainty, contributing to market repricing dynamics.
H4 Chart:
M15 Analysis:
-> Swing: Bullish.
-> Internal: Bearish.
Analysis and bias remains the same as analysis dated 15 May 2025.
In my analysis from 12 May 2025, I noted that price had yet to target the weak internal high, including on the H4 timeframe. This aligns with the ongoing corrective bearish pullback across higher timeframes, so a bearish internal Break of Structure (iBOS) was a likely outcome.
As anticipated, price targeted strong internal low, confirming a bearish iBOS.
While a bullish Change of Character (CHoCH) has printed, I am exercising discretion and not marking it as such, given the shallow nature of the pullback.
Additionally, another bullish CHoCH has printed, with price now trading within a defined internal range. I will continue monitoring this closely, particularly in relation to the depth of pullback.
Intraday Expectation:
Price to continue bullish, react at either premium of internal 50% EQ or M15 demand level before targeting weak internal low priced at 3,120.765
Note:
Gold remains highly volatile amid the Federal Reserve's continued dovish stance and persistent geopolitical uncertainties. Traders should implement robust risk management strategies and remain vigilant, as price swings may become more pronounced in this elevated volatility environment.
Additionally, President Trump’s recent tariff announcements are expected to further amplify market turbulence, potentially triggering sharp price fluctuations and whipsaws.
M15 Chart:
