Putin's phone call changed the market?
📌 Driving Events
Putin's "peace smoke bomb", gold is under short-term pressure
Just when gold was soaring due to risk aversion, a piece of news on Monday cooled the market instantly - after Putin and Trump talked on the phone, both sides released the signal that "Russia and Ukraine will soon ceasefire negotiations." Trump even announced loudly: "Russia and Ukraine will start ceasefire negotiations immediately!"
US President Trump said, "We will do everything we can to stop the conflict in Ukraine."
This news caused the market's risk appetite to rise briefly, and the gold price fell slightly to around $3,220 in the Asian market on Tuesday. But senior observers soon discovered that Putin's words were full of diplomatic rhetoric - he only said that the peace efforts were "on the right track" but did not promise a specific ceasefire time. Former Swedish Prime Minister Bilt pointed out: "This is Putin's victory. He successfully delayed the ceasefire pressure while continuing military operations."
Market truth: Geopolitical risks have not really subsided, and the safe-haven demand for gold is only a short respite.
📊Comment analysis
For investors, the question now is not "whether to buy gold", but "when to buy and how much to buy". At the moment when the global economic order is being reconstructed, the light of gold may have just begun to shine.
💰Strategy Package
Bullish breakout scenario: If the price breaks through the high of last Friday's rebound at $3,252 and continues to rise, you can go long with a light position near $3,260, targeting the $3,280-$3,290 range.
Bearish breakout scenario: If the price breaks below the key support level of $3,200 and further declines, you can go short near $3,190, targeting the $3,170-$3,160 range.
⭐️ Note: Labaron hopes that traders can properly manage their funds
- Choose a lot size that matches your funds
- Profit is 4-7% of the capital account
- Stop loss is 1-3% of the capital account
Goldprice

AUDUSD and Gold both in a wedge getting ready to break outCOMEX:GC1! FX:AUDUSD
AUDUSD Looks bearish, so far, heading into a tight wedge within a larger bear flag. AUD being commodity currency I am looking at gold as well which too seems to be in bullish descending triangle.But these descending triangle could also break down strongly. There is a potential strong move coming in AUDUSD and high probability it would be to upside
But Its still wait and watch for now

Gold Price Soars After Moody's US Downgrade: What's Next?Gold's Resurgence: A Deep Dive into the Moody's Downgrade and Market Tremors
The world of finance is a complex ecosystem, where a single event can trigger a cascade of reactions across global markets. Recently, such an event unfolded as Moody's Investors Service, one of the leading credit rating agencies, delivered a significant blow to the United States' financial standing by downgrading its sovereign credit rating. This unexpected move, occurring after a period of notable decline for gold, sent shockwaves through the financial landscape, prompting a sharp rally in the precious metal's price. In the early hours of Asian trading, gold surged by as much as 1.3%, reaching approximately $3,245 an ounce, a clear testament to its enduring appeal as a safe-haven asset in times of uncertainty.
The Catalyst: Moody's Downgrade and its Implications
Credit ratings are critical indicators of a borrower's ability to meet its debt obligations. For a sovereign nation, its credit rating influences borrowing costs, investor confidence, and its overall standing in the international financial community. Moody's decision to lower the U.S. sovereign credit rating by one notch, from the pristine Aaa to Aa1, was not taken lightly. The agency pointed to a confluence of persistent and concerning factors. Chief among these were the United States' chronic budget deficits, which have shown little sign of abatement despite various economic cycles. Moody's also highlighted a perceived erosion of political will and institutional strength to effectively address the nation's deteriorating fiscal trajectory. The growing burden of national debt and the escalating costs of servicing this debt were explicitly mentioned as significant concerns underpinning the downgrade.
This wasn't the first time the U.S. had faced a credit rating downgrade. In 2011, Standard & Poor's (S&P) stripped the U.S. of its top-tier AAA rating, a move that also sent tremors through global markets. The parallels are noteworthy, as both instances underscored deep-seated concerns about the sustainability of U.S. fiscal policy. A sovereign downgrade, particularly for an economy as pivotal as the United States, has far-reaching consequences. It can lead to higher borrowing costs for the government, potentially impacting everything from infrastructure spending to social programs. Furthermore, it can dent investor confidence, leading to capital outflows or a re-evaluation of risk associated with U.S. assets.
The immediate market reaction to Moody's announcement was a textbook flight to safety. The U.S. dollar, typically a beneficiary of global uncertainty, found itself under pressure. As the world's primary reserve currency, the dollar's value is intrinsically linked to the perceived strength and stability of the U.S. economy. A credit downgrade, by questioning that stability, naturally led to a weakening of the greenback. This weakening, in turn, provided a direct tailwind for gold. Gold is priced in U.S. dollars, so a cheaper dollar makes gold more affordable for investors holding other currencies, thereby stimulating demand.
Simultaneously, U.S. Treasury bonds, long considered one of the safest investments globally, experienced a sell-off. This might seem counterintuitive, as a flight to safety often includes government bonds. However, a credit downgrade directly impacts the perceived creditworthiness of those bonds. Investors demand a higher yield (return) to compensate for the increased perceived risk, leading to a drop in bond prices (yields and prices move inversely). The Treasury yield curve, which plots the yields of bonds with different maturities, steepened, indicating greater uncertainty about longer-term economic prospects and inflation. U.S. stock futures also registered declines, reflecting concerns that higher borrowing costs and diminished confidence could negatively impact corporate earnings and economic growth.
Gold: The Evergreen Safe Haven
Amidst this turmoil, gold shone brightly. Its rally was a classic demonstration of its role as a premier safe-haven asset. Throughout history, gold has been a store of value, a tangible asset that retains its worth when paper currencies or other financial instruments falter. Its appeal transcends economic cycles and geopolitical shifts. Unlike fiat currencies, which can be devalued by inflation or government policy, gold's supply is finite, giving it an intrinsic scarcity value.
In times of economic stress, such as those signaled by a sovereign credit downgrade, investors flock to gold for several reasons. Firstly, it acts as a hedge against currency depreciation. If the U.S. dollar weakens significantly, holding gold can preserve purchasing power. Secondly, gold is often seen as a hedge against inflation. If a government resorts to inflationary policies to manage its debt burden, the real value of money erodes, while gold tends to hold or increase its value. Thirdly, in periods of heightened geopolitical risk or systemic financial instability, gold provides a sense of security that other assets may not offer. It is a universally accepted medium of exchange and store of wealth, independent of any single government or financial institution.
The downgrade by Moody's amplified concerns about the U.S.'s fiscal health, a narrative that has been building for some time. Commentators pointed to over a decade of what they termed "fiscal profligacy," where successive administrations and Congresses have struggled to implement sustainable long-term solutions to the nation's growing debt. The phrase "ticking debt timebomb" resurfaced in financial commentary, underscoring the anxieties surrounding the long-term implications of current fiscal policies for the world's largest economy. These anxieties naturally fueled demand for gold as a protective measure. Adding another layer to these concerns were reports of a U.S. House panel approving proposed tax cuts, which, according to some economic analyses, could add trillions more to the national debt, further exacerbating the fiscal imbalance.
The Preceding Slump: A Market Breather
The vigorous rally in gold prices was particularly striking given its performance in the preceding week. The metal had been on a downward trajectory, poised for what was described as its steepest weekly decline in six months. This earlier weakness was primarily attributed to a strengthening U.S. dollar and an apparent easing of trade tensions between the United States and China. When geopolitical risks appear to subside and economic optimism grows, investors often rotate out of safe-haven assets like gold and into riskier assets, such as equities, in pursuit of higher returns. This is often referred to as a "risk-on" environment.
The announcement of a 90-day pause on tariffs between the U.S. and China had injected a dose of optimism into the markets. This temporary truce in the protracted trade war improved investor sentiment, reducing the perceived need for the kind of insurance that gold provides. Consequently, capital flowed towards assets perceived to benefit more directly from improved global trade and economic growth, leading to a pullback in gold prices. However, the Moody's downgrade swiftly reversed this trend, highlighting how quickly market sentiment can pivot in response to unexpected news.
Navigating a Complex Web of Global Influences
Gold's price is rarely determined by a single factor. It is subject to a complex interplay of global economic data, geopolitical developments, central bank policies, and investor sentiment. While the Moody's downgrade was the immediate catalyst for the recent rally, other elements continue to shape the landscape.
Ongoing geopolitical tensions in various parts of the world provide a persistent undercurrent of support for gold. Any escalation of conflicts or emergence of new geopolitical flashpoints can quickly send investors seeking refuge in the yellow metal. Furthermore, mixed economic data from major economies contributes to market volatility. For instance, softer-than-expected economic indicators from China, the world's second-largest economy, can dampen global growth expectations and influence risk appetite, which in turn affects gold.
Statements from key policymakers also carry significant weight. Comments from U.S. Treasury Secretary Scott Bessent regarding the potential reimposition of "Liberation Day" tariffs if trade negotiations with certain partners were not conducted in "good faith" served as a reminder that trade uncertainties remain. Such pronouncements can easily reignite concerns and support gold prices.
The Long-Term Horizon: Bullish Undertones Persist
Despite the short-term volatility, many analysts maintain a constructive long-term outlook for gold. Several underlying factors are expected to provide structural support for the precious metal in the coming years. One such factor is the potential for ongoing U.S. dollar weakness, driven by the country's twin deficits (budget and current account) and a gradual shift by some central banks to diversify their foreign exchange reserves away from an overwhelming reliance on the dollar. This diversification trend, if it continues, could provide a sustained tailwind for gold.
Moreover, the policies of major governments and central banks can also influence gold's trajectory. For example, periods of expansionary monetary policy, characterized by low interest rates and quantitative easing, can reduce the opportunity cost of holding gold (which yields no income) and potentially lead to inflationary pressures, both of which are typically gold-positive.
It's important to note that gold had already demonstrated strong performance in 2025, even before this latest surge. Year-to-date, the metal had appreciated significantly, reportedly by around 23%, and had even briefly surpassed the $3,500 an ounce mark for the first time in history during April. This underlying strength suggests that broader market forces were already favoring gold.
Major financial institutions have also echoed this optimistic long-term view. JPMorgan, for instance, has projected that gold could average $3,675 an ounce by the end of the year, with a potential to reach $4,000 before the close of 2026. Similarly, Goldman Sachs maintained its forecast of $3,700 by year-end and a $4,000 target by mid-2026. These forecasts often consider a range of scenarios, including the path of Federal Reserve interest rate policy and the likelihood of a U.S. recession. Even with expectations of delayed Fed rate cuts and a potentially lower U.S. recession risk, these institutions see considerable upside for gold.
Investor Strategy in a Shifting Landscape
For investors, the recent events serve as a potent reminder of gold's role in a diversified portfolio. While gold can be volatile in the short term, its ability to act as a hedge against various risks makes it a valuable component for long-term wealth preservation. The Moody's downgrade and the subsequent market reaction underscore the importance of not being complacent about sovereign risk, even in developed economies.
Retail investors might consider gold through various avenues, including physical bullion (coins and bars), gold exchange-traded funds (ETFs) that track the gold price, or shares in gold mining companies. Institutional investors, such as pension funds and endowments, often allocate a portion of their portfolios to gold as a strategic hedge and a diversifier.
The key is to view gold not as a speculative tool for quick profits, but as a long-term strategic holding that can provide stability and protection during periods of economic or geopolitical stress. The optimal allocation to gold will vary depending on an individual's risk tolerance, investment goals, and overall market outlook.
Conclusion: Gold's Enduring Relevance
The sharp rebound in gold prices following Moody's downgrade of the U.S. credit rating is a multifaceted event with significant implications. It highlights gold's unwavering status as a safe-haven asset, its sensitivity to shifts in U.S. dollar valuation, and the profound impact of sovereign creditworthiness on global financial markets. The downgrade served as a stark reminder of the underlying fiscal challenges confronting the United States and their potential to create ripples of uncertainty that benefit traditional stores of value.
Looking ahead, investors and market observers will be keenly focused on upcoming U.S. economic data, pronouncements from the Federal Reserve regarding monetary policy, and the evolving geopolitical landscape. While short-term fluctuations are inevitable, the fundamental factors that have historically supported gold – its role as an inflation hedge, a currency hedge, and a crisis commodity – remain firmly in place. As the global economic and political environment continues to navigate complex challenges, gold is likely to retain its allure as a critical component of a well-diversified investment strategy, a timeless guardian of wealth in an ever-changing world. The recent bounce may be more than just a fleeting reaction; it could be a reaffirmation of gold's enduring value proposition in an era of increasing uncertainty.

Is Gold Forming a Double Top?Over the past four trading sessions, gold has shown oscillations of around 1% in the short term. For now, indecision is beginning to emerge in the price of the precious metal as market confidence gradually recovers. The CNN Fear and Greed Index is already holding near the "extreme greed" zone, and as confidence continues to rise steadily, this could become a problem for gold demand, as it remains the classic safe-haven asset.
Potential Double Top
Price movements in recent weeks have formed a consistent resistance area at $3,400 per ounce, with pullbacks reaching the $3,200 zone. Currently, a potential double top pattern appears to be forming on the chart, with key support holding near $3,200. If bearish pressure becomes strong enough to consistently break below this level, the pattern could gain significant technical relevance and signal a potential trend reversal in the coming sessions.
RSI
The RSI line remains oscillating around the 50 level, indicating a balanced momentum between buyers and sellers. This can be explained by the ongoing support zone that is holding the price in the short term.
ADX
The ADX line is showing a similar picture, with readings increasingly close to the 20 level, which indicates that the strength of recent price movements is fading. This further supports the idea of continued indecision around the current support area.
Key Levels to Watch:
$3,200 per ounce – Critical Support: Possibly the most important level to watch, as it represents the lower boundary of the double top pattern and corresponds to a neutral price zone. Sustained selling pressure below this level could trigger a strong bearish bias and open the door to a new downward trend.
$3,400 per ounce – Main Resistance: This is the historical high zone for gold. A breakout above this level could be interpreted as a continuation of the long-term bullish trend.
Written by Julian Pineda, CFA – Market Analyst

Unlock XAUEUR Riches: Thief Trading’s Epic Long Setup!💎 Epic Gold Heist: XAUEUR Trade Plan💎
Greetings, Wealth Raiders & Market Mavericks! 👋🌍
Ready to pull off a legendary heist in the XAUEUR "Gold vs Euro" market? Our Thief Trading Style blends slick technicals with sharp fundamentals to unlock the vault. Follow this cunning plan, aim for the high-stakes Red Zone, and let’s swipe the profits! 🤑💰 This is a high-risk, overbought setup with potential for consolidation or a trend reversal—perfect for bold traders. Stay sharp, trade safe, and let’s get rich! 💪🎉
📈 Entry: Crack the Vault!
The bullish trend is ripe for the taking! 💥
Place buy limit orders at the most recent swing low or high within a 15 or 30-minute timeframe.
Pro tip: Set price alerts on your chart to catch the perfect entry.
For the fearless, jump in at market price—the heist is LIVE! 🚀
🛑 Stop Loss: Guard Your Loot
Protect your stash with a Thief Stop Loss:
Set SL at the nearest/recent low on the 4H timeframe (~€2800.00 for swing trades).
Adjust SL based on your risk tolerance, lot size, and number of orders.
Stay disciplined—don’t let the bears snatch your gains! 🐻
🎯 Target: Grab the Gold
Aim for €3070.00 or exit early to secure profits.
Scalpers: Stick to long-side scalps with quick hits. Use trailing SL to lock in gains.
Swing Traders: Hold for the big score, trailing your SL to ride the trend safely. 💸
🧠 Why This Trade? Real-Time Data & Insights (May 19, 2025)
The XAUEUR market is riding a bullish wave, fueled by macro and fundamental drivers. Here’s the latest scoop:
Technical Analysis 📊:
Gold broke key support at $3200 (~€3000) last week but is showing signs of consolidation near €3050.
RSI indicates overbought conditions, hinting at a potential pullback or reversal. Watch for bearish traps at €3070.
4H chart shows a strong uptrend with support at €3000 and resistance at €3070.
Fundamental Drivers 📰:
US-China Trade Deal Hopes: Easing tensions are weighing on gold’s safe-haven appeal, pushing prices lower.
Central Bank Buying: Demand from China and emerging markets (1,136 tonnes in 2022) supports long-term bullishness.
US Economic Data: Mixed signals from April’s US CPI and a Q1 2025 GDP contraction (-0.3%) keep markets volatile.
Macro Economics 🌍:
Trump’s tariffs (25% on Mexico/Canada, 20% on China) are stoking inflation fears, which could boost gold if growth falters.
A weaker USD (down 3% from February highs) supports XAUEUR’s upside.
ECB may cut rates below 2%, weakening the Euro and lifting XAUEUR.
COT Report & Positioning 📋:
OANDA sentiment shows 73% of traders net-long on gold, signaling bullish bias but potential for a squeeze if sentiment shifts.
Comex gold inventories are rising, indicating arbitrage opportunities and strong physical demand.
Seasonal Factors 📅:
Gold typically sees strength in Q2 due to wedding season demand in Asia and safe-haven buying amid geopolitical noise.
May often marks consolidation after Q1 rallies, so watch for volatility.
Sentiment Outlook (May 19, 2025) 😊:
Real-Time Sentiment: Market mood is cautiously bullish, with 65% of analysts favoring longs but warning of overbought risks.
Risk appetite is improving due to trade deal optimism, but geopolitical tensions (e.g., EU-US tariff threats) keep gold attractive.
Social media buzz on gold’s resilience despite recent dips, with traders eyeing €3100 by June.
Future Trend Outlook Score ⭐:
Short-Term (1-2 weeks): 7/10 (Bullish with caution due to overbought signals).
Medium-Term (1-3 months): 8/10 (Supported by central bank demand and inflation fears).
Long-Term (6-12 months): 9/10 (Gold could hit €3200 if trade wars escalate).
⚠️ Trading Alert: News & Position Management
News releases can flip the market faster than a getaway car! 🚗💨
Avoid new trades during high-impact events (e.g., US CPI, Fed speeches).
Use trailing stop-loss orders to lock in profits and protect running positions.
Check economic calendars for updates—Thursday’s macro data could shake things up!
💥 Boost the Heist!
Love this plan? Smash the Boost Button to supercharge our robbery squad! 🚀 Every like and view fuels our mission to conquer the markets. Join the Thief Trading Style crew, steal profits daily, and live the wealthy life! 🤝💖
Stay tuned for the next heist—I’ll be back with another epic plan! 🐱👤🤑

Gold bottomed out and rebounded, US market ideas!
📊Comment analysis
During the European and American markets, the market rebounded to 3249. Before the rebound, it was mentioned that the first resistance today was around 3251, followed by the defense point of 3265. As expected, gold plunged slightly near the resistance level of 3251, and fell to 3227 at its lowest.
💰Strategy package
Short at the current price of 3239-40, add shorts near 3242 and 3245, stop loss 3253 target 3200-3165
⭐️ Note: Labaron hopes that traders can properly manage their funds
- Choose the number of lots that matches your funds
- Profit is 4-7% of the fund account
- Stop loss is 1-3% of the fund account

Gold fluctuates. Will it break through resistance and start to rWe analyzed the fundamentals and technical aspects comprehensively over the weekend, and the overall trend tends to be upward.
The Asian market opened, and the price rose to around $3,250 and fell back; in yesterday's analysis, I thought that the Asian market would rise rapidly after the opening due to the impact of the US sovereign credit rating. As I predicted, the opening in the morning quickly rose to the intraday high of $3,250, and then began to fall. Finally, it fell to $3,210 and strengthened again, and the trend was the same as my analysis.
From the current market, gold continues to fluctuate greatly. It is relatively strong at present, but it is suppressed by the $3,250-3,255 area. Therefore, it is expected that the price will continue to rise after adjustments below $3,250; if the price stabilizes above $3,210, there is still room for the price to rise. Below this, it will start a downtrend that could potentially hit last week’s cycle low of $3,150.
In the short term, we need to pay attention to the support level of $3225. If it breaks through the resistance level of $3250-55, it will open up room for growth. We will further pay attention to the high point of $3270-3290.
Until the price breaks through the upward resistance zone of $3250-3255 with a strong force, it is recommended not to adopt a long strategy.

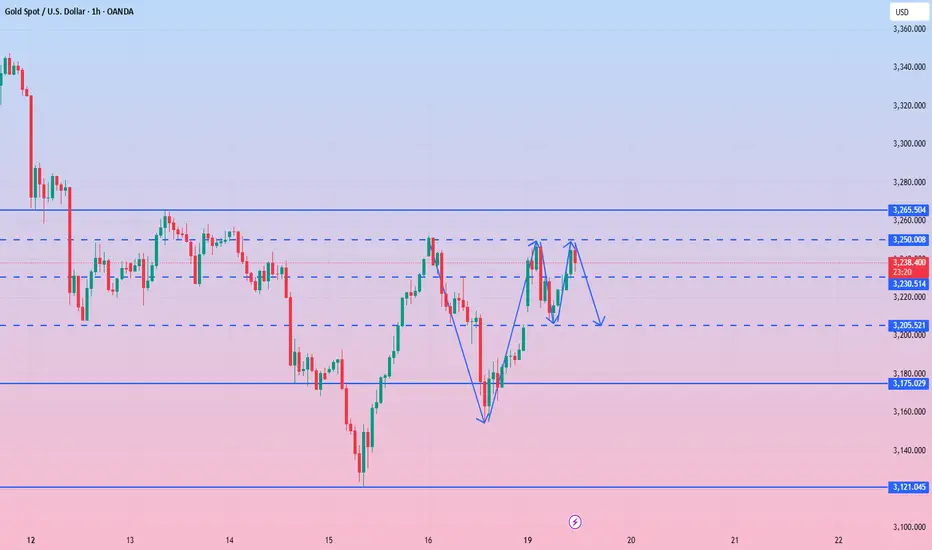
GOLD(1H)📌 Gold Analysis (XAU/USD) - Key 1H Levels
🔍 Critical Zones:
▫️ Resistance: $3265
▫️ Support: $3120
▫️ Trend: Short-term bullish above $3120
⚡️ Trading Plan:
• Entry Zone: $3120-$3155
• Target: $3325 | SL: $3120
• Risk: Max 1% capital
💬 Engagement:
"Which scenario do you think is more likely?
1) Break above $3348
2) Rejection from $3320
Comment your answer! ↓"

GOLD → Correction & The decline will continueGold is trading below major resistance zones: Bearish Bias Below Key Levels
Price recently rejected this zone multiple times, forming lower highs and showing bearish momentum.
📉 Idea: Sell
📍 Sell Zone: $3,245–$3,250
📍 Sell Zone: $3,265–$3,270
Bias remains bearish unless price breaks and holds above $3,270.
Comment below your thoughts. Thank you.

It’s the right time to shortUS President Trump recently criticized Fed Chairman Powell again, calling him "slow to act" and emphasizing that the Fed should cut interest rates as soon as possible to support the economy. Trump believes that delaying interest rate cuts may lead to the risk of recession in the US economy, but the Fed still takes inflation and employment data as the core of decision-making, and the two sides have obvious differences in policy positions.
At present, the Fed's interest rate cut expectations have been postponed and the magnitude has been reduced. Coupled with the expectation of rising US bond yields, the gold market sentiment has weakened. The world's largest gold ETF recently reduced its holdings by 8.98 tons to 918.73 tons, reflecting the cooling of institutions' short-term bullish enthusiasm for gold. Technically, gold prices continued to weaken after breaking through key support last week, and the weekly closing was negative, suggesting that shorts were dominant; the daily level was constrained by the 20-day moving average, and the volatile downward trend may continue in the short term. Focus on the 3250-3265 line resistance during the day. If it cannot break through, the $3,200 mark below may face a test.
Gold recommendation: short sell when it rebounds to 3245-3252 range. Target 3230-3220.
XAUUSD:Short mainly
Gold continued its pullback last week, bouncing back after meeting key support and closing below the negative shadow line. At the present stage, the trend is relying on the key support level shock, and the rebound has not made a breakthrough, the pressure after the retreat of risk aversion is more and more obvious, and there is still the possibility of deepening the decline.
Today's trend personal expected sideways shock, short-term pressure above 3245-3250, can be around this area short, below the first support to see 3200, after breaking the 3145-3150.
This week's overall operating range relies on the 3145-3250 range band.
↓↓↓ The detailed strategy club will have tips, updated daily, come and get them →→→

Gold Price Targets Fresh GainsGold Price Targets Fresh Gains
Gold price started a fresh increase above the $3,210 resistance level.
Important Takeaways for Gold Price Analysis Today
- Gold price started a steady increase from the $3,120 zone against the US Dollar.
- A connecting bullish trend line is forming with support at $3,210 on the hourly chart of gold at FXOpen.
Gold Price Technical Analysis
On the hourly chart of Gold at FXOpen, the price found support near the $3,120 zone. The price formed a base and started a fresh increase above the $3,150 level.
The bulls cleared the $3,200 zone and the 50-hour simple moving average. There was also a spike above the 50% Fib retracement level of the downward move from the $3,347 swing high to the $3,120 low. The RSI is now above 50 and the price could aim for more gains.
Immediate resistance is near the 61.8% Fib retracement level of the downward move from the $3,347 swing high to the $3,120 low at $3,260.
The next major resistance is near the $3,295 level. An upside break above the $3,295 resistance could send Gold price toward $3,350. Any more gains may perhaps set the pace for an increase toward the $3,385 level.
Initial support on the downside is near the $3,210 zone. There is also a connecting bullish trend line forming with support at $3,210. If there is a downside break below the $3,210 support, the price might decline further.
In the stated case, the price might drop toward the $3,155 support. The next major support sits at $3,120. Any more losses might send the price toward the $3,060 level.
This article represents the opinion of the Companies operating under the FXOpen brand only. It is not to be construed as an offer, solicitation, or recommendation with respect to products and services provided by the Companies operating under the FXOpen brand, nor is it to be considered financial advice.

Gold Alert: Short-Term Drop Ahead?🔴Trump’s Tariffs Eased, but U.S. Recession Risk Doubles!
Although President Trump has temporarily de-escalated trade tensions—helping U.S. stocks rebound—the risk of a U.S. recession in the next 12 months has doubled, according to a survey by the Philadelphia Fed, rising from 15.4% to 37%.
Experts warn that prolonged uncertainty from the trade war is making businesses and consumers more cautious, increasing the risks of slower growth and rising unemployment.
The U.S. GDP growth forecast for 2025 has been revised down to just 1.4%, the lowest in 16 years (excluding the pandemic). Meanwhile, public sentiment has slightly improved, thanks to signs of a temporary easing from the Trump administration.
⚠️ Gold price has recovered in the European session, returning to the old peak area, trading sideways around 3250. Bearish pressure continues to build. This is a signal traders need to watch closely.
💡 Short-Term Trade Scenarios:
SELL XAU: zone 3248-3251 scalping
💰 TP: 50 - 100 - 200 pis
🚨 SL: 3254

Gold price outlook: short term increase📝 NEWS
Gold Prices Rise as Moody’s Downgrades U.S. Credit Rating
- Moody’s downgraded the U.S. credit rating from Aaa to Aa1, citing concerns over high public debt and unsustainable fiscal spending.
- The move boosted demand for safe-haven assets, leading to a weaker U.S. dollar and rising U.S. Treasury yields.
- Spot gold prices rose 0.5% to $3,217.49/oz, while June gold futures gained 1% to $3,220.17/oz.
- Other precious metals also saw modest gains:
- Silver +0.5% to $32.530/oz
- Platinum +0.1% to $991.50/oz
Market Outlook
- In the coming week, the market will closely watch a busy U.S. economic calendar, including:
- Speeches from Federal Reserve officials
- Preliminary PMI data
- Key housing indicators
- These events are expected to influence short-term monetary policy expectations.
Technical View: Gold Poised to Continue Rising
⚠️ Gold is expected to continue its upward trend amid rising trade tensions between the U.S. and China, with little progress in ongoing tariff negotiations.
💡 Short-Term Trade Scenarios:
🚨 SELL XAU : zone 3247-3250
SL: 3255
TP: 50 - 100 - 300pips
🚨 BUY XAU : zone 3188-3191
SL: 3183
TP: 50 - 100 - 300pips

XAUUSDHello traders!
I’m sharing what may be your first trade of the week. This setup comes from the XAUUSD pair. I currently see a Buy opportunity in Gold, and the trade is already active on my side.
🔍 Trade Details:
✔️ Timeframe: 15-Minute
✔️ Risk-to-Reward Ratio: 1:1.50
✔️ Trade Direction: Buy
✔️ Entry Price: 3223.82
✔️ Take Profit: 3237.39
✔️ Stop Loss: 3214.78
🔔 Disclaimer: This is not financial advice. I’m simply sharing a trade I’m personally taking, based on my own methodology. It is intended purely for educational purposes.
📌 If you're interested in a more systematic and data-driven approach to trading:
💡 Follow the page and turn on notifications to stay updated with future trade ideas and market breakdowns.

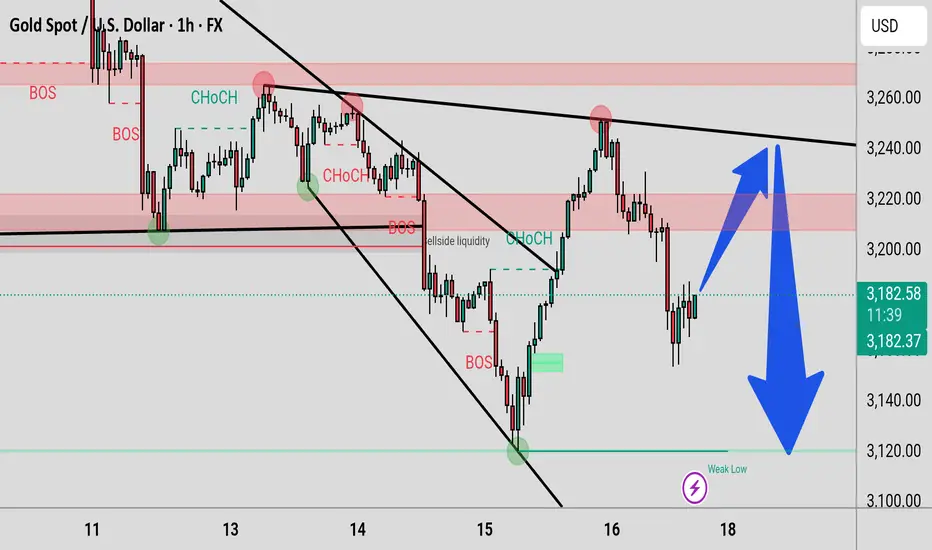
Gold Analysis.... This 1-hour chart of XAU/USD illustrates a key decision point, showing a possible breakout above resistance or rejection and continuation to the downside. Notable features include:
CHoCH (Change of Character) and BOS (Break of Structure) points signaling previous shifts in market direction.
Sellside liquidity area marked where orders may have been swept.
Price currently trading near $3,180.91, just below a resistance zone.
Blue arrows indicate possible bullish move toward $3,240+ or bearish continuation to $3,125, marked as a Weak Low.
Gold Price Trading Around 3,200 Points
📌 Gold Information
Gold (XAU/USD) is recovering from recent losses, trading around $3,230 per troy ounce during Asian trading hours on Monday as investors seek safe haven assets amid growing concerns about the US economic outlook and fiscal sustainability. The rebound follows Moody's decision to downgrade the US credit rating by one notch, from Aaa to Aa1, citing growing debt and the burden of interest payments. This follows previous downgrades by Fitch and Standard & Poor's in 2023 and 2011, respectively. Moody's now forecasts that the US federal debt will surge to around 134% of GDP by 2035 from 98% in 2023, due to ballooning debt servicing costs, expanding entitlement programs, and shrinking tax revenues - all of which have heightened investor concerns and provided new support for gold prices.
📊Comment Analysis
Gold price fluctuated around 3200 at the beginning of the week. There was not much news and it continued to go sideways.
💰Strategy Package
⭐️Set gold price:
🔥Sell gold area: 3259-3261 SL 3266
TP1: $3250
TP2: $3240
TP3: $3230
🔥Buy gold area: $3192 - $3190 SL $3185
TP1: $3200
TP2: $3210
TP3: $3220
⭐️ Note: Labaron hopes that traders can properly manage their funds
- Choose the number of lots that matches your funds
- Profit is 4-7% of the fund account
- Stop loss is 1-3% of the fund account

How to layout in the battle between long and short positionsGold surged directly at the opening, which is in line with our analysis expectations. We gave a short position near 3240-45. As expected, gold fell to the 3230 line for profit. There is great pressure from above and limited space above. Up to now, it has been fluctuating near 3220. For gold, we are now focusing on the short-term support of 3200-06. If it breaks through this position, it is very likely to go to the 3175-90 line.
From the current trend analysis, today's support continues to focus on 3170-80, strong support 3150, and upper pressure 3253-60. Relying on this range as a whole, the main tone of high-altitude low-multiple cycle participation remains unchanged. In the middle position, you must watch more and move less, be cautious in chasing orders, and wait patiently for key points to enter the market. I will notify you of the specific operation strategy in time and pay attention to it in time.
Gold operation strategy: short gold rebound near 3240-50, target 3230-3220. Pay attention to the support of 3202 and 3175 below, and go long according to the strength of the decline!

Gold is rising strongly? Beware of a sharp rise to the high poinThe US sovereign credit rating was downgraded from AAA to Aa1; affected by this, gold opened sharply higher in the Asian market on Monday, and the highest so far is around 3250.
However, 3250 is not the high point at present, and it is only warming up in the Asian market. The important thing should be in the European and American markets. Such a major breaking news must be seen in the US stock market.
If gold can continue to rush above 3250 in the short term, then we will see 3280-3300 later. It is not ruled out that the Asian market will continue to fluctuate sideways in the short term, but I think it will still rise. The high point of 3250 may be broken at any time.
From the 4-hour chart:
This K line is very strong. Once this K line closes above 3230, the highest high point can be seen from the 4-hour chart here.
Judging from the current trend, I think the gold price is bullish as long as it is above 3200 in the Asian market. The lowest price in the Asian market in the morning retreated to around 3210, so it is not known whether it will retreat to around 3200.
Then, for the short-term strategy, you can go long around 3210, with 3200 as the stop loss position. As long as the upper target stands at 3250, you can continue to see the profit range of 3280-3300.

XAU/USD) back up Trand analysis Read The ChaptianSMC Trading point update
Technical analysis for XAU/USD (Gold vs. US Dollar) on the 4-hour timeframe suggests a bullish reversal setup from a key support zone. Here's a breakdown of the idea:
Key Observations:
1. Support Zone (Yellow Box at ~3,100–3,140):
The price recently touched a significant support area marked by multiple previous bounces (green arrows).
The latest green arrow shows a bullish reaction from this zone, indicating potential for an upward move.
2. Resistance Zone (~3,220–3,250):
This intermediate zone is expected to be the first area of interest for bulls.
The analysis suggests a brief pullback or consolidation before continuation.
3. Target Point (~3,375):
The chart outlines a projected move to around 3,375, aligning with a previous supply zone and the upper channel line.
This is likely the main target for a swing trade.
4. EMA 200 (Blue Line - ~3,221):
Price is hovering around the 200 EMA, acting as a dynamic resistance.
A breakout above this would add bullish confirmation.
5. RSI Indicator (~41):
RSI is recovering from an oversold region (~38), indicating potential momentum building for a reversal.
Mr SMC Trading point
---
Conclusion:
This is a bullish reversal setup with:
Entry zone: Around 3,120–3,140
Short-term resistance: ~3,220–3,250
Final target: ~3,375
Invalidation: A clear break and close below the yellow support box (~3,100)
Pales support boost 🚀 analysis follow)

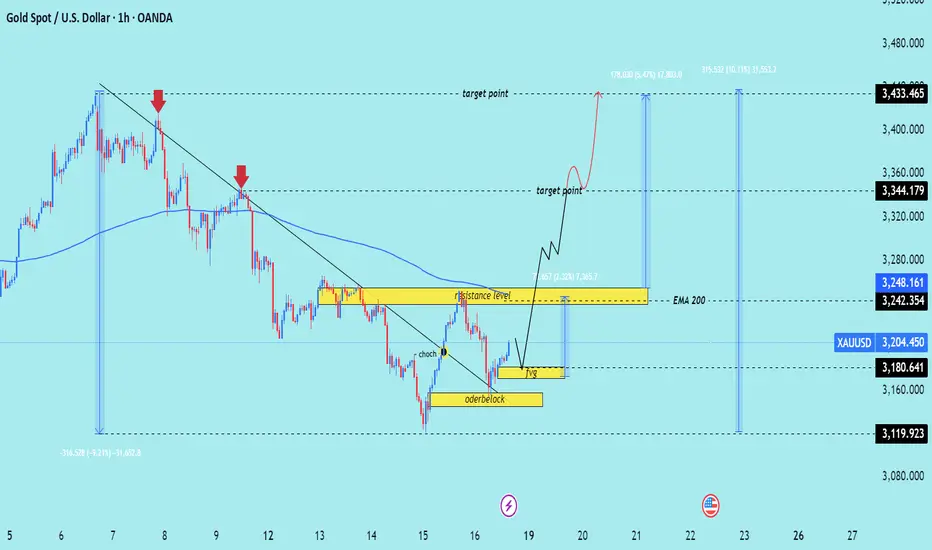
XAU/USD) bullish trend analysis Read The ChaptianSMC trading point update
Technical analysis of XAU/USD (Gold Spot price against USD) on a 1-hour timeframe, featuring a Smart Money Concept (SMC) approach. Here's a breakdown of the key ideas presented:
---
1. Downtrend & Trendline Break
The chart initially shows a downtrend with two red arrows marking lower highs.
A trendline is broken, indicating a potential shift in market structure.
CHOCH (Change of Character) is labeled — a key SMC concept signaling a reversal from bearish to bullish structure.
---
2. Orderblock & FVG (Fair Value Gap)
A bullish orderblock is highlighted, indicating an area where institutional buying may have occurred.
A Fair Value Gap (FVG) is shown, which often acts as a magnet for price to fill inefficiencies before continuing in the intended direction.
---
3. Resistance & Target Zones
A resistance level is marked near 3248–3250, which price may revisit and possibly break.
Two target points are identified:
First target: ~3344
Final target: ~3433
---
4. EMA 200
The EMA 200 is acting as dynamic resistance; a break above it adds confluence to the bullish bias.
---
5. Expected Move
The analysis anticipates:
1. A pullback into the FVG or orderblock.
2. A bullish continuation after mitigating those zones.
3. Price aiming for the resistance and eventually the upper targets.
Mr SMC Trading point
---
Conclusion
This is a bullish outlook based on a structural break (CHOCH), institutional demand (orderblock), and gap-filling logic (FVG). The price is expected to pull back slightly and then rally toward the 3344 and 3433 levels if it holds the orderblock zone.
Pales support boost 🚀 analysis follow)
XAUUSD forecast for this week (19th May 2025)Recent candlestick patterns, coupled with supportive evidence from technical indicators (RSI, ADX, parabolic SAR), underscore that XAUUSD has transitioned into a corrective phase after peaking near $3,500. Major catalysts over the past week—including the U.S.–China 90-day tariff pause, softer U.S. inflation data (CPI, PPI), and strong dollar moves—have eroded safe-haven flows, pushing gold into a short-term descending channel. While Asian physical demand around $3,120–$3,200 provides intermittent support, the likelihood of dipping back into the $3,100–$3,150 zone remains high.
Support & Resistance levels for tomorrow (19th May 2025):
$3,265–3,275 Resistance 2
$3,250 Resistance 1
$3,150–3,160 support 1
$3,120 support 2
I am expecting a continuation of the modest bearish bias into the upcoming Asian session, there is a 60% probability to a bearish continuation and 40% to a bullish rebound. Traders should monitor the $3,150-3160 support area closely—any decisive break below there could open the path toward $3,120 and ultimately $3,000

Moody's downgrades US credit rating, will gold be affected?Information summary:
At about 4:43 pm on Friday (the last minute before the market closed), Moody's downgraded the US sovereign credit rating from AAA to Aa1 on the grounds of "surge in debt and fiscal out of control", ending the US's last "top credit" title among the three major rating agencies.
Perhaps considering reducing the impact, Moody's announced this news after the US stock market closed. But at this time, gold, foreign exchange and other markets still have more than ten minutes of trading time. The 10-year US Treasury yield once rushed from 4.44% to 4.49%, the US dollar index fell, and gold rushed up.
The downgrade is a super-class data, which may cause gold to rebound in stages, but not continuously. If nothing unexpected happens, after the adjustment, gold may continue to retreat in a trend.
Technical analysis:
Next week, gold may rebound in stages to 3330-3340. Then there may be a trend decline again, and I estimate that it may test around 2950 below. As for why it went to 3330-40, here is an analysis:
I think the current gold trend is very similar to the holiday trend in Asia from May 1st to 5th. It also fell sharply, then bottomed out and rebounded, and then stretched up again. I also drew it in the picture, which is basically consistent with the current trend. If the next market trend is copied from the previous paragraph, then I think it should test the 3330-40 point.
