GOLD📊 XAU/USD Weekly Analysis
📅 May 18, 2025
🔍 Key Levels:
▫️ Sell Zone: $3330-3367
▫️ Major Resistance: $3415
▫️ Current Price: $3203
▫️ Target: $2956
⚡️ Scenario:
• Wait for pullback to sell zone
• Sell ONLY with confirmation
⚠️ Warning:
• US rating cut (Moody's) → Potential bullish gap Monday
📌 Risk Management:
• Stop Loss: $3380
• Max Risk: 1% capital
Goldprice

XAUUSD H4 OUTLOOK – “Bounce, Trap or Breakdown?🧠 Market Context:
Gold is consolidating between a major bullish defense zone (3090–3110) and multiple bearish supply layers above. We remain below the last major lower high and within a bearish H4 flow, though macro HTF structure is still bullish. If 3090 fails, the next deeper demand blocks will be critical.
🔁 STRUCTURAL FLOW:
Bias: Bearish ST | Bullish HTF
Trend: Lower highs | Weak demand bounces
Flow: Retesting internal supply | Reaction from demand confirmed
📍 SNIPER ZONES
Type Price Range Description
🔴 Extended Premium Supply 3365–3380 HTF OB + imbalance + wick zone
🔴 Premium Reversal Block 3312–3325 Upper imbalance + internal LH supply
🔴 Mid-Term Supply 3275–3285 May 13 rejection zone
🔴 Internal Trap Supply 3240–3255 Retest of old OB + inefficiency
🟢 Reactive Demand Zone 3160–3172 Internal CHoCH + RSI confluence + bounce base
🟢 HTF Buy Block 3090–3110 Final CHoCH origin + strong rejection
🟢 Deep Discount Demand 3050–3072 Unmitigated WICK OB below liquidity
🟢 FVG-Demand Layer 2980–3000 Weekly imbalance + final LTF liquidity pocket
🟢 Weekly Strong Low Zone 2890–2925 Last major HL before macro expansion
⚠️ Notes:
Above 3325, price would need a strong break in structure to flip bias short-term.
Below 3090, watch for bounce reactions at 3050 or the full discount zone into 2980.
Until then, internal traps are likely during news week flow.
🔥 Follow @GoldFxMinds for sniper updates and market recaps
🧠 Which zone do you expect to be hit first: 3380 or 3050? Drop your thoughts below 👇

XAUUSD DAILY OUTLOOK – MAY 19, 2025“Between Bounce & Breakdown – Watch the Mid-Zone Traps 🎯”
🧠 Market Overview:
Gold bounced last week from the 3160–3172 buy block, confirming demand at discount, but price remains stuck under multiple bearish supply layers.
Until we reclaim structure above 3285, this is still a bearish pullback inside a bullish macro trend.
→ We’re now trading between sniper zones, where volume fades, fakeouts rise, and only confirmation wins.
🔍 STRUCTURE FLOW
🟩 3160–3172 → Confirmed buy zone from last week, clean bounce with CHoCH
🔴 3365–3375 → Daily rejection supply zone, created by imbalance wick & H4 OB
🟧 Price is now inside “mid-trap” territory (3205–3285) = avoid trading blindly
📌 KEY SNIPER ZONES (REFINED)
🔹 Zone Type Price Range Confluences
🟢 Buy Zone 1 3160–3172 OB + EQ liquidity + confirmed CHoCH (D1-H1 confluence)
🟢 Buy Zone 2 3212–3225 Internal FVG + H1 OB origin + 61.8% fib retrace
🔴 Sell Zone 1 3275–3285 Previous H4 OB + bearish NY reaction trap zone
🔴 Sell Zone 2 3312–3324 Internal liquidity sweep + imbalance fill
🔴 Sell Zone 3 3365–3375 Strong rejection + top of H4 imbalance
⚙️ TECHNICAL OUTLOOK:
EMA50/100 now sloping down = bearish short-term tone
RSI near neutral (no divergence = trend-follow only)
Daily candle closed inside mid-zone → no clear momentum = trade only on LTF CHoCH confirmations
🔔 RISK EVENTS (THIS WEEK)
Thu, May 23 → Unemployment Claims + Flash PMIs + Housing Data
Fri, May 24 → New Home Sales + FOMC Financial Stability Report (tentative)
→ Expect fakeouts ahead of these. Stay reactive, not predictive.
🧭 DAILY PLAN
🔽 If price reclaims 3275–3285 and fails → sniper sell entry → TP 3225 / 3172
🔼 If price dips to 3212–3225 with M15 CHoCH → scalp buy to 3260–3270
❌ Avoid entries in 3230–3265 → mid-zone chop trap
🧠 Final Thoughts:
You don’t chase gold in mid-range. You don’t sell bottoms or buy tops.
You wait at the edge of structure — with logic, confluence, and confirmation. That’s sniper mode.
🔥 Like & Follow @GoldFxMinds for intraday sniper plans
💬 Drop your bias below — Break below 3172 or bounce back to 3320?

Gold forecast for next week
Before the fishermen went out to sea, they didn't know where the fish were? But they still chose to go because they believed they would return with a full load. When you invest, you don't know whether you can make a profit, but you still need to try. Success is not something that will happen in the future, but from the moment you choose and decide to do it, you will gain something if you insist on believing. The same is true for gold investment. You may still be losing money at the moment, but as long as you find me, all losses will be solved!
Views on the trend of gold next week!
Gold continued its downward trend on Friday. In the morning, there was another long-short wash and returned to the 3200 mark. The daily line closed with a small negative line. Then we have to consider a problem now, that is, whether the daily line will form a continuous decline. In the daily rhythm, we can see that the position of the high point has been declining, which means that after the top resistance level of the three-point line is blocked, it is easy to form a secondary turning point of the trend downward, which means that next week we still have to look at the retracement.
As for the future market direction, the short-term bearish trend will continue to be the theme! On the whole, the gold price rebounded in 4 hours and made a backtest. If the rebound does not break the resistance, it will continue to fall, and the direction of the decline will continue! After the short turning point turned downward from the high point, the current short trend is still extending downward, that is to say, before the short reaches the key node and the long builds a bottom, the rebound is still the main rhythm!
Gold: Enter short orders near 3212 next week, defend 22, and target 3180-60!

XAUUSD – Weekly Outlook | May 19–23, 2025“Sniper Zones Reloaded – Gold Pullback Season or Just a Tease?”
🔍 Macro View:
Gold just closed a massive -3.6% weekly candle off the top at 3435 — a clear sign of rejection from a premium exhaustion zone. After weeks of uninterrupted bullish madness, we finally have signs of cooling. But is it the start of a deeper correction or just Friday’s fade?
➤ Dollar Strength picked up again after UoM Sentiment miss + sticky inflation expectations.
➤ FOMC minutes (Wed) + Unemployment Claims (Thu) = the potential catalysts for the next impulsive leg.
🔄 Weekly Market Structure:
✅ BOS to the upside still valid – no CHoCH printed yet on W1
📍Current candle printed a clear top wick rejection after liquidity sweep
🕳️ Internal structure on LTFs is bearish – signaling potential deeper pullback
🧭 Key Weekly Zones (Sniper-Ready):
Zone Type Price Range Description
🔻 Supply #1 3435–3465 Premium FVG top + rejection wick
🔻 Supply #2 3285–3320 Imbalance left behind on the last push up
🔻 Sell Zone 3210–3240 Mitigated OB, possible retest
🟩 Buy Zone #1 3095–3120 Weekly FVG + Fibo 38.2 retrace
🟩 Buy Zone #2 2980–3030 Unmitigated demand block, old resistance turned demand
🟩 Buy Zone #3 2850–2890 Weekly CHoCH zone & deep Fibo retrace
📈 Fibonacci Extensions (from last major HL–HH):
FE 100% = 3435 ✅ hit
FE 127% = 3580 (remains next upside target IF retracement holds at key support)
FE 161.8% = 3720 (only if we reclaim 3435 cleanly)
🔺 Weekly Bias:
Short-Term: Bearish pullback (especially early week if no bullish LTF CHoCH)
Mid-Term: Bullish continuation still valid if 3090–3120 holds
🧠 Key Notes:
Expect trap zones and tricky NY opens if no clean confirmation
3210 = likely re-entry point for bears if price retraces
3090–3120 = key defensive line for bulls; invalidation of this = possible slide to 2980
If 3435 gets swept again with strength and closes above → bullish continuation unlocked
🧨 High-Impact Risk Events – This Week
📅 Thu, May 22
📉 Unemployment Claims – 2:30pm
📊 Flash Manufacturing & Services PMI – 3:45pm
🏠 Existing Home Sales – 4:00pm
📅 Fri, May 23
📊 New Home Sales – 4:00pm
📑 FOMC Financial Stability Report (tentative)
📌 Gold Weekly Outlook – “Sniper Zones Reloaded 🔫”
After weeks of pure bullish momentum, gold finally showed signs of exhaustion with a clean weekly rejection from the premium zone.
Is this the start of a real pullback? Or just another fakeout to shake out retail before continuation?
We’ve mapped the structure:
🟥 3435 is the stronghold
🟩 3090 is the battlefield
With Unemployment Claims, PMIs, and housing data lined up this week, expect volatility — but don’t force entries.
Trade light. Stay patient. Let the sniper setup come to you. 🎯
🔥 Like & Follow @GoldFxMinds for sniper-level breakdowns
💬 Drop your bias below — correction or continuation? 👇

XAUUSD MONTHLY OUTLOOK — MAY 2025🕰️ Timeframe: Monthly
📍 Current Price: 3204
📈 Bias: Cautious Bullish-to-Neutral
📏 Trend: Long-term bullish | Near-term exhaustion
🔎 STRUCTURAL OVERVIEW
✅ HTF Break of Structure (BOS) confirmed above 2075 (2020/2022 resistance)
✅ Sustained higher highs + strong impulse candles since Oct 2023
⛔️ Price just wicked into Monthly FIB Extension Zone (1.618–2.0) = 3440–3500
⚠️ Bearish wick formed near 3500, suggesting premium rejection
🧠 KEY TECHNICAL ZONES (Monthly)
Zone Type Price Range Notes
🔼 Premium Supply 3440–3500 Monthly FIB Extension zone + rejection wick + final extension of long-term bull leg
🔼 Resistance 3222–3242 Previous OB and last BOS area before wick spike — possible retest point
⚠️ Mid-Zone 3160–3185 Equilibrium / liquidity trap area seen on H4/D1
🟩 Monthly Demand 2960–3050 Large unmitigated zone + FVG + consolidation base before impulse
🟦 Discount Range 2800–2950 Key reaccumulation blocks from 2023 rallies
🔮 MACRO + MARKET CONTEXT
💬 Geopolitical Tension: Ongoing inflation concerns and Fed credibility under fire after CPI/UoM combo
📉 UoM Sentiment: Dropped below expectations = recessionary anxiety
📊 Inflation Expectations: Came in hotter = market confused, no clean direction
🗣️ Powell speech + May FOMC aftermath = market lacks conviction, stuck in uncertainty
🧭 STRATEGIC SCENARIOS
✅ Bullish Continuation (if retracement holds above 3160–3180)
Potential reentry toward 3240–3250 and re-test upper wick zone >3440
Must see H4 CHoCH + volume confluence
❌ Bearish Retracement (if lower timeframes lose 3160)
Deeper move likely toward 3050–3080 = Monthly demand base
Below that = consolidation back to 2960
⚙️ FIBONACCI EXTENSION
Applied from breakout leg Oct 2023 (Low ~1810 to High ~2222 → projected from pullback at ~1984)
Extension targets:
1.272 = ✅ Reached
1.618 = 3440 = tapped
2.0 = 3500 = wick rejection
We are now reacting inside a fully extended bullish range, which supports a monthly cool-off.
🧠 FINAL WORD
Gold hit the monthly moonshot. Now it’s all about real structure and rotation:
💡 Watch how price respects the 3160–3180 range. Lose that — and we dive back toward 3050–3080.
Hold it — and we reload for the final frontier above 3440.
Gold’s Monthly Jetpack Ran Out of Fuel at 3500 🚀🔥 — Now It’s All About Gravity and Structure."
From FIB extensions to wick rejections, this is not the time to chase... it’s the time to react.
Comment, follow, and stay sharp — sniper mode never sleeps.
— GoldFxMinds (GoldMindsFX)

Gold ended this week successfully!In terms of news, first, the easing of the trade situation weakened the safe-haven property of gold. Secondly, a series of data released this week and the Fed's emphasis on not rushing to cut interest rates also suppressed the gold price. In addition, the parties involved in geopolitical conflicts also began talks. Although there are differences in negotiating positions, they still have to solve the problem when they can sit down and talk. Because of the repeated news, the closing price at the end of the week was also above 3200, so some people still believe that the gold price will go to 3500, and even think that it will exceed this position. I have mentioned this in my previous analysis. The gold price was first stimulated by multiple news and buying rushed up. Now that the risk aversion has receded, I think it is reasonable to see the gold price fall.
Let's analyze it from the technical side: the rhythm of gold has changed rapidly recently, and next Monday is actually the key. The 1-hour moving average of gold has begun to show signs of turning around, so whether it can form a golden cross upwards is the key next time, or it will oscillate a few times and continue to diverge downward. The strength of gold on Monday is very critical. Gold closed with a big positive line on Thursday, which was a very fast trend. However, it fell directly on Tuesday and broke through more than half, so it cannot be said that the bulls are strong. Although it rebounded slightly in the late trading, it still closed with a big negative line. There will be two key positions on Monday next week. Pay attention to 3180 on the bottom of gold. If it falls below 3180 soon after the opening on Monday, then gold will still be weak as a whole. Pay attention to 3215 on the top. If gold breaks through 3215, then gold will be strong as a whole. If gold opens flat on Monday and the upward momentum is not strong, and it is under pressure at 3215, then you can continue to go short in the short term.
TVC:GOLD OANDA:XAUUSD FOREXCOM:XAUUSD

Gold Price Analysis and OutlookOver the past week, the global gold market experienced its steepest correction since last November. Investor sentiment shifted sharply, sending gold prices (XAU/USD) into a freefall and erasing most of the gains accumulated in previous weeks.
📉 Gold Price Movements
- Gold ended the week at around $3,201 per ounce, plunging nearly $122 compared to the previous week — marking the largest weekly drop in six months.
- The decline came as global markets pivoted toward riskier assets following a trade agreement between the U.S. and China, which brought renewed optimism to investors.
- The easing of geopolitical tensions, along with expectations that interest rates will remain steady or rise slightly, led to a waning demand for gold as a traditional safe-haven asset.
🔮 Outlook: Temporary Correction or Start of a Bearish Trend?
- Despite the sharp decline, many experts believe this may only be a technical correction, driven by profit-taking after a strong upward rally in recent weeks.
- Factors such as persistent inflation, rising global debt, and underlying macroeconomic uncertainties continue to support gold’s role as a hedge in investment portfolios.
- In the short term, the gold market will remain sensitive to policy signals from the U.S. Federal Reserve and volatility in the bond market.
🧭 Conclusion
Gold has just endured its worst week in half a year, but that doesn’t necessarily signal the end of its long-term bullish trend. For cautious, long-term investors, the current correction phase could present a valuable opportunity to reposition portfolios at more attractive price levels.

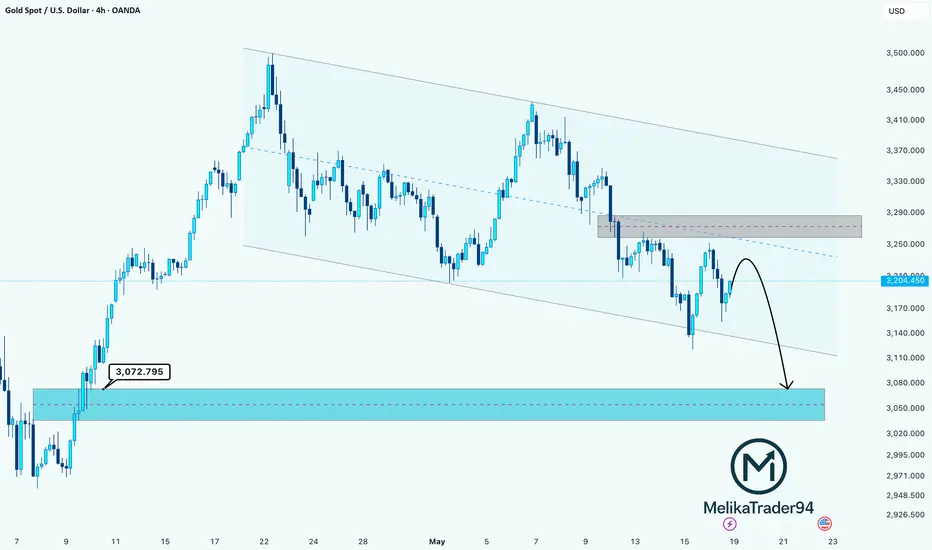
GOLD (XAU/USD) Bearish Play Setting UpHello guys!
Gold is currently respecting a bearish descending channel, forming clean lower highs and lows. After tapping into the supply zone around 3,285–3,295, the price is showing signs of exhaustion.
Now, a potential rejection from this zone could trigger another leg down targeting the demand zone around 3,060–3,080.
🧠 What I see:
🔹 Bearish channel = trending lower
🔹 Clean retest of supply block
🔹 Price respecting midline resistance
🔹 Momentum favors sellers
🎯 Bearish Trade Idea (Not financial advice):
Entry zone: 3,240–3,260 (on confirmation candle)
TP1: 3,110
TP2: 3,072 (demand zone)
📐 Risk/Reward: 1:2+ potential
💡 Watch for confirmation candlesticks near the supply zone for safer entries.
GOLD MARKET OVERVIEW – WEEKLY SUMMARY 📉 Key Developments
• Gold price (XAU/USD) dropped from a weekly high of $3,252 to a low of $3,154, indicating strong selling pressure.
• U.S. bond yields have edged higher, making gold less attractive to investors.
• Recent inflation data suggests the Federal Reserve may maintain higher interest rates for longer, adding downward pressure on gold.
• Profit-taking has intensified following a strong rally in previous weeks when gold hit multiple all-time highs.
🔮 Expected Short-Term Scenario
• Market sentiment leans towards profit-taking, especially since the $3,200–$3,250 zone has failed to hold.
• The inability to sustain higher levels indicates weakening buying momentum, increasing the likelihood of a deeper correction.
• Over the past week, gold formed strong bearish candles and repeatedly tested the $3,150 support zone, signaling that this level is weakening and could be broken soon.
📉 Conclusion & Outlook for Next Week
Based on:
• Weak price behavior
• Negative technical indicators
• Profit-taking sentiment
• Bearish macroeconomic backdrop
→ The scenario of breaking below $3,150 support and continuing downward toward $3,100 or lower is highly plausible in the coming week.
📌 SHORT-TERM TRADING STRATEGIES
🔻 SELL
• Entry Zone (SELL): 3245 – 3248
• Take Profit (TP): 3235 – 3238
• Stop Loss (SL): 3253
🔼 BUY
• Entry Zone (BUY): 3120 – 3123
• Take Profit (TP): 3133 – 3135
• Stop Loss (SL): 3116
🔁 Note: Only enter trades based on clear confirmation signals. Manage risk carefully — limit exposure to no more than 1–2% of your account per trade.

Gold fluctuates greatly. What will happen next week?Gold fluctuated greatly on Thursday and Friday. It is difficult to implement an operation strategy in this market. It is difficult to go short or long. The market does not continue the next day, and there are few suitable trading opportunities in the process of changing the market. So what should gold do next week? Has the rhythm of gold changed again?
The rhythm of gold has changed rapidly recently, and next Monday is actually the key; the 1-hour moving average of gold has begun to show signs of turning, so whether it can form an upward trend is the next key.
The strength of gold on Monday is very important. Gold closed with a big positive line on Thursday, but it fell directly on Tuesday and pierced the support level, which cannot be said to be completely bullish. Although it rebounded slightly in the late trading, it still closed with a real big negative line.
Next week, we need to pay attention to two key positions. Pay attention to $3175 below. If it falls and breaks quickly after the opening on Monday, then gold will still be weak overall; pay attention to $3215 above. If gold breaks through this point strongly and stabilizes above the point, then gold will be strong overall.
If gold opens flat in early trading on Monday and the upward momentum is not strong, then you can continue to short in the short term.

Gold still has room to fall and rebounds to continue to shortGold fell as expected in the Asian session, which was in line with our thinking and expectations. Our short position was shorted near 3237-38 and exited with profit, and then shorted near 3194 and exited with profit again, and we made good profits both times. There are many people who followed the trend and went long in today's market, or even chased the long position, and without exception, they were trapped and wailing. We have repeatedly emphasized that we should treat it with a sweeping approach, and different market rhythms should be responded to with different methods. Judging from the current market trend, the European session continues to weaken. The focus should be on the gains and losses of 3180 support. If it breaks through, it will continue to look at 3150 and 3120. In this case, the short-term will return to weakness. If it does not break, we will look at a wide sweeping range. The upper pressure will focus on 3200, 3215, and 3230. The rebound will be mainly high. The weekly line will be closed tonight, and volatility will intensify.

GOLD DAILY CHART ROUTE MAP UPDATEHey Everyone,
This daily chart idea played out exactly as analysed. The channel top provided strong resistance, with EMA5 failing to cross and lock outside the channel confirming the rejection.
Price then moved down to the channel half line, which, as we anticipated, held firmly as support and delivered the expected bounce. This move aligned perfectly with our plan to buy dips, demonstrating once again the precision of the Goldturn channel methodology.
This is the beauty of our Goldturn channels, drawn using weighted averages instead of pure price action. This unique approach helps us clearly identify fake-outs and real breakouts, cutting out much of the noise that usually confuses traders.
We will now come back Sunday with our updated Multi time-frame analysis, Gold route map and trading plans for the week ahead.
Have a smashing weekend!! And once again, thank you all for your likes, comments and follows, we really appreciate it!
Mr Gold
GoldViewFX

Gold: Entering a long position on gold (long-term ). R/R: 1:5
Hello everyone,
This is not a scalp position — you’ll need to hold it for a few days, possibly longer. However, the risk-to-reward ratio is reasonable.
Please note: maximum risk is 1%.
Gold Free fall to 3080/3050 ?Gold just broke the channel.
I expect a rapid decline the following hours to 3080 and if that breaks, 3050

Gold Price Analysis May 16Yesterday's D1 candle pulled back within the uptrend with a liquidity sweep to 3121. Today there is unlikely to be a sell-off and the price will continue to return in the uptrend.
Today, it is better to mainly look for retest points for BUY signals.
In the immediate future, 3198 is the first BUY zone that the Asia-Europe session can consider. When breaking this zone, buy entries may not carry long TP expectations. The Breakout zone of 3153 and the bottom zone of 3125 are two important supports to prevent the gold price from a downward slide.
In the opposite direction, the Asian session resistance zone around 3254 also acts as an immediate barrier for the gold price increase. Break 3254 should not BUY until the 3288 zone before SELL Scalping can be done. The upper barrier of the Daily Frame is at 3320.

Perfectly hold the pullback and continue to buy.Gold opened at around 3240 and then rushed to 3252 and then retreated. In the evening, we also gave a short position near the rebound to 3240. After all, there is a lot of pressure from above, and the technical side also needs to repair the strategy, so we gave a short position entry near 3237-38, and the target is 3215. As of the retracement, it reached the lowest point near 3206, which also successfully reached our target position. Today's Asian session high and retreat is completely a technical adjustment. It bottomed out and rebounded yesterday, with an increase of more than one hundred US dollars. The technical bulls are weak and need to pull back. This is why I gave the short position. Be a steady trader.
The gold market showed a V-shaped reversal pattern of bottoming out and rebounding yesterday. The daily line closed with a hammer-shaped positive line with an extremely long lower shadow, indicating that the support below is strong, but the overall high-level oscillation pattern is still maintained. Technical indicators show that short-term correction pressure still exists: the stochastic indicator is blunted at a high level, the MACD double-line dead cross is downward, and the Bollinger band opens downward. The gold price is likely to fluctuate around the middle and lower tracks.
The 4-hour level oscillates to the short side, and the 3200 line becomes the watershed between long and short. If it effectively falls below this level, the shorts will regain the initiative; on the contrary, the longs need to break through the strong resistance area of 3265-3270 to reverse the decline. At the close of the weekly line, the market has a demand for a restorative decline. If it falls below the 3200 integer mark, the target below will look at the 3180-3170 area. Focus on the effectiveness of the 3265-3270 resistance and the strength of the 3200 support, and be alert to the violent fluctuations in the closing market on Friday.
Gold recommendation: Go long when it falls back to around 3215-3205. Target 3230-40-50 first line

Gold-----Buy near 3170-3180, target 3200-3230Gold market analysis:
Recently, gold trading has been very fierce. Yesterday, there was a sharp drop and then a sharp rise, with a range of 200 points. This range is rare in history. We have said many times before that the fluctuation rhythm of gold this year is the largest in history. Before, it fluctuated by 200 points in a month, and now it can fluctuate by 200 points in a day. The market is ever-changing. In such a market, ordinary investors need to take losses. Only if you take losses, it means you have made a mistake. At most, you can get out. Don't increase the bet repeatedly, which will make you die very quickly. Don't fight against the market. It is always right and you are always wrong. Today's idea is that we estimate that gold will be repaired. The possibility of continuing to rise in the Asian session is gone. It rose too much yesterday. Today, it needs a repair and daily adjustment. The estimated adjustment range of the Asian session is 3192-3252, and the central axis position is around 3227. Note that the market has been sold yesterday.
In the European and American markets, we focus on the two long opportunities at 3155 and 3175. If the middle axis does not go back, you can short short. Now the rhythm is the most important. The above analysis chart shows that it is already in a V-shaped pattern. Short-term conversion to buy. If it breaks 3155, be careful that it will be washed again. The repair market can be bought and sold today. The important rhythm issue is.
Fundamental analysis:
Recently, there are a lot of fundamentals, but there are relatively few data. The impact on the market is also very large. The Sino-US trade negotiations, the Russian-Ukrainian negotiations, and the India-Pakistan ceasefire have all affected the market.
Operational suggestions
Gold-----Buy near 3170-3180, target 3200-3230

XAU/USD(20250516) Today's AnalysisMarket news:
Fed Chairman Powell: The Fed is adjusting its overall policy-making framework. Zero interest rate is no longer a basic situation. The wording of underemployment and average inflation rate needs to be reconsidered. PCE is expected to drop to 2.2% in April.
Technical analysis:
Today's buying and selling boundaries:
3200
Support and resistance levels:
3318
3274
3245
3154
3125
3081
Trading strategy:
If the price breaks through 3245, consider buying, the first target price is 3274
If the price breaks through 3200, consider selling, the first target price is 3154

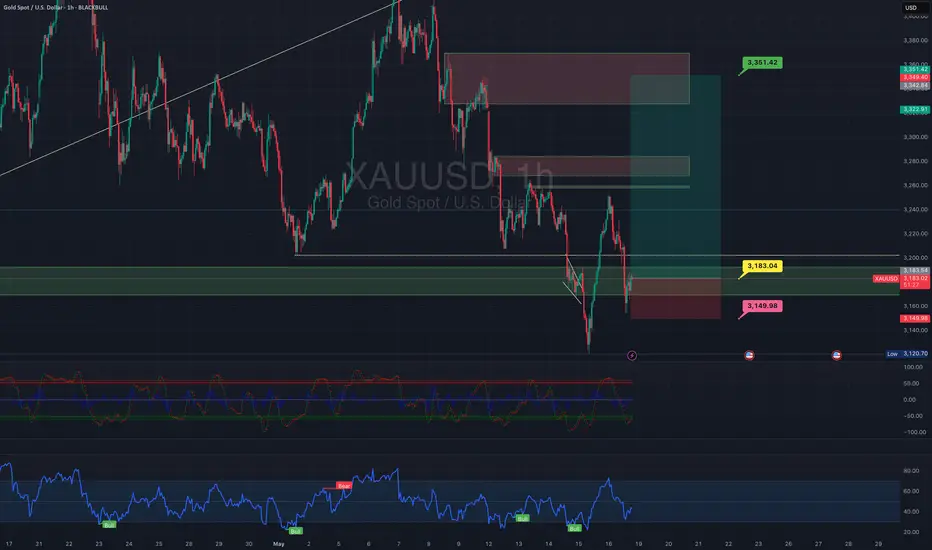
GOLD Update – Short Opportunity After Pullback! Gold traders! 💛 Our key support zone (3,212 - 3,196) has just been broken, and price is now consolidating below! 🎯
We previously took big profits from this level (our followers know!), and now we’re waiting for a pullback to enter a high-probability short trade!
⚡️ Golden Rule:
✅ If price retests the level as new resistance, go SHORT!
✅ If it reverses and breaks back above, consider a LONG!
📌 Always trade with a strategy—be ready for any scenario!
💸 The Secret to Trading Success:
🔹 Keep losses small & controlled.
🔹 Let profits run & grow!
🔹 We can’t control the market, but we CAN control our risk!
🚀 Gold is always hot—what’s your take?
👇 What’s your analysis on this move?
For detailed entry points, trade management, and high-probability setups, follow the channel:
ForexCSP

XAU/USD 16 May 2025 Intraday AnalysisH4 Analysis:
-> Swing: Bullish.
-> Internal: Bullish.
Analysis and bias remains the same as analysis dated 23 April 2025
Price has now printed a bearish CHoCH according to my analysis yesterday.
Price is now trading within an established internal range.
Intraday Expectation:
Price to trade down to either discount of internal 50% EQ, or H4 demand zone before targeting weak internal high priced at 3,500.200.
Note:
The Federal Reserve’s sustained dovish stance, coupled with ongoing geopolitical uncertainties, is likely to prolong heightened volatility in the gold market. Given this elevated risk environment, traders should exercise caution and recalibrate risk management strategies to navigate potential price fluctuations effectively.
Additionally, gold pricing remains sensitive to broader macroeconomic developments, including policy decisions under President Trump. Shifts in geopolitical strategy and economic directives could further amplify uncertainty, contributing to market repricing dynamics.
H4 Chart:
M15 Analysis:
-> Swing: Bullish.
-> Internal: Bearish.
Analysis and bias remains the same as yesterday's analysis dated 15 May 2025.
In my analysis from 12 May 2025, I noted that price had yet to target the weak internal high, including on the H4 timeframe. This aligns with the ongoing corrective bearish pullback across higher timeframes, so a bearish internal Break of Structure (iBOS) was a likely outcome.
As anticipated, price targeted strong internal low, confirming a bearish iBOS.
While a bullish Change of Character (CHoCH) has printed, I am exercising discretion and not marking it as such, given the shallow nature of the pullback.
Additionally, another bullish CHoCH has printed, with price now trading within a defined internal range. I will continue monitoring this closely, particularly in relation to the depth of pullback.
Intraday Expectation:
Price to continue bullish, react at either premium of internal 50% EQ or M15 demand level before targeting weak internal low priced at 3,120.765
Note:
Gold remains highly volatile amid the Federal Reserve's continued dovish stance and persistent geopolitical uncertainties. Traders should implement robust risk management strategies and remain vigilant, as price swings may become more pronounced in this elevated volatility environment.
Additionally, President Trump’s recent tariff announcements are expected to further amplify market turbulence, potentially triggering sharp price fluctuations and whipsaws.
M15 Chart:

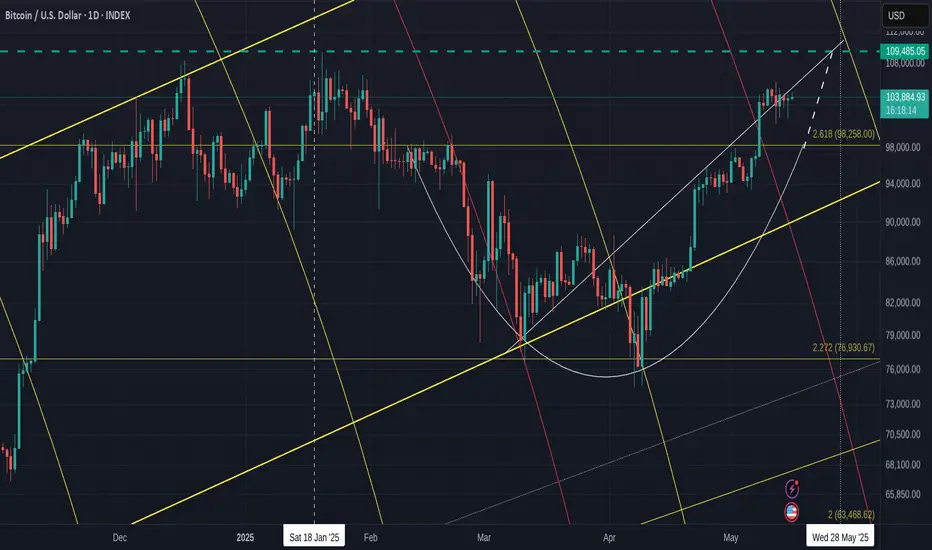
Comprehensive BITCOIN Analysis for the next 7 days - DAILY chart
First Off - Sorry for all the lines on the chart but EVERY one is very relevant to what is happening right now.
The Dashed Blue Horizontal line is the current ATH line. possible Resistance.
The 2.618 Fib extension has not yet been tested as support. This could happen still, at any point till end of month and is around the 98K usd zone.
PA has Ranged through the Local rising line of support, as if it no longer existed, which was a little surprising given the strength that PA has still. There maybe some uncertainty in the air.
PA is above the neckline of the Cup pattern it printed and, again, it would not be unusual to see PA come back down to test this Neckline as support, which is on that 2.618 Fib extension.
The Bold Yellow line is Long Term Support line since 2015, showing that Bitcoin PA is in the Lower side of a Long Term ascending channel, with plenty of room to rise,
PA has a lot of inert strength right now, so, we may not see this retest happen.
We just have to wait.
BUT you can see that Rising dashed line, the extension of the Cup pattern.
PA may range across into this and bump into it next week. If it acts as support again, PA will then be pushed into a tight Squeeze against the other rising line of support, with an Apex on the current ATH line.
PA ALWAYS REACTS BEFORE THE APEX
All that points towards some Volatile times next week if PA remains in this area.
The other descending line there is a 618 Fib Circle. You can see that 98% of the Time, PA is effected by these.
All this shows us 4 points of resistance, in the same Zone, All Next week and PA will Either Shoot through it with a Big push, Or we may see PA Drop back down. The Big question being, how Far ?
We do not want to loose the 2.618 Fib ext at 98K
But what else can we look at. ?
The RSI DAILY
This is still up high in the near Over Bought zone. It can range up here for extended periods but this is something we should be aware of as the possibility of a drop does exist.
On the weekly, RSI has room to move higher & the 4 hour is in neutral zone, again with ability to push higher.
The MACD DAILY
This is once again curling over and about to test the red signal line as support.
On a 4 hour chart, the MACD is down on Neutral line, giving it strength to push higher and if that continues, we will see the yellow MACD line bounce off the Red signal line on the Daily chart.
Once again, Look at the Histogram and the similarity to the area that the Arrow is pointing at.
We could repeat this but on a larger scale. We have to wait and see if this happens.
But also note how there was a Visit into a red Histogram ( for 4 days ) before the bigger push and I remind you about what has been said above.
So, what else can we look at that may offer some ideas ?
The Chart below is the 4 main Crypto Dominance charts by market Cap - 4 hour
BTC.D - ETH.D
OTHERS.D - USDT.D
( OTHERS = Top 125 Coins MINUS Top 10 by Market Cap) Mid to Low cap
We have recently seen a Drop in Bitcoin dominance, giving the ALTS some time to push higher. This is seen with the BTC.D dropping and the ETH.D and OTHERS.D rising
Also note how USDT.D Dropped, showing that stable coins were being exchanged for Crypto,
And as we see now, we have the possibility of BTC.D being rejected by its 50 SMA ( Red)
ETH.D is above its 50 SMA, showing it had a good push and may get support if PA drops
OTHERS.D has already fallen below its 50 SMA, showing a brutal sell off, rapid profit taking.
That is the world of ALTS.
In the last 48 hours, we saw a return for Bitcoin as it rose from a shallow Low in its Range. This was enough to cause a sell off of the ALT coins as we see in the Drop in Others.D
ETH however, remains in a range with obvious intention to continue higher if the market allows.
Lastly, we can compare Bitcoin to the other Markets
Bitcoin - CFD GOLD
DXY - S&P500
Bitcoin has performed well. It has reclaimed some position on Gold recently while it climbed alongside the S&P
We can also see how BTC climbed while DXY dropped.
This highlights some Flaws in using the BTC USD pair to judge the success of BTC but this is explaned better in another post. But in short, If the $ looses Value and your BTC USD pair appears to climb, theg ain is lost as the $ is worth less.
Use BTC XAUT pairs. Bitcoin Gold Pair - Historically, GOLD looses little Value by comparison. So when Bitcoin gains against Gold..It is WIN WIN
So, in conclusion, we see Bitcoin under some pressure to avoid Lower or sharper Drop in the short tern.
The Lower Timeframes show us that BTC has the ability for a Continued Range but with caution.
We see ETH ( and larger Alts ) intent on remain in the game now they have had a small glimpse of Gains
And we see that Mid and Lower Cap Alts are mostly just money makers providing you play the game right. And that game may have some more time if Bitcoin Stumbles in the next 7 days.
And that possibility does exist.
Today is crucial in many ways and will set the tone for the following week.
There is Financial Data being released by the USA today and if unfavourable, we may see some sharp moves.
And ,Longer Term VERY BULLISH - I HOLD AND CONTINUE TO BUY WHEN I CAN ON SPOT ORDERS
I hope this helps and I am grateful for comments
Gold has a strong deep V, 3200 support is good for longThe 1-hour moving average of gold begins to turn and continue, so the momentum of gold bears begins to weaken, and gold bulls may begin to exert their strength. However, gold started to rise all the way from 3120 to 3252 yesterday. Gold rose by about 130 points, so the volatility began to increase. Therefore, we must wait patiently for gold to adjust. Because of such a large fluctuation, an adjustment will also be tens of dollars. We must wait patiently for the adjustment and stabilize before going long. After gold breaks through 3192, it is considered a strong deep V breakthrough of important resistance. Then 3192 of gold has now become an important support level. If it falls back to 3192 in the Asian session, go long on dips. If gold falls back to near the 3200 mark, you can try to go long.
Since gold has started to reverse strongly, gold bulls have begun to show their muscles. In the short term, we should not be stubbornly bearish anymore. We should be flexible and adapt to the market. The market is like this, changing rapidly. We should adapt to the market and not be too obsessed with bears or bulls. Obsession is a trap. Gold bulls are strong now, so gold is now the home of bulls. Go long when the Asian session falls back.
