Gold falls below 3200, continues to look at 3100
📌 Driving factors
As Sino-US trade tensions ease, market concerns about a global recession ease, investors' risk appetite rises, and gold's attractiveness as a safe-haven asset declines, gold prices fell on Wednesday (May 14). After the tariff truce announced over the weekend, the stock market rose sharply, weakening gold's safe-haven appeal in the short term, which was an important factor that pushed gold prices to new highs in the previous few months, and it is also the starting point for the current large-scale selling!
📊Commentary Analysis
The price trend of gold on Tuesday showed a significant repeated shock feature. Although it ended up rising, it experienced two tortuous processes of first falling and then rising in the process, which led to a relatively limited overall increase. After the previous day's correction, the current 5-day moving average and the 10-day moving average formed a dead cross and continued to extend downward. From the perspective of intraday trading, the resistance level formed by these two moving averages has become the focus of market attention.
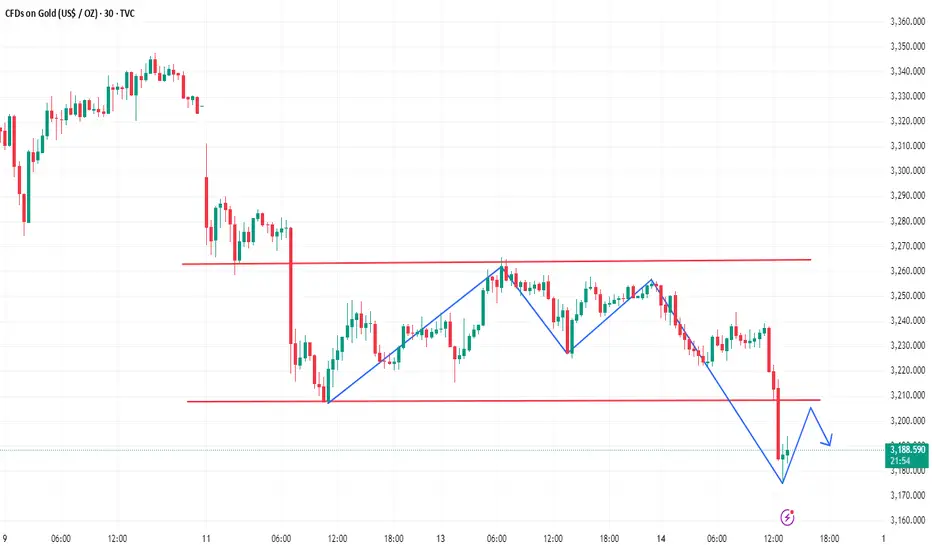
In the morning article, I repeatedly emphasized that gold is expected to break below 3200. Sure enough, it broke below without hesitation today. It is currently at 3185. The short position of gold near 3250 that we gave yesterday has expanded its profit again today, and it is easy to make a profit of nearly 100 points. Today, the US market operation is still mainly shorting, and it can continue to short near the rebound of 3200.
💰Strategy Package
Today, the US market operation is still mainly shorting, and it can continue to short near the rebound of 3200, with the target near 3170-3180.
Labaron believes
Guaranteeing the principal is the bottom line for survival, controlling risks is the armor for survival, earning income is a staged medal, and long-term stable and continuous profit is the only proof that it can finally stand up from the mountains of corpses and seas of blood.
Goldprice

Short-Term Outlook: Gold Slumps After Breaking Key Support📉 Short-Term Trend Analysis – XAU/USD
- Gold (XAU/USD) is under heavy selling pressure after decisively breaking below the key support level at $3,200, marking a significant shift in short-term momentum.
- The $3,176 zone, which marks the April 11 low, now serves as a crucial technical support. A clear break below this level could open the door for a deeper drop toward the next key support around $3,140.
If the $3,176 level fails to hold and bearish momentum continues, the market is likely to push lower toward the $3,140 support zone.
📰 Fundamental Drivers Behind the Decline
No major news has been released today, but the market continues to be weighed down by:
- Ongoing U.S.-China trade tensions, which remain unresolved.
- U.S. CPI data for April came in weaker than expected, causing investors to adjust interest rate expectations and favoring short-term downside for gold.
🔮 Short-Term Technical Scenario
After breaching the $3,200 support level, gold is expected to consolidate briefly in the $3,176–$3,190 range before potentially resuming its downtrend.
💡 Short-Term XAU/USD Trade Setups
🔻 SELL
Entry Zone: 3193 – 3190
Take Profit: 3188 – 3185
Stop Loss: 3198
🔺 BUY
Entry Zone: 3179 – 3176
Take Profit: 3184 – 3181
Stop Loss: 3171
📌 Note:
In the current market environment, short-term strategies are preferred.
Apply strict risk management as volatility may increase due to geopolitical headlines or technical retracements.
Closely monitor price action around $3,176 — a confirmed break below this level could accelerate the move toward $3,140.

Can we continue to bet against gold?My article today emphasized that gold may fall below 3200. Sure enough, it did so without hesitation today and fell to around 3175 in the short term. At present, gold has rebounded, and the short-term pressure is around 3200, so you can short at this position.
In the short term, focus on the support near 3160 below. If it falls below, there is still room for gold to fall.
Gold's consolidation is over and bears will break 3200!Gold market analysis:
Short-term gold has entered a repair period. The previous tariff negotiations led to a sharp drop in gold. It has now fallen to around 3200 and is stuck. The shape and indicators show that 3200 is a super support. This position is greatly beneficial for selling on the weekly and daily lines. Yesterday, the daily cross star, the overall trend is still empty, the short-term repair range is 3265-3220. If you want to grasp the trend trading, sell at a high price and arrange the selling order. Lao Gu believes that the possibility of continuing to fall after the shock is over is greater, and it will break 3200 later. The daily moving average indicator is also broken. The gold fluctuation rhythm is very large, that is, a technical rebound and repair are basically dozens of points. It is most important for us to grasp the rhythm in operation. Today's idea can rely on the upper edge pressure of the shock to sell.
If the Asian session rebounds around 3256 first, consider selling it first. There are opportunities for buying and selling in the volatile market. What we need is patience and waiting. In addition, the daily moving average begins to rush down, and selling begins to move. If it breaks 3200, we will consider selling. We must learn to follow the recent market. We rarely follow it before, because the recent gold will not turn back when it falls or rises, and the speed of buying and selling is also very fast. It is very important to control the rhythm.
Support 3220, 3207, strong support 3200, pressure 3244, 3256, 3265, the watershed of strength and weakness of the market is 3230.
Operation suggestion
Gold-----short around 3256, target 3150-3200

Gold starts a downward trend? Latest strategy.News focus:
Today, Fed official Waller will give a speech;
Tomorrow, the number of initial jobless claims, producer price index (PPI) and retail sales data will be released;
On Friday, the market will usher in the University of Michigan Consumer Confidence Index report.
Technical analysis:
Gold fell rapidly in the Asian market, then rebounded slightly, and has been in a sideways trend.
I think the recent volatility is more obvious, and there is still uncertainty whether the direction will be quickly completed.
There are large differences in the current price of the short strategy, and it is impossible to make a decisive breakthrough in the short term.
Operation strategy:
Still adhere to the expectation of short-term decline, the rebound will not hinder the final decline expectation, and the strategy of shorting at high points will be maintained in the short term.
You need to pay attention to the key support level of $3160. If the downward trend opens this position, the gold price may test the low position of 3100.

Gold has now fallen by 3200, and the next support level is 3160
📌 Driving factors
As Sino-US trade tensions ease, market concerns about a global recession have eased, investor risk appetite has increased, and the attractiveness of gold as a safe-haven asset has declined, and gold prices fell on Wednesday (May 14). After the tariff truce announced over the weekend, the stock market rose sharply, weakening the safe-haven appeal of gold in the short term, which was an important factor that pushed gold prices to new highs in the previous few months, and it is also the starting point for the current large number of sell-offs!
Driven by bargain hunting, gold prices rebounded on Tuesday, and the weaker-than-expected US inflation data released that day also helped gold prices rise. However, trade optimism limits the strength of gold's rebound.
📊Commentary Analysis
Gold began to fall in the early trading of the US market and is about to fall to our expected point. The support below is 3160!
💰Strategy Package
🔥Selling Gold Area: 3245-3240 SL 3250
TP1: $3230
TP2: $3210
TP3: $3190
🔥Buying Gold Area: $3167-$3165 SL $3160
TP1: $3178
TP2: $3189
TP3: $3200!
Labaron believes
Guaranteeing the principal is the bottom line for survival, controlling risks is the armor for survival, earning profits is a stage medal, and long-term stable and continuous profits are the only proof of being able to stand up from the mountains of corpses and seas of blood.

XAUUSD H4 Outlook – Monday, May 12, 2025Short-Term Bias: Bullish retracement toward premium zones
Structure: CHoCH confirmed at 3284 → forming potential bullish leg inside retracement
🔍 Recent Price Action (H4 Insight):
Clear CHoCH on H4 above 3292 → short-term structure flipped bullish.
Last impulsive leg pushed price into the 3330–3345 zone before rejecting slightly — signs of near-term resistance.
EMA5 and EMA21 are crossing upward, with price trying to retest EMA21 for a bounce.
Next H4 candle closure is critical — either holds 3290 for continuation or re-tests deeper zone.
📌 Key H4 Zones
Zone / Level Description
3380–3395 🔺 H4 FVG + OB zone – major near-term premium resistance (also Daily level)
3340–3345 🔁 H4 internal resistance – Friday top, low-volume gap area
3314–3318 🔁 Micro H4 imbalance – intraday fill zone
3284–3292 ✅ H4 CHoCH + OB – current bullish base, critical to hold
3250–3265 🔵 Deep demand – final intraday bounce zone before HTF demand
These levels will be your H4 battle zones — where price is likely to bounce, reverse, or accelerate depending on confirmation.
🔁 Potential Flow on Monday:
Bullish scenario:
If price holds 3284–3292 → intraday targets = 3318 → 3340 → 3380.
Clean structure = higher low + EMA support confluence.
Bearish scenario:
If price loses 3284 → could test 3250–3265. Only below this would invalidate current H4 bullish flow.
⚠️ Confluence Check:
EMAs: EMA5 crossing up through EMA21 → short-term bullish momentum building
Liquidity: Buy-side above 3345 → price may attempt sweep if supported
FVGs: Still unfilled gaps between 3314 and 3380 → magnet zones for bullish flow
CHoCH: Valid on 3284 → first HL attempt happening now
🧠 H4 Summary (for May 12):
Type Zone Reaction Potential
Resistance 3380–3395 Strong rejection possible
3340–3345 May slow price if volume weak
Support 3284–3292 Critical bullish structure zone
3250–3265 Breaker block zone (last bounce before HTF demand)
💬 Final Word to the Community:
Gold may have paused its moon mission at 3500, but the engines are refueling. Monday’s battle will be all about 3284 — hold it, and bulls might just take flight toward 3380. Lose it, and we buckle in for a deeper dip.
🟡 Whether you’re team buy-the-dip or wait-for-the-fade… stay sharp, stay patient, and always follow structure.
Like what you see? Drop a comment, tag a gold friend, and follow GoldFxMinds to never miss the real flow. 🧠⚡

Focus on 3200 for some support during the day🗞News side:
1. Sino-US tariffs have been eased
2. U.S. trade progress and focus on geopolitical risks
📈Technical aspects:
Yesterday we gave a long trading strategy and have been waiting to see whether the gold price can touch our target point of 3270. However, gold did not fluctuate much after the opening of the Asian market, so I chose to manually close the position near 3256.
To be honest, the market did not fluctuate much today whether it was up or down, and it is still consolidating within our box range of 3220-3265. Although gold is generally weak, it has a higher probability of strengthening during the day, and the early gap may be ready for market recovery. At present, the gold price has tested the 3240 line many times. If it cannot stand above 3240, it may test the strong support of 3200 again. If there is no breakthrough below the strong 3200 support, the market may repeat
If you agree with this view, or have a better idea, please leave a message in the comment area. I look forward to hearing different voices.
FOREXCOM:XAUUSD FXOPEN:XAUUSD TVC:GOLD FX:XAUUSD OANDA:XAUUSD

Start buying gold and wait for a rebound.At the 4-hour level, the overall market judgment remains unchanged. In terms of the lower support level, 3208-3207 is the key support area. This position is not only the low point on Monday, but also an important support level formed by the previous starting point line extending to the present. As for the upper resistance level, first of all, we need to focus on yesterday's high point of 3265, which is also the previous shock low point. Secondly, the 3290-3293 area formed by the rebound after the gap-down opening on Monday is also a resistance range that cannot be ignored. In the short term, pay attention to the resistance line of 3260-3270 above, and pay attention to the support line of 3220-3210 below in the short term. Further support focuses on the 3200 mark.
Gold operation strategy: 3220-3210 long, target 3230-3250; gold rebounds to 3260-3265 short, target 3240-3220.

[XAU/USD Analysis – 1H Timeframe] - as expectedAs predicted in the previous post, gold (XAU/USD) reacted precisely at the 3243 resistance zone — a strong supply area where our short-term SELL setup was triggered. Price then reversed and moved downward as expected.
At the moment, the trade plan remains unchanged. You can refer to the detailed setup in my previous post on my personal page. Here's the updated short-term strategy
💡 Short-Term Trade Scenarios:
SELL XAU/USD
📍 Entry Zone: 3240 – 3243
💰 Take Profit: 3235 – 3238
🚨 Stop Loss: 3245
BUY XAU/USD
📍 Entry Zone: 3219 – 3222
💰 Take Profit: 3224 – 3227
🚨 Stop Loss: 3214
The market is currently trading within a narrow range, so the short-term strategy is to “buy low – sell high” within this zone, with tight risk management. A clear breakout beyond 3245 or 3214 may require a reassessment of the trading strategy based on momentum and volume.
⏳ Note: This is a short-term analysis based on the 1H timeframe and is not intended for overnight holding unless supported by a clear setup.

Gold continues to trade sideways above the 3200 area
📌 Driving factors
The United States and China announced on Monday a 90-day suspension of tariff increases. According to statements made after the Geneva talks last weekend, the United States will reduce tariffs on Chinese imports from 145% to 30%, while China will reduce tariffs on US imports from 125% to 10%.
Meanwhile, on the geopolitical front, Russia and Ukraine are preparing for their first high-level face-to-face talks since 2022, scheduled to take place in Istanbul this week. The talks come as the international community is increasingly pressuring Moscow to accept a 30-day ceasefire. U.S. Secretary of State Marco Rubio and special envoys Steve Witkov and Keith Kellogg are expected to represent the United States in the talks.
Gold prices rebounded on Tuesday, driven by bargain hunting, while weaker-than-expected U.S. inflation data released that day also helped gold prices rise. However, trade optimism limited the strength of gold's rebound.
📊Comment Analysis
In the accumulation price zone, the gold price is sideways around 3200-3270, and the buyers and sellers are balanced
💰Strategy Package
🔥Selling gold area: 3282-3284 SL 3289
TP1: $3270
TP2: $3260
TP3: $3250
🔥Buying gold area: $3167-$3165 SL $3160
TP1: $3178
TP2: $3189
TP3: $3200!
Labaron believes
Guaranteeing the principal is the bottom line for survival, controlling risks is the armor for survival, earning profits is a stage medal, and long-term stable and continuous profits are the only proof that can finally stand up from the sea of corpses and blood.

GOLD draws Double Top. Probably.My thought is as follows: possibilty of "Double top" if we break through ~3220 price level. According to classical TA we may fall down to ~3000
#GOLD #XAU

Gold Sideways: A Short-Term Opportunity for Smart Traders⚙️ 1. Short-Term Trend
On the 1-hour timeframe, gold price is consolidating in a narrow range between $3,220 – $3,243 following a pullback from the recent peak at $3,265. Recent candlesticks suggest that selling pressure is weakening, but no clear reversal signal has appeared yet. The main trend remains slightly bearish within a tight channel, awaiting a breakout.
📍 2. Key Technical Levels
• Nearby Resistance:
o $3,230: A mid-session resistance level that has been tested multiple times but not yet convincingly broken.
o $3,243: Intraday high. A break above this level could trigger a move toward $3,265, with potential extension to $3,280.
• Key Support:
o $3,220: Minor intraday support, currently under repeated testing.
o $3,200: Strong support and a critical technical level. A breakdown below this level may lead to further decline toward $3,185 – $3,170.
📈 3. Technical Indicators
• EMA 50 & 200 (H1): Price is trading between the 50 and 200 EMAs, indicating consolidation and indecision before a breakout.
• RSI (14): Hovering around 45–50, suggesting slowing bearish momentum, but no clear sign of a bullish reversal.
💡 Short-Term Trade Scenarios:
SELL XAU/USD Zone : 3240 – 3243
💰 TP : 3235 – 3238
🚨 SL $3245
BUY XAU/USD Zone: 3219 – 3222
💰 TP : 3224 – 3227
🚨 SL $3214
⚠️ Trading Note
Volatility may spike if there is news from the Fed or new geopolitical developments.

Gold Eases as Risk Sentiment Improves, but Long-Term Demand IntaMacro theme:
- Gold prices retreated from recent highs as improved risk sentiment following the US-China trade deal and a stronger US dollar weighed on safe-haven demand.
- Gold ETFs recorded modest outflows in Apr, but the withdrawal slowdown suggests easing profit-taking pressure.
- In the near term, trade optimism may keep gold under pressure, though central bank demand and portfolio diversification continue to support the long-term outlook.
Technical theme:
- XAUUSD pulled back from the swing high near 3430, forming a lower high and moving into a sideways structure between EMAs.
- A close below 3230 could trigger further downside toward 3135,
- On the contrary, holding above 3230 may prompt a retest of the 3430 level.
Analysis by: Dat Tong, Senior Financial Markets Strategist at Exness

Gold fluctuates repeatedly and is expected to fall below 3,200
📌 Driving factors
The U.S. Department of Labor's Bureau of Labor Statistics announced on Tuesday that the U.S. Consumer Price Index (CPI) rose 0.2% month-on-month in April, lower than the 0.3% expected by economists. However, analysts warned that inflation may rise as tariffs gradually push up commodity prices.
The United States and China announced on Monday that they would suspend tariffs for 90 days. According to the statement made by both sides after the Geneva talks last weekend, the United States will reduce tariffs on Chinese imports from 145% to 30%, and China will reduce tariffs on U.S. imports from 125% to 10%.
Driven by bargain hunting, gold prices rebounded on Tuesday, and the weaker-than-expected U.S. inflation data released that day also helped gold prices rise. However, trade optimism limits the strength of gold's rebound.
📊Commentary and analysis
Gold fell and then rose yesterday, and the final rebound stopped at 3,266. The trend is in line with our bearish expectations. As for the repeated fluctuations in the market, it is just a futile effort! Yesterday, due to the influence of the US CPI data, although gold rose in the short term, it was still under pressure and weakened. Today, the Asian session continued to fall in the early trading. As the support position near 3210 points is approaching, aggressive shorting is no longer appropriate!
In terms of trend, the 4-hour level trend of gold is still under pressure. Yesterday, it was under pressure at the 3260 line, and then the market fell back. Recently, it has maintained a trend of continuously moving down lows, and the rebound highs are gradually decreasing. It can be seen that the bulls are less willing to attack, which is different from the previous surge. Gold adjustment has become inevitable.
💰Strategy Package
Rebound short: short near 3265, stop loss 3269, target near 3220!
Labaron believes that
Guaranteeing the principal is the bottom line for survival, controlling risks is the armor for survival, earning income is a stage medal, and long-term stable and continuous profit is the only certificate to finally stand up from the sea of corpses and blood.

Gold fluctuates. When will a new trend start?China and the United States reached a 90-day ceasefire agreement, and the price of gold returned to 3,200 from 3,400 US dollars. All traders are staring at the support level of 3,200 US dollars, and are very worried about whether it can withstand pressure; it will fall to a larger level, resulting in no trading opportunities for gold positions.
I think your concerns are normal, and market fluctuations are also normal. There is no market that only rises and never falls; even in the bull market, there will be periodic adjustments.
Next, the focus is on the maturity of US Treasury bonds in June. The impact of trade conflicts will soon be forgotten by the market; US CPI inflation continued to decline in April, from 2.4% in the early stage to 2.3%, getting closer and closer to the Fed's ultimate goal of 2%, which means that the Fed will soon have to restart the interest rate cut plan.
Once the US Treasury bonds mature and default or trigger panic, or if Fed Chairman Powell reveals his intention to cut interest rates, gold will rise rapidly and may reach a high point within 1-2 days.
Okay, everyone; you need to understand the basic situation, but the most important thing is the operation strategy during the Asian trading session.
I think you can first test the long strategy around $3225, with a stop loss below 3215 and a profit in the rebound range of $3340-3360.
Man, excessive worrying will not help; if you can't accept short-term volatility trading, you can wait and see and stay calm.

Gold Price Analysis May 13Candle D shows a strong selling force approaching the key support zone of 3200, if it breaks this zone, it will confirm the continuation of the strong downtrend
Gold is facing some selling force around 3265. There will be a lot of selling force waiting around 3270 and 3280. Today, you can watch for SELL around these two zones. If the breakout is confirmed towards 3317, you can implement SELL strategies.
On the contrary, the nearest support zone for the breakout that gold is aiming for is around 3243. 3222 and 3200 act as two stops for a prolonged slide in gold prices today. Remember that in the large frame, a downtrend wave is starting to form, so the downtrend of gold can fall very strongly.

Gold prices are expected to rise in the future!Market news:
On Wednesday (May 14) in the early Asian session, spot gold fluctuated in a narrow range and is currently trading around $3,240/ounce. After the plunge on Monday, the London gold price rebounded slightly. The influx of bargain hunting provided support for the international gold price. In addition, the US CPI in April was weaker than market expectations, the Fed's expectations for rate cuts cooled, the US dollar index fell from a one-month high, and geopolitical concerns provided momentum for the gold price to rise.International gold faces three key variables: first, the follow-up progress of the Sino-US trade negotiations. Although the two sides reached a 90-day truce agreement, the comprehensive tariff policy still exists; second, the direction of the Federal Reserve's monetary policy. The mild performance of inflation data may create conditions for rate cuts; finally, global geopolitical risks, especially the evolution of the Russia-Ukraine peace talks and the India-Pakistan conflict. There are relatively few economic data on this trading day. US Secretary of State Rubio will attend the informal meeting of NATO foreign ministers from May 14 to 16 to discuss NATO's security priorities, including increasing defense investment and ending the Russian-Ukrainian war. In addition, several Federal Reserve officials will give speeches, and investors need to pay attention!
Technical Review:
The gold daily chart closed sharply below 3207, and the price broke away from the MA10/7-day gold bottomed out and rebounded in the late trading. The daily line closed with a small positive K and closed above the 3250 mark. After the extremely weak decline in the US market, the trend turned strong in the early morning, forming a wide range of fluctuations around the 3220/3270 range. The daily MA10/7-day moving average of the daily chart opened and suppressed 3296/3310 downward. The short-term four-hour chart and the hourly chart moving average were glued together, and the hourly chart Bollinger band closed. It closed strongly above the 3250 mark in the early morning, and the Asian market needs to pay attention to the strength of the counterattack of buying. Today's trading ideas are still expected to fluctuate, sell at high prices and buy at low prices to participate in short-term layout.At present, gold selling is temporarily resting. The intraday gold surge and the sharp drop before the data also show the repetitiveness of market sentiment. However, in the future, some factors that are conducive to selling are gradually implemented. The Fed's interest rate cut will be put on the agenda again in the medium term. The medium-term favorable pattern for gold has not changed, so in terms of operation, you can wait for the retracement to continue buying and continue to be bullish on gold.
Today's analysis:
The monthly chart of gold is running in an upward trend, and the long-term trend is neutral and upward; the weekly chart is a high-level shooting star, and the medium-term trend is expected to fall; the daily chart fails to hit the previous high and runs downward, and the short-term trend is expected to fall; the intraday short-term breaks through the 3248 suppression and continues upward, and the short-term stop-loss pattern appears. So far, the market has been repeatedly sorted above the 3215 area, and the short-term selling slows down and shows signs of stopping the decline!Note that if the one-hour closing today breaks above the 3348 area, then be careful when selling, and there is a high probability that the market will bottom out and reverse, which means that a new round of swing buying will start! At that time, you can directly choose the opportunity to buy the bottom! For the current short-term gold, focus on the stabilization of the two supports of 3215-3225. Take 3200 as the turning point of the Fengshui Ridge, and keep it to continue to maintain the bottom shock or gradually rebound; once it breaks through 3270, the rebound will be strengthened to test the 3300 mark; if it breaks through 3300 and stabilizes, the downward adjustment will end and the trend will return to rise;
Operation ideas:
Buy short-term gold at 3227-3230, stop loss at 3228, target 3270-3290;
Short-term gold sell at 3265-3268, stop loss at 3277, target 3230-3210;
Key points:
First support level: 3225, second support level: 3215, third support level: 3200
First resistance level: 3260, second resistance level: 3278, third resistance level: 3300

XAU/USD(20250514) Today's AnalysisTechnical analysis:
Today's buying and selling boundaries:
3243
Support and resistance levels:
3292
3274
3262
3224
3212
3194
Trading strategy:
If the price breaks through 3262, consider buying, the first target price is 3274
If the price breaks through 3243, consider selling, the first target price is 3224

XAUUSD – Market Update & Daily Plan May 14, 2025🧠 Macro Outlook – Eyes on Thursday
CPI is done. The next major catalyst? A full lineup of USD data + Powell speaking tomorrow, Thursday, May 15.
📊 Key Events – May 15 (NY Session)
🟩 Core PPI m/m → Forecast: 0.3% (prev. -0.1%)
🟩 Retail Sales m/m → Forecast: 0.0% (prev. 1.4%)
🟩 Core Retail Sales m/m → Forecast: 0.3%
🟩 Unemployment Claims → Forecast: 229K
🟧 Empire State + Philly Fed Manufacturing Indexes
🔴 ⚠️ Fed Chair Powell Speaks
This is not a light news day. It’s a full macro storm. Expect strong reactions from gold depending on how inflation, retail demand, and Powell’s tone align.
🔍 Market Flow – Price Action Overview
Gold remains in a retracement phase after bouncing cleanly from 3215–3225.
It’s now consolidating at 3244–3252, a mid-range supply zone. Above this, we track a clear mitigation path toward untouched OBs and FVGs.
No structure has broken cleanly to confirm bullish reversal yet — so we remain reactive, not predictive.
🧱 Sniper Mitigation Map
🔢 📍 Zone ⏳ Status ⚙️ Reason
1️⃣ 3244–3252 🔄 In play Mid-range supply zone currently in test
2️⃣ 3280–3288 ❗Unmitigated M30 OB + inefficiency pre-CPI
3️⃣ 3315–3320 ❗Unmitigated Asian session FVG / Gap
4️⃣ 3330–3338 ❗Unmitigated H1–H4 bearish OB (key reversal area)
5️⃣ 3350–3360 ⚠️ Only if structure shifts Upper OB — reserved for extreme flow
📌 Key Technical Zones
Zone Type Level Context
✅ Demand Zone 3215–3225 Confirmed post-CPI bounce zone
🔄 Active Supply 3244–3252 Current area of compression
🟧 M30 OB 3280–3288 Clean bearish OB not yet tested
🟥 FVG Magnet 3315–3320 Asia imbalance likely to attract price
🟥 HTF OB 3330–3338 Valid HTF reversal supply
⚠️ Upper OB 3350–3360 Only if 3338 breaks with strength
🧠 How to Use This Plan
Watch what price does at each zone, then build your own plan based on confirmations like BOS, CHoCH, rejection wicks, or liquidity sweeps.
Scenarios:
Tap & reject 3288? → Short scalp idea back to 3244
Break above 3288? → 3315–3320 becomes next magnet
Strong reaction at 3330–3338? → HTF sell zone in play
Powell hawkish? → Gold likely pressured down from OBs
Powell dovish? → Price may reclaim above 3338
📣 Final Note
Thursday = 🔥 Macro Meltdown Day 🔥
Powell + inflation + retail data = high-probability moves. Let price lead. Don’t force early entries into chop.
💛 Appreciate clean, structured levels?
📲 Follow GoldFxMinds for daily updates — no fluff, just structure and timing.
— GoldFxMinds ✨📉

XAU/USD) Bullish trand line analysis Read The ChaptianSMC Trading point update
Technical analysis of Gold Spot (XAUUSD) on the 4-hour timeframe, featuring key support and resistance levels, price action projections, and RSI for momentum evaluation. Here's a breakdown of the idea:
Key Points in the Analysis:
1. Support & Resistance Zones:
Big Support / Buying Zone: Around 3,222 – 3,240. This zone has seen previous bullish reversals and is supported by the 200 EMA.
Intermediate Support Level: Around 3,270–3,290, where price might bounce before attempting a breakout.
Key Resistance Level: Around 3,350–3,365. Price must break this area to move toward higher targets.
2. Price Action Projections:
The analysis shows two bullish potential scenarios:
Scenario 1: Price breaks above the resistance level directly and moves toward the target point at 3,535.83.
Scenario 2: A retracement to the lower support or even the big buying zone before a bullish rally to the same target.
3. RSI (Relative Strength Index):
Currently near the neutral zone (around 49), suggesting there's room for movement in either direction.
No extreme overbought/oversold signals right now.
4. EMA (200):
The price is currently hovering above the 200 EMA (3,222.01), which acts as a long-term support and trend indicator.
Mr SMC Trading point
Summary of the Trading Idea:
Bias: Bullish
Entry Zones: Look for long entries at either the support level (3,270–3,290) or lower buying zone (around 3,222).
Target: 3,435.05 initially, then 3,535.83.
Invalidation: A clear breakdown below the 3,222 support level could invalidate the bullish bias.
Pelas support boost 🚀 analysis follow)

Gold's callback remains bearish
As expected, the market weakened and fell again. Today, the lowest price fell to 3215. There are countless opportunities to stop profit and leave the market. Even if you don't operate, you can see the strategy time I publish every day. This can be regarded as the first round of gains since the opening. Although there is no long position, the short position is still good!
Approaching the European session, I also mentioned at noon that the rebound upward can continue to bet on the second short position. Both the time and the point are given. The highest rebound in the European session is 3266. The point I gave is 3260-63. There should be countless opportunities to enter the market. The current gold price fell to 3237! Still the same point of view, it is easy to make a profit of at least 20-30 points each time! If you have been facing losses, it means that you have not focused on the free strategies I publish every day.
Traders who did not enter the market today are advised to continue to pay attention to the 3266 resistance and enter the market again. The support below is 3215. Before the data market is released, it will be treated as a volatile trend. I will make real-time suggestions when the breakout occurs.
Hello traders, if you have better ideas and suggestions, please leave a message below, I will be very happy

CPI data released. Impact on gold prices?Gold suffered a setback this week; but then it rose to $3,250 and began to fluctuate slightly.
CPI data was released this morning, but it did not have a big impact on gold. The current price is still in a sideways trend.
Two support positions need to be paid attention to today:
Downward $3,230 support line, if it falls below this position, the gold price will quickly reach below $3,200.
Upward $3,270 resistance line, if it breaks through the resistance position strongly, there is hope to try to break through $3,300.
Quaid believes that if the gold price fails to break through today and presents a new trend, it is likely to continue the sideways trend.
