The market is bullish, but I am bearish. Don't regret it.📰 News information:
1. Focus on tomorrow's CPI data
2. Bowman's speech at the Federal Reserve
3. Tariff information outflows and countries' responses to tariff issues
📈 Technical Analysis:
This week, the US CPI data, consumer index, tariff issues and geopolitical situation are all key points to pay attention to. In the morning, both our long and short positions had good gains, making a good start to the week. The best way is to follow the trend and grab limited profits!
In the 4H cycle, the current trend shows a Zhendan upward pattern, and bulls still occupy the dominant low position in the short term. At the daily level, three consecutive positive days at the end of last week broke through the middle track, and the high point broke through the previous high, indicating that the short-term adjustment is over, and the rise in the market to test 3400 will be a high probability event. At present, the MACD daily line is bullish, the Bollinger Bands are flat, and the gold price is above the middle track. The bulls are strong, but there is still a need for a correction. Intraday trading focuses on the strength of the European session. If the European session is strong, the US session will continue to rise, and if the European session is weak, the US session will bottom out again. In the short term, if it touches 3370-3375 again, you can consider shorting and look towards 3365-3355 SL 3380.
🎯 Trading Points:
sell 3370-3375
tp 3365-3355-3345
In addition to investment, life also includes poetry, distant places, and Allen. Facing the market is actually facing yourself, correcting your shortcomings, facing your mistakes, and exercising strict self-discipline. I share free trading strategies and analysis ideas every day for reference by brothers. I hope my analysis can help you.
FXOPEN:XAUUSD TVC:GOLD FX:XAUUSD FOREXCOM:XAUUSD PEPPERSTONE:XAUUSD OANDA:XAUUSD
Goldprice

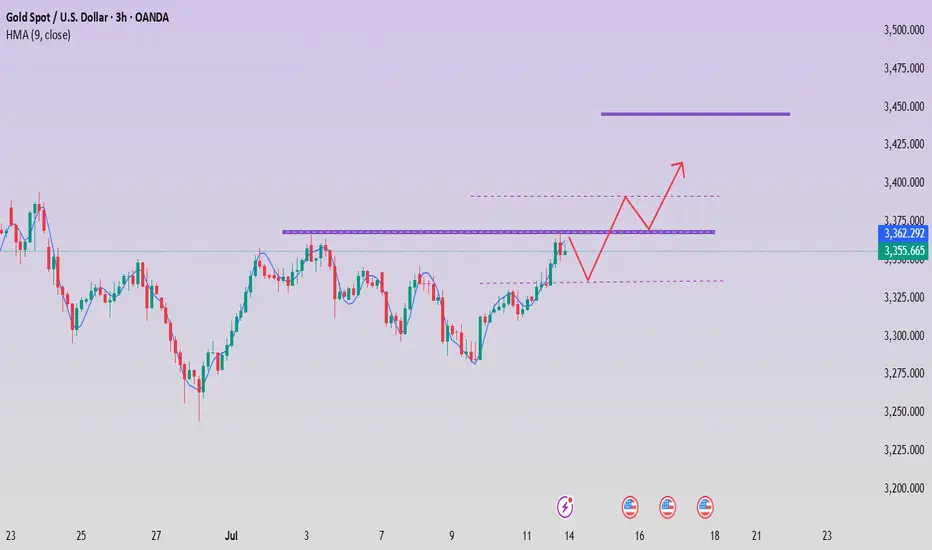
XUA/USD) Bullish Analysis Read The captionSMC trading point update
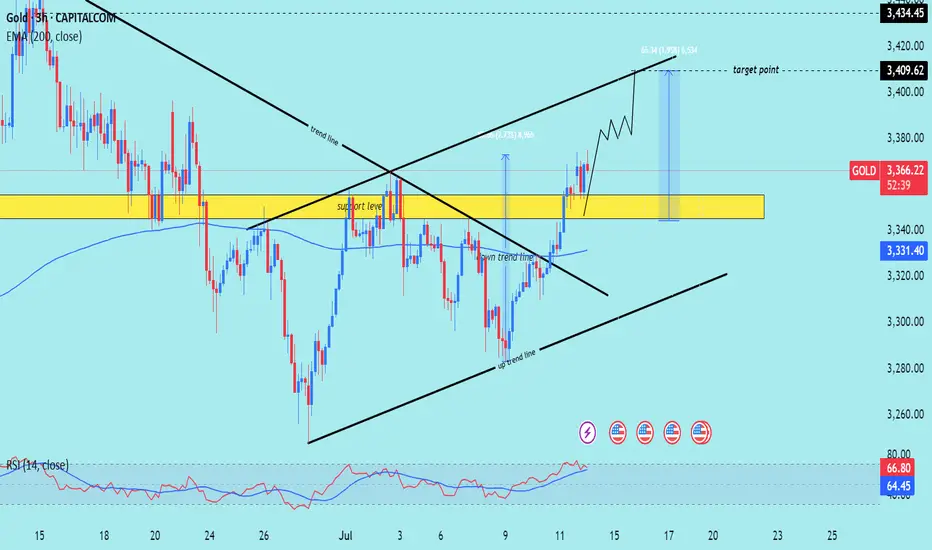
Technical analysis of Gold (XAU/USD) analysis on the 3-hour
---
Gold (XAU/USD) 3H Technical Analysis Summary
Market Structure: Bullish breakout
Price has successfully broken above both the downtrend line and the support zone (highlighted in yellow), signaling a shift in structure from bearish to bullish.
Key Support Zone:
The yellow zone (~3,335–3,355) was previously a resistance area. After the breakout, it is acting as a strong support level and has been retested.
Trendlines:
Downtrend line: Broken and retested.
Uptrend line: Guiding current price action, supporting higher lows and forming an ascending channel.
200 EMA (blue line):
Price is trading above the EMA 200 (~3,331), confirming bullish bias and providing dynamic support.
Momentum (RSI 14):
RSI is around 67.85, showing strong bullish momentum.
Nearing overbought, so a minor pullback or consolidation could occur before continuation.
Volume:
Increase in buying volume near breakout area suggests institutional interest or strong buyer conviction.
Mr SMC trading point
---
Conclusion:
Price has shifted into a bullish continuation pattern.
A successful break and retest of structure and trendlines increases the likelihood of further upside.
As long as price holds above the yellow support zone and the uptrend line, bullish momentum is favored.
Short-term pullbacks may offer new long opportunities.
---
Please support boost 🚀 this analysis)
Beware of the market's trap of luring more investors, short 3335Regarding recent trading strategies, I believe you have also seen my trading win rate. I often inform the future trend of gold several hours or even days in advance, because my many years of trading experience have made me an excellent poisonous wolf in the trading market. Now I see a lot of bullish voices in the market, but my wolf’s sense of smell has discovered danger signals. In the short term, I think that without the influence of news, the market needs to digest the overbought momentum of the bulls. From the 4H chart, the middle track of the Bollinger Band is at 3332, which is very close to the strong support of 3330 given by us during the day. Therefore, I think that at least within 4 hours, gold will fall back to test the support below 3340-3330, or even 3320. Since most people want to follow the crowd, let them go. They will only fall into the trap set by the market. Let's prove with facts whether following the wolf pack will make you hungry or well fed.
OANDA:XAUUSD

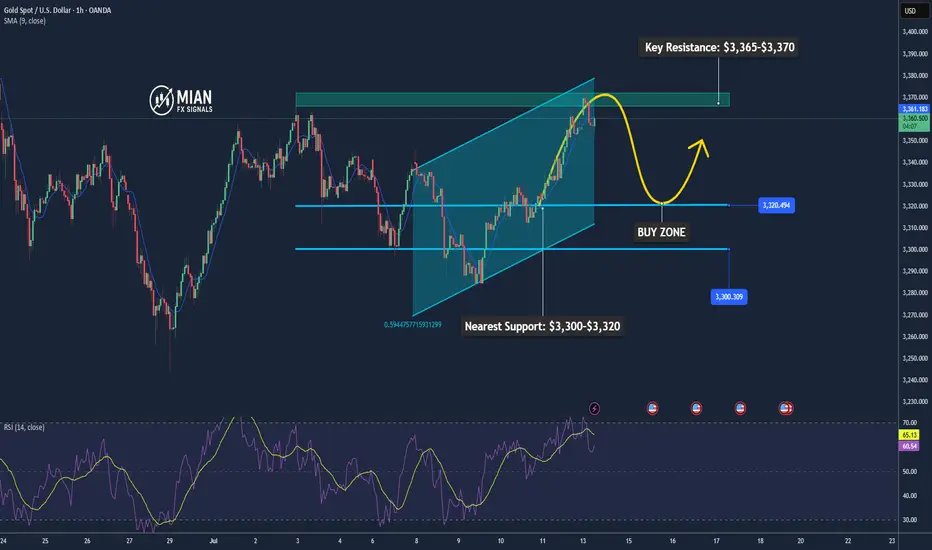
Gold May Temporarily Correct Under Resistance Pressure📊 Market Overview:
• Gold reached resistance around $3,365–$3,370/oz before showing signs of cooling due to mild profit-taking.
• Ongoing trade tensions and geopolitical risks — such as President Trump’s tariff plan — continue to support safe-haven demand, driving gold close to a three-week high.
• Strong central bank purchases reinforce the long-term bullish outlook.
📉 Technical Analysis:
• Key Resistance: $3,365–$3,370
• Nearest Support: $3,300–$3,320
• EMA 09: Price is currently below the EMA 09, suggesting a potential short-term pullback. (Price is still above the EMA50, supporting the recent uptrend.)
• Candlestick patterns / Volume / Momentum:
o RSI near 57 – neutral but slightly declining.
o MACD and ADX remain bullish, indicating underlying strength but with possible short-term consolidation ahead.
📌 Outlook:
Gold may experience a short-term pullback if it fails to break through the $3,365–$3,370 zone and geopolitical tensions ease.
However, the medium-to-long-term trend remains bullish, especially as central banks continue to accumulate gold and global risks persist.
💡 Suggested Trading Strategy:
SELL XAU/USD: $3,363–$3,366
🎯 Take Profit: 40/80/200 pips
❌ Stop Loss: $3,369
BUY XAU/USD : $3,317–$3,320
🎯 Take Profit: 40/80/200 pips
❌ Stop Loss: $3,214
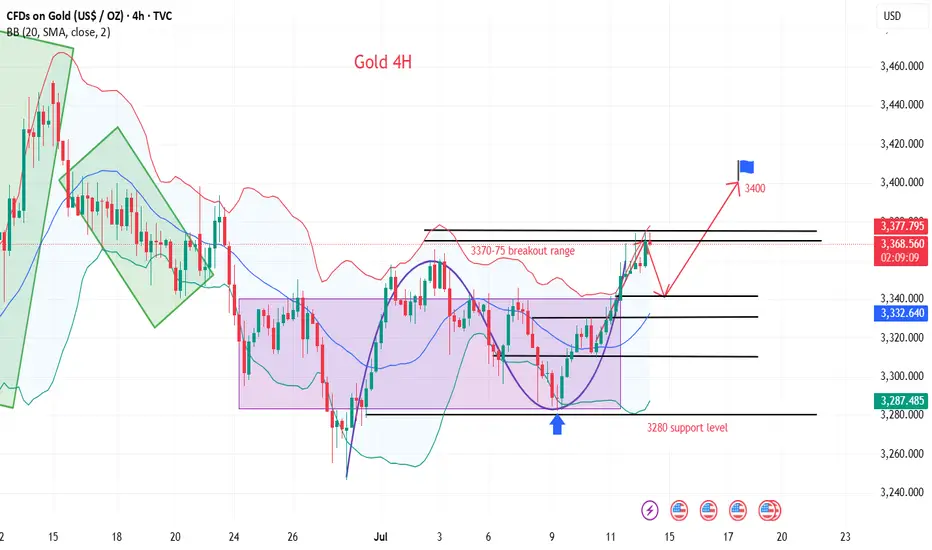
Gold bulls explode to new highs
💡Message Strategy
Gold prices hit a three-week high near $3,375 an ounce in early trading on Monday before retreating. Gold prices are under selling pressure again as buyers failed to sustain higher levels hit earlier on Monday.
Gold prices hit a three-week high in early Asian trading on Monday, supported by safe-haven demand after U.S. President Trump threatened to impose 30% tariffs on imports from the European Union and Mexico.
Gold prices encountered resistance just below the 23.6% Fibonacci retracement of April’s record rally at $3,377 an ounce in early Asian trading on Monday.
Despite the pullback, the 14-day relative strength index (RSI) continues to show additional upside as the indicator is well above its midline, currently near 54.20.
📊Technical aspects
Gold 4H chart. From the perspective of the morphological structure, gold has recently been rising in lows, and has been oscillating upward along the rising trend line, moving out of the standard rising trend wave rhythm. On Friday night, the bulls once again made a strong effort to break through the key pressure level of 3345.0, further opening up the bullish upside space, and the market outlook continues to see the bullish continuation of the market.
According to the comprehensive MACD indicator, the fast and slow lines are running above the 0 axis, indicating that the bullish power dominates the market trend. In terms of strategy, it is recommended to follow the bullish rebound wave trend to find support levels and ambush long orders.
💰Strategy Package
Long Position:3335-3340,SL:3320,Target: 3390-3400
Gold Building Momentum for BUY MoveGold has tested the global trend level is showing a rebound the price is testing the support level of 3368 if it maintain support level the growth will continue to 3400 level
we suggest BUY XAUUSD 3368 entry point
target point 3400

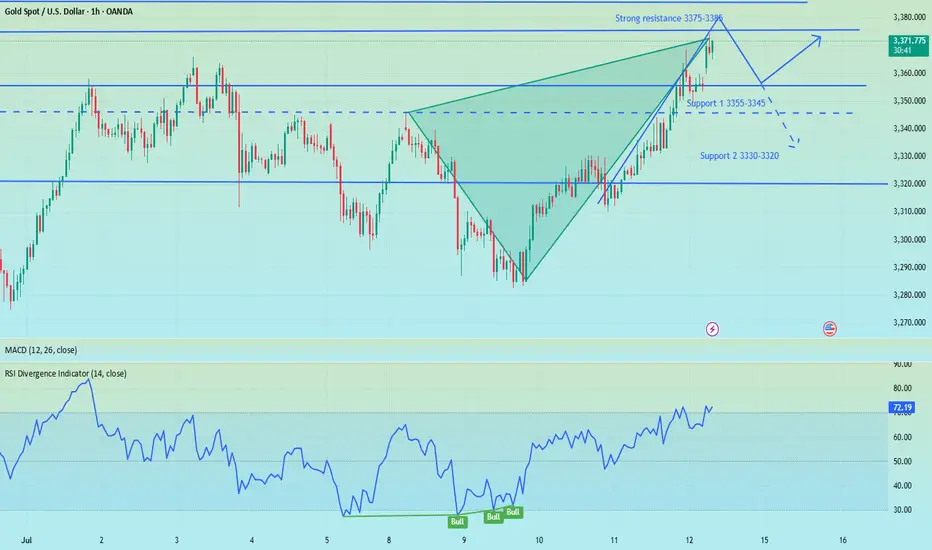
Gold breaks trendline towards 3390, Uptrend resumes✏️ OANDA:XAUUSD The price increase will continue today and will be even stronger. After breaking the trendline, gold has strong support. SELL strategies are only considered to find short-term reaction points waiting for the next trends.
Gold has confirmed the uptrend is back, heading to 3390 today.
📉 Key Levels
Support 3330-3314
Resistance 3345-3362-3388
Sell trigger: rejection from 3345 with bearish confirmation
Sell zone: 3362–3387 (Strong resistance)
BUY trigger: 3330-3314 support with bounce confirmation
Leave your comments on the idea. I am happy to read your views.

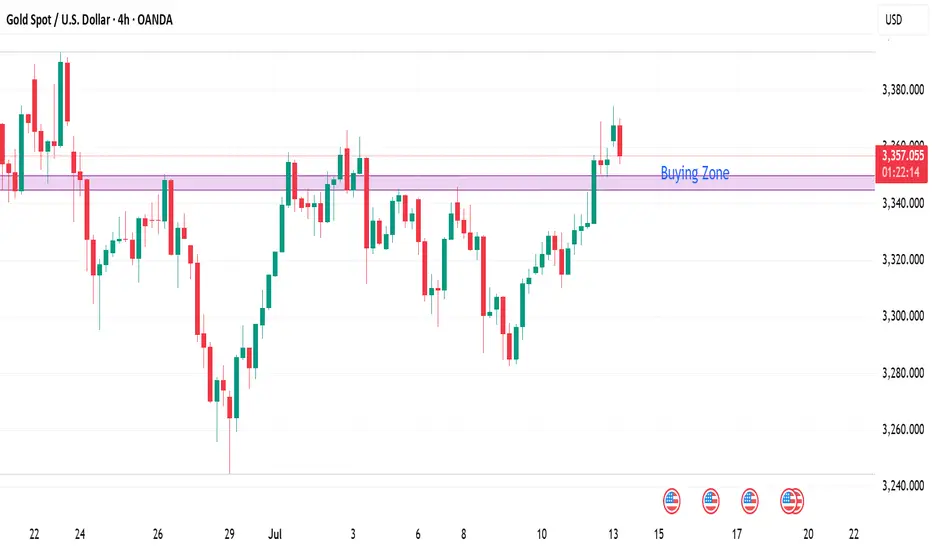
Gold gaps up and open higher,beware of going long at high levelsBros, the Asian session opened higher in the morning. Currently, gold is falling back to the SMA1O moving average. We will continue to be bullish after it falls back and stabilizes. At present, it has broken through the key resistance level of 3360. The daily line has shown a strong pattern of three consecutive positives. The gold price remains in the rising channel, and the bullish trend is obvious. As the gold price moves up, the short-term moving average moves up with it. At present, 3355-3345 constitutes an important support in the short term, and 3375-3385 above constitutes a short-term resistance area. Whether it can stand firmly above 3360 this week is the key.
Severe overbought in the short term, there are trading risks for long positions at high levels. Short-term operation suggestions for the Asian and European sessions: consider shorting when it touches 3365-3375, and stop loss when it breaks 3375. The target focuses on 3355-3345, and the breakout looks at 3330-3320. On the contrary, if it stabilizes at 3355-3345, you can consider going long.
XAU/USD technical analysis setup Read The captionSMC trading point update
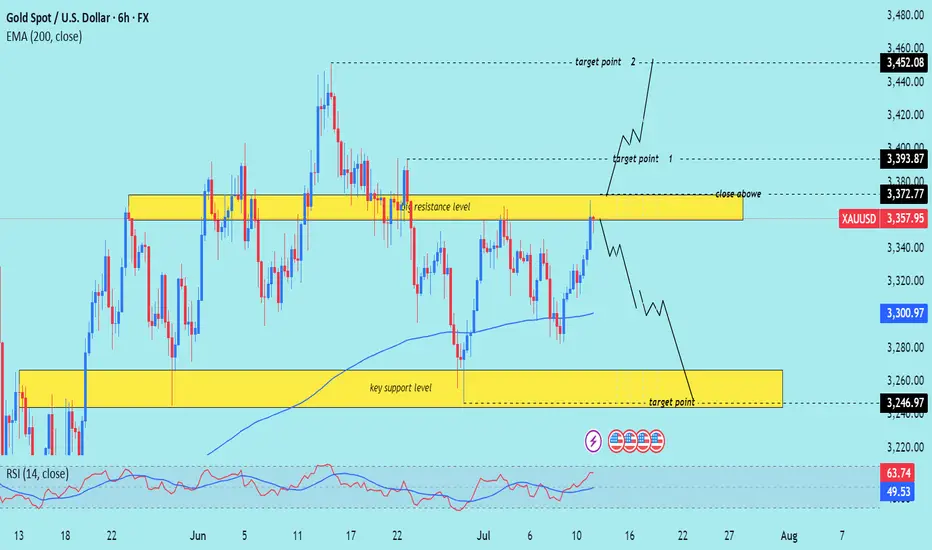
Technical analysis of (XAU/USD) on the 6-hour timeframe, focusing on a key resistance zone that could trigger either a bullish breakout or a bearish reversal.
---
Analysis Summary
Current Price: $3,357.95
Trend Context: Price is testing a strong resistance zone with a possible breakout or rejection in play.
---
Scenario 1 – Bullish Breakout
1. Resistance Zone: $3,357–$3,372
Multiple previous rejections.
A confirmed close above $3,372.77 signals bullish strength.
2. Upside Targets:
Target 1: $3,393.87
Target 2: $3,452.08
3. Indicators:
RSI at 63.74, approaching overbought but still with room to rally.
EMA 200 is trending upward, supporting bullish bias.
---
Scenario 2 – Bearish Rejection
1. If price fails to close above $3,372.77, a rejection from resistance is likely.
2. Downside Targets:
Reversal projected toward the key support zone at $3,246.97
EMA 200 at $3,300.97 may provide temporary support before breakdown.
---
Trade Ideas
Direction Entry Level Stop-Loss Target 1 Target 2
Bullish Close above $3,372 Below $3,346 $3,393.87 $3,452.08
Bearish Rejection from $3,357–$3,372 Above $3,380 $3,300 → $3,246.97
Mr SMC Trading point
---
Summary
This is a critical decision point for Gold. A breakout above resistance can propel price to $3,450, while rejection could drive price back to $3,246. The reaction at the current zone will dictate the next major swing.
Please support boost 🚀 this analysis)
Market Analysis: Gold Climbs Higher Amid Market OptimismMarket Analysis: Gold Climbs Higher Amid Market Optimism
Gold price started a fresh increase above the $3,350 resistance level.
Important Takeaways for Gold Price Analysis Today
- The gold price started a fresh surge and traded above $3,330.
- A key bullish trend line is forming with support at $3,350 on the hourly chart of gold at FXOpen.
Gold Price Technical Analysis
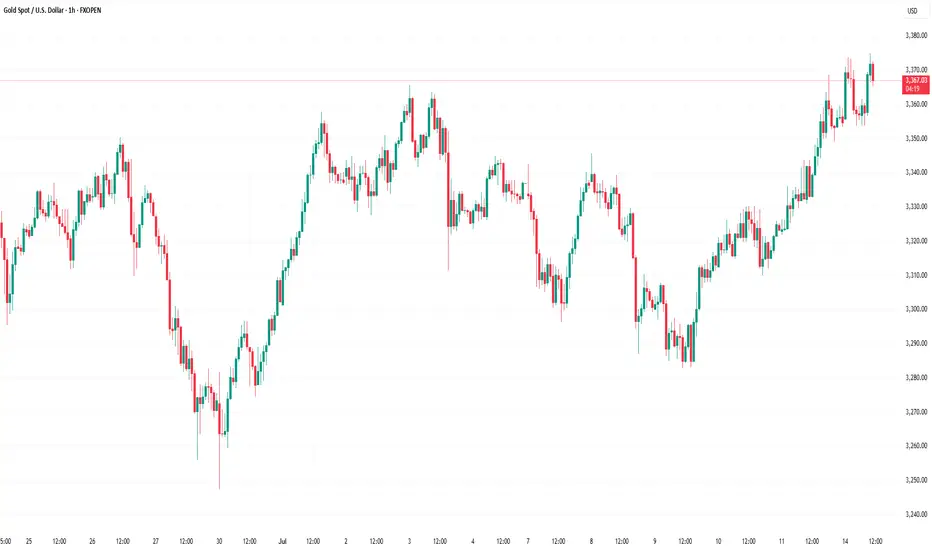
On the hourly chart of Gold at FXOpen, the price formed a base near the $3,280 zone. The price started a steady increase above the $3,330 and $3,350 resistance levels.
There was a decent move above the 50-hour simple moving average and $3,360. The bulls pushed the price above the $3,365 resistance zone. A high was formed near $3,373 and the price is now consolidating.
On the downside, immediate support is near the $3,350 level and the 23.6% Fib retracement level of the upward move from the $3,282 swing low to the $3,373 high.
Besides, there is a key bullish trend line forming with support at $3,350. The next major support sits at $3,330 and the 50% Fib retracement level.
A downside break below the $3,330 support might send the price toward $3,300. Any more losses might send the price toward the $3,280 support zone.
Immediate resistance is near the $3,370 level. The next major resistance is near $3,380. An upside break above $3,380 could send Gold price toward $3,400. Any more gains may perhaps set the pace for an increase toward the $3,420 level.
This article represents the opinion of the Companies operating under the FXOpen brand only. It is not to be construed as an offer, solicitation, or recommendation with respect to products and services provided by the Companies operating under the FXOpen brand, nor is it to be considered financial advice.
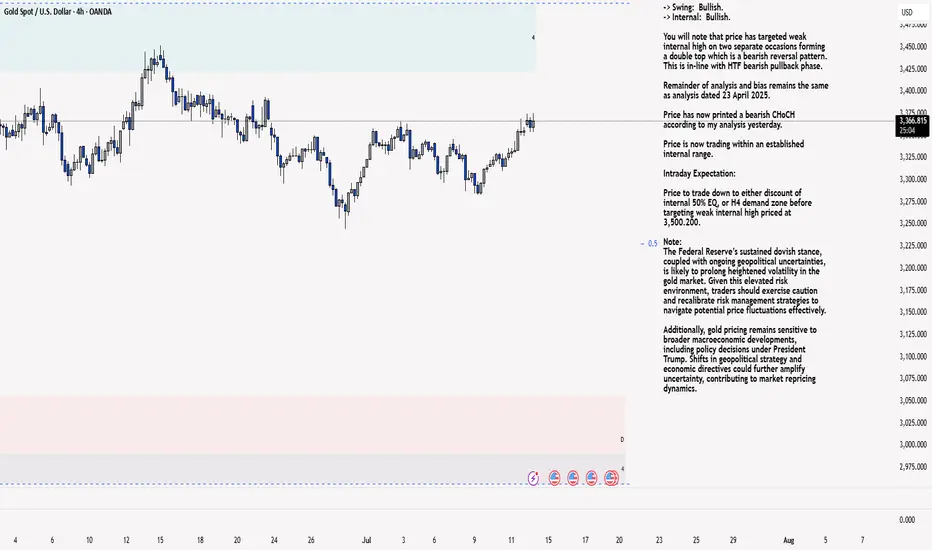
XAU/USD 14 July 2025 Intraday AnalysisH4 Analysis:
-> Swing: Bullish.
-> Internal: Bullish.
You will note that price has targeted weak internal high on two separate occasions forming a double top which is a bearish reversal pattern. This is in-line with HTF bearish pullback phase.
Remainder of analysis and bias remains the same as analysis dated 23 April 2025.
Price has now printed a bearish CHoCH according to my analysis yesterday.
Price is now trading within an established internal range.
Intraday Expectation:
Price to trade down to either discount of internal 50% EQ, or H4 demand zone before targeting weak internal high priced at 3,500.200.
Note:
The Federal Reserve’s sustained dovish stance, coupled with ongoing geopolitical uncertainties, is likely to prolong heightened volatility in the gold market. Given this elevated risk environment, traders should exercise caution and recalibrate risk management strategies to navigate potential price fluctuations effectively.
Additionally, gold pricing remains sensitive to broader macroeconomic developments, including policy decisions under President Trump. Shifts in geopolitical strategy and economic directives could further amplify uncertainty, contributing to market repricing dynamics.
H4 Chart:
M15 Analysis:
-> Swing: Bullish.
-> Internal: Bullish.
H4 Timeframe - Price has failed to target weak internal high, therefore, it would not be unrealistic if price printed a bearish iBOS.
The remainder of my analysis shall remain the same as analysis dated 13 June 2025, apart from target price.
As per my analysis dated 22 May 2025 whereby I mentioned price can be seen to be reacting at discount of 50% EQ on H4 timeframe, therefore, it is a viable alternative that price could potentially print a bullish iBOS on M15 timeframe despite internal structure being bearish.
Price has printed a bullish iBOS followed by a bearish CHoCH, which indicates, but does not confirm, bearish pullback phase initiation. I will however continue to monitor, with respect to depth of pullback.
Intraday Expectation:
Price to continue bearish, react at either M15 supply zone, or discount of 50% internal EQ before targeting weak internal high priced at 3,451.375.
Note:
Gold remains highly volatile amid the Federal Reserve's continued dovish stance, persistent and escalating geopolitical uncertainties. Traders should implement robust risk management strategies and remain vigilant, as price swings may become more pronounced in this elevated volatility environment.
Additionally, President Trump’s recent tariff announcements are expected to further amplify market turbulence, potentially triggering sharp price fluctuations and whipsaws.
M15 Chart:
XAUUSD Analysis – July 14, 2025: Gold Tests Critical Resistance Gold (XAUUSD) is currently trading around $3,373, rebounding strongly from the recent low at $3,294. Price is now testing the key resistance zone at $3,372–3,375, which aligns with the 0.0 Fibonacci retracement of the previous downtrend and a significant supply zone on the H4 timeframe.
1. Technical Analysis (H4 Chart):
🔹 Fibonacci & Price Action:
The price found strong support at $3,294, where previous demand and Fibonacci levels converge.
A sharp bullish move has pushed price above the 0.5 (at $3,316) and 0.618 (at $3,322) Fibonacci levels – signaling strong buyer interest.
The $3,372 zone is now acting as short-term resistance, matching the previous swing high.
🔹 EMA & RSI:
EMAs are trending upward, confirming short-term bullish momentum.
RSI is approaching overbought territory, suggesting a potential pullback in the short term.
🔹 Trendline & Structure:
Price remains above the rising trendline, indicating sustained bullish momentum.
The nearest support zone is now at $3,322 – $3,333, which overlaps with key Fibonacci and previous structure levels.
2. Key Price Levels:
Price Zone
Significance:3,372 – 3,375
Short-term resistance – Fibo 0.0:3,345 – 3,333
First support – pullback zone:3,322 – 3,316
Strong support – EMA + Fibo 0.5:3,294 – 3,287
Major support – recent swing low
3. Suggested Trading Strategies:
Strategy 1 – Take Profit for Existing Longs:
If you entered long positions near $3,295–$3,300, consider taking partial profits at the current resistance zone ($3,372–$3,375).
Strategy 2 – Short-Term Sell Opportunity:
Consider a short entry near $3,372–$3,375, with a stop-loss above $3,383.
Target profit: $3,333 – $3,322
Strategy 3 – Buy on Dip (Trend Continuation):
If price pulls back to the $3,333 – $3,322 support and holds, this is a good zone to enter long.
Stop-loss below $3,316, with potential target back to $3,385 – $3,400 if a breakout occurs.
Gold is showing a solid recovery after a sharp decline, but it is now testing a key resistance zone around $3,373. Caution is advised in the short term, as a pullback may occur. Priority should be given to "Buy on Dip" strategies if support zones hold.

Gold Weekly Analysis | Will $3,360 Break or Hold? [July 14–18]In this video, I break down the recent gold price action and what to expect in the coming week. We’ll review how gold responded to last week’s FOMC minutes, why $3,360 remains a key decision zone, and what upcoming U.S. economic data (CPI, PPI, Retail Sales) could mean for price movement.
👉 If you find this content valuable, don’t forget to Vote, Comment, and Subscribe for weekly market breakdowns.
Disclaimer:
Based on experience and what I see on the charts, this is my take. It’s not financial advice—always do your research and consult a licensed advisor before trading.
#GoldAnalysis, #XAUUSD, #ForexTrading, #GoldForecast, #MarketOutlook, #TechnicalAnalysis, #FundamentalAnalysis, #GoldPrice, #FOMC, #CPIData, #PPIdata, #DollarIndex, #TradingStrategy, #WeeklyOutlook, #GoldTechnicalAnalysis, #TradeSmart, #Darcsherry

Affected by tariffs, gold rose again.On Saturday, Trump announced that he would impose a 30% tariff on goods imported from the European Union and Mexico from August 1. This news triggered a rise in risk aversion in the market. As a traditional safe-haven asset, gold was once again sought after. The price continued the rise on Friday and continued to open high in the early Asian session. As of now, the highest price reached around 3373.
From the current market point of view, after breaking through the triangle pattern last Friday, there was a sharp rise. The price successfully stood on the short-term moving average, showing an overall bullish trend. However, it should be noted that the short-term moving average has not yet formed an upward cross, which means that there is a high possibility of a confirmation process in the future. Looking back at the trend in the past two months, gold rarely opens high and then continues to rise. Most of them open high and go low. Therefore, under the current situation, although it is bullish overall, it is not advisable to blindly chase more. It is more suitable to wait for a decline before arranging more orders. The key lies in grasping the decline position.
From the perspective of pressure level, 3380-3385 is the first pressure level, and the second pressure level is 3395-3400. The support level below is around 3345, which is also the pressure level that has been emphasized in the early stage, and the top and bottom conversion position. For today's operation, Quaid recommends low-to-long.
Operation strategy:
Short near 3380, stop loss 3390, profit range 3360-3345
Long near 3345, stop loss 3335, profit range 3360-3380
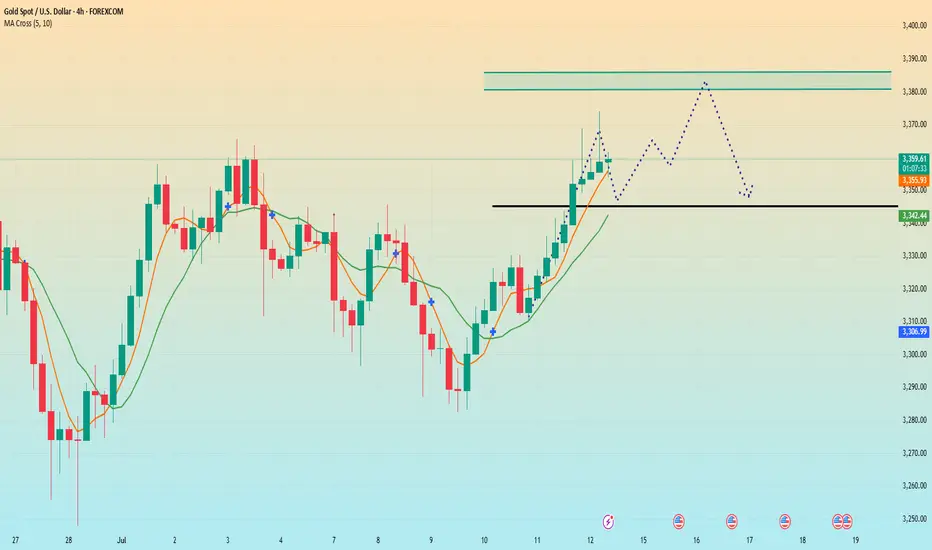
Market Structure & Technical Context 14 July 20241. Price Action & Market Structure
Gold has broken recent swing highs above ~$3,360, marking a bullish Break of Structure (BOS) and signaling upward momentum continuity
Recent pullback zones around $3,350–$3,340 formed a clear Higher Low (Change of Character) — textbook price action confirmation.
2. Fibonacci Retracement / Extension
Measuring from the last swing low near ~$3,326 to swing high ~3,374:
38.2% retracement at ~$3,352 coincides with the current bounce zone.
50% retracement at ~$3,350 aligns with key structure support.
Upside extension targets: 1.272 at ~$3,396, 1.618 at ~$3,425 — overlapping major resistance zones
3. ICT & Smart Money Concepts (SMC)
Order Blocks (OBs) identified near $3,340–$3,342 (prior resistance turned support) — ideal demand zone.
A recent Buy-side liquidity grab eclipsed above $3,360, sweeping stops and gathering liquidity before the breakout — classic ICT setup .
A Fair Value Gap (imbalance) lies around $3,345–$3,350 — zone to expect value-driven retracement.
Higher timeframe has clear SMC alignment: BOS above 3,360 with CHoCH already formed.
4. Major Supply / Demand & Support / Resistance Zones
Demand: $3,340–$3,352 (OB + Fib + BOS confluence).
Supply: $3,380–$3,385 (intraday swing high resistance), followed by zone at $3,396–$3,400.
Key resistance at $3,360–$3,362 — confirmed supply pocket that needs to be reclaimed
5. Moving Average Confirmation
The 4‑hour SMA/EMA 100–200 band is sloping up just below current price (~$3,340–$3,350), reinforcing the bullish context .
1‑Hour Intraday Setups (Aligned with HTF Bullish Bias)
Setup A: Pullback into 4‑Hour OB / Fair Value Gap
Entry: Limit buy at $3,345–$3,350.
Stop: Below $3,335 (below imbalance & BOS).
TP1: $3,362 (former resistance).
TP2: $3,380 (next supply block).
Setup B: Breakout Retest of 3,360
Entry: Buy on retest of broken resistance at $3,360.
Stop: Below $3,356.
TP1: $3,380.
TP2: $3,396 (Fib extension confluence).
Setup C: Momentum Continuation Fresh Breakout
Entry: Market buy on clear H1 BOS above $3,365.
Stop: Below breakout candle low (~$3,360).
TP: $3,396 (1.272 Fib) – extend to $3,425 if momentum strong.
The Golden Setup:
Setup A—buy from $3,345–$3,350—has strong confluences:
4‑hour demand OB + fair value gap,
38.2–50% Fib retracement,
SMC BOS/imbalance alignment,
ICT-style order block zone.
This offers high edge with confluence clusters.
✔ Summary Report: Direction & Key Zones
Directional Bias:
Medium-term (4H): Bullish, confirmed by BOS above 3,360, higher lows, OB and Fibonacci alignment.
🔹 Primary Buy Zones:
$3,345–$3,350 — 4H OB + fair value gap + Fib.
$3,360 on retention — breakout retest zone.
Momentum entry >$3,365.
🔹 Key Target Zones:
First resistance: $3,360–$3,362.
Next supply: $3,380–$3,385.
Extension target: $3,396 (1.272 Fib), then $3,425 (1.618 Fib).
🔻 Watchdownside Risk:
Daily invalidation if drop below $3,335 (4H OB break).
Next support at $3,326–$3,330.
📋 Consolidated Table: Setups at a Glance
Setup Entry Zone Stop Targets
Golden $3,345–$3,350 $3,335 TP1: $3,362 / TP2: $3,380
Breakout Pullback $3,360 retest $3,356 $3,380 → $3,396
Momentum BOS >$3,365 (H1 BOS) < $3,360 $3,396 → $3,425
Final Thoughts
On the 4‑hour chart, price is firmly in a bullish regime, supported by price structure, SMC, ICT concepts, and Fibonacci confluence. The $3,345–$3,350 zone is the highest‑probability entry for buyers, offering excellent risk/reward. The Golden Setup targets ~$3,380 and beyond, combining structure, gap fill, and liquidity strategy.
Gold trend forecast for next week, continue to go longAfter the gold broke through on Friday, we started to turn long, and gold rose strongly. Gold finally rose as expected, and the gold bulls are still strong. If there is no major change in the news over the weekend, the decline next week will not be large, and we can continue to buy. The gold 1-hour moving average continues to cross upward and the bulls are arranged and diverge. The strength of gold bulls is still there, and the gold moving average support has also moved up to around 3330. After gold broke through 3330 yesterday, gold fell back to 3330 and stabilized and rose twice. The short-term gold 3330 has formed a strong support. Gold will continue to buy on dips when it falls back to 3330 next week.

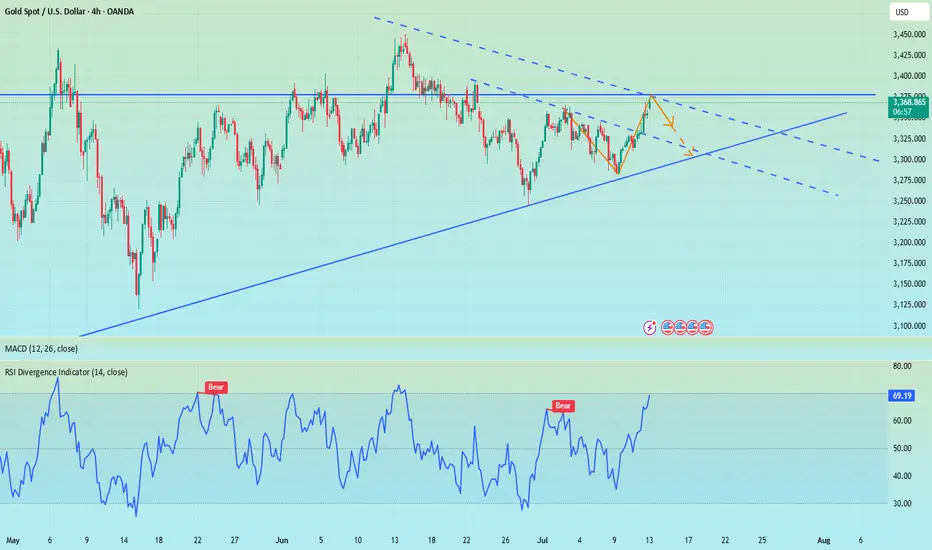
The impact of tariffs continues, shorting is expected to retrace📰 News information:
1. Focus on tomorrow's CPI data
2. Bowman's speech at the Federal Reserve
3. Tariff information outflows and countries' responses to tariff issues
📈 Technical Analysis:
During the weekend, the Trump administration's tariff information continued to come out, causing a large amount of funds to flow into the safe-haven market, triggering an escalation of market risk aversion. Although the collapse in the previous tariff remarks did hit the market's buying enthusiasm to a certain extent, the strong rise on Friday also stimulated the market's buying enthusiasm again. This, whether it is on the way down or on the way up, has attracted retail investors to a certain extent. As we judged on gold on Friday and the weekend, short-term bulls are undoubtedly strong. However, I think it is very dangerous to continue to chase long positions at high levels. Therefore, I tend to short-term and then consider continuing to chase long positions after the market retreats to the support level.
First of all, the CPI data will be released tomorrow. With inflation in the United States currently heating up, the Federal Reserve is undoubtedly resisting a rate cut in July. This has, to some extent, dampened the enthusiasm of bulls. Secondly, it is necessary to pay attention to the response of Europe and Japan to the tariff issue. Due to the timeliness, the current market expectations are undoubtedly limited.
In the short term, the RSI indicator is already seriously overbought. For today's operation arrangement, it is recommended to short at the rebound of 3365-3375. If the gold price continues to maintain a strong trend in the short term and breaks through this resistance area, it is time to stop loss. First of all, we should pay attention to whether 3355-3345 can be broken. Once it falls below the support of 3355-3345, we will need to see the 3330 line below, and it may even fall below 3300. Therefore, we also need to take precautions and follow up.
🎯 Trading Points:
SELL 3365-3375
TP 3355-3345
In addition to investment, life also includes poetry, distant places, and Allen. Facing the market is actually facing yourself, correcting your shortcomings, facing your mistakes, and exercising strict self-discipline. I share free trading strategies and analysis ideas every day for reference by brothers. I hope my analysis can help you.
FXOPEN:XAUUSD TVC:GOLD FX:XAUUSD FOREXCOM:XAUUSD PEPPERSTONE:XAUUSD OANDA:XAUUSD
XAU/USD(20250714) Today's AnalysisMarket news:
① Fed's Goolsbee: The latest tariff threat may delay rate cuts. ② The Fed responded to the White House's "accusations": The increase in building renovation costs partly reflects unforeseen construction conditions. ③ "Fed's megaphone": The dispute over building renovations has challenged the Fed's independence again, and it is expected that no rate cuts will be made this month. ④ Hassett: Whether Trump fires Powell or not, the Fed's answer to the headquarters renovation is the key.
Technical analysis:
Today's buying and selling boundaries:
3348
Support and resistance levels:
3395
3377
3366
3330
3319
3302
Trading strategy:
If the price breaks through 3366, consider buying in, with the first target price at 3377
If the price breaks through 3348, consider selling in, with the first target price at 3330

"GOLD Bandit Strategy: Loot Pips Like a Pro!🏆 GOLD HEIST ALERT! 🏆 XAU/USD Bandit Strategy (Swing/Day Trade)
Steal Pips Like a Pro! 💰🔓 Bull vs. Bear Raid Plan
🌟 Greetings, Market Pirates! 🌟
"The trend is your accomplice—time to loot!"
🔮 Thief’s Technical & Fundamental Intel:
XAU/USD (The Gold Vault) is flashing BEARISH signals, but we’re ready to raid both sides! Follow the heist blueprint below 👇
🎯 ENRY POINTS (Where to Strike!)
🏴☠️ LONG RAID (Bullish Thieves):
Break & Grab: Enter above 3450.00 (Pullback Zone)
"Wait for the breakout, then ambush!"
🐻 SHORT RAID (Bearish Bandits):
Sneak Attack 1: Sell below 3300.00
Sneak Attack 2: Sell below 3260.00 (Support Wall Cracked!)
🛑 STOP-LOSS (Escape Routes)
Bullish Trade: SL at 3230.00 (Guard your loot!)
Bearish Trade 1: SL at 3360.00 (Don’t get caught!)
Bearish Trade 2: SL at 3280.00 (Risk = Reward!)
(Adjust SL based on your risk appetite & lot size!)
💰 TAKE-PROFIT (Cash Out & Flee!)
Bullish Thieves: TP at 3270.00 (Or escape early!)
Bearish Bandits (1): TP at 3270.00
Bearish Bandits (2): TP at 3210.00 (Big score!)
⚠️ WARNING: Market Traps Ahead!
News = Danger Zone! 📢 Avoid new trades during high-impact news.
Trailing SL = Your Getaway Car! Lock profits & evade reversals.
📰 FUNDAMENTAL BACKUP (Why This Heist Works)
Bearish momentum fueled by macro trends, COT data, & sentiment.
Stay sharp—markets shift fast!
💥 BOOST THIS HEIST! 💥
Like & Share to strengthen our pirate crew! 🚀 More alerts = More profits!
🚨 Next Heist Coming Soon… Stay Tuned! 🚨

XAU/EUR Bear Raid – High-Risk, High-Reward Short!🔥 XAU/EUR GOLD HEIST – BEARISH BREAKOUT ALERT! 🚨💰
🌟 Greetings, Market Pirates & Profit Raiders! 🌟
(Hola! Oi! Bonjour! Hallo! Marhaba!)
🤑 TRADE IDEA: XAU/EUR (Gold vs. Euro) – BEARISH SWING PLAY
Based on the 🔥Thief Trading Style🔥, we’re plotting a strategic heist on Gold! Our analysis signals a short entry with high-risk, high-reward potential. The market is oversold, consolidating, and primed for a reversal trap—bullish traders are about to get ambushed!
🎯 TRADE SETUP (SWING/DAY TRADE)
📉 ENTRY:
"The Heist Begins!" Wait for Neutral Zone breakout near 2800.00 (Bearish confirmation).
Pro Tip: Place sell-stop orders above neutral OR sell-limit near swing highs/lows (15-30 min timeframe).
📌 Set an ALERT! Don’t miss the breakout moment.
🛑 STOP LOSS:
"Stop right there, cowboy! 🤠"
If using a sell-stop, set SL only after breakout (don’t get faked out!).
Thief SL Zone: 2870.00 (4H swing high).
⚠️ Adjust based on your risk & lot size! (Your money, your rules—but trade smart!).
🎯 TARGET:
2720.00 (or escape early if momentum fades).
🚨 CRITICAL ALERTS:
📰 News = Volatility! Avoid new trades during major releases.
🔒 Lock profits with trailing stops—don’t let winners turn to losers!
📉 Market Context: Bearish trend fueled by .
💥 BOOST THIS HEIST! 👊
🔥 Like & Boost to fuel our next Thief Trading raid!
🚀 More profitable setups coming—stay tuned!
(Disclaimer: Trade at your own risk. This is not financial advice.)

Gold rises after brief recovery
Let’s review the gold price for next week from July 14, 2025 to July 18, 2025
⭐️Gold Information:
Gold prices surged nearly 1% on Friday as sentiment soured over U.S. President Donald Trump’s controversial trade policy targeting Canada, while hinting at broader tariffs on other countries and copper. At the time of writing, XAU/USD was trading at $3,354, rebounding from an intraday low of $3,322.
On Thursday, Trump announced a 35% tariff on Canadian imports, but goods eligible under the 2020 USMCA trade agreement remain duty-free. He also expressed his intention to extend tariffs to most trading partners, proposing a basket of rates ranging from 15% to 20%.
With a light U.S. economic calendar, attention turns to comments from the Federal Reserve. Chicago Fed President Austan Goolsbee dismissed calls for rate cuts aimed at reducing government borrowing costs, stressing that the central bank's focus remains firmly on employment and price stability.
⭐️Personal Comment:
Growth with the trend, maintaining the accumulation price zone above 3300
🔥 Technical:
Based on the resistance and support levels of gold prices on the 4-hour chart, NOVA has identified the following important key areas:
Resistance: $3392, $3447
Support: $3330, $3308, $3246
GOLD Breakout or Fakeout? Thief’s Guide to Safely Rob the Move!🏆 XAU/USD Master Plan: Loot the Bullish Rally Before the Bearish Trap!💨💰
🌟 Hola! Bonjour! Hallo! Marhaba! 🌟
Attention Money Makers & Market Robbers! 🤑💸
🔥 Thief Trading Strategy Alert 🔥
Time to execute our gold heist on XAU/USD! Based on technical + fundamental looting tactics, here’s the play:
📈 ENTRY ZONES (4H TIMEFRAME)
BUY: Sneak in at Market Maker’s Buy Zone (Pullback Entries Only!).
SELL: "The vault’s wide open!"—Ambush bearish traps at risky highs (Red Zone).
🛑 STOP-LOSS (THIEF RULES)
Hide your SL at:
Past key lows OR nearest swing low (4H).
Adjust based on your risk, lot size, & robbery multiplier.
🎯 TARGET: 3525.00 (OR ESCAPE EARTHER!)
Scalpers: Long-side only! Trail your SL to lock loot.
Swing Thieves: Join forces—big pockets or small, execute the plan!
⚠️ WARNING: NEWS = VOLATILITY TRAPS!
Avoid new trades during news.
Use trailing SL to protect stolen profits.
📰 FUNDAMENTAL LOOT LIST (READ BEFORE HEIST!)
COT Report, Macro Data, Sentiment Outlook—Link in bi0! 🔗🤙🏻👉🏻👉🏻
Gold’s bullish now… but robbers adapt fast!
💥 BOOST THIS PLAN = STRONGER GANG!
Hit 👍 & Share—More boosts = More gold stolen daily!
Stay tuned… Next heist drops soon! 🚀🐱👤

GOLD UPDATE Hello friends🙌
📉Regarding the decline we had, which we also analyzed for you and said that the price is falling...
✔Now, with the support hunt identified, you can see that the price has returned strongly and broken the identified resistance and managed to reach higher ceilings, which also created a QM pattern, which increases the likelihood of the upward trend continuing.
Now with capital and risk management you can move towards your specified goals.
🔥Follow us for more signals🔥
*Trade safely with us*
