Gold rises after brief recovery
Let’s review the gold price for next week from July 14, 2025 to July 18, 2025
⭐️Gold Information:
Gold prices surged nearly 1% on Friday as sentiment soured over U.S. President Donald Trump’s controversial trade policy targeting Canada, while hinting at broader tariffs on other countries and copper. At the time of writing, XAU/USD was trading at $3,354, rebounding from an intraday low of $3,322.
On Thursday, Trump announced a 35% tariff on Canadian imports, but goods eligible under the 2020 USMCA trade agreement remain duty-free. He also expressed his intention to extend tariffs to most trading partners, proposing a basket of rates ranging from 15% to 20%.
With a light U.S. economic calendar, attention turns to comments from the Federal Reserve. Chicago Fed President Austan Goolsbee dismissed calls for rate cuts aimed at reducing government borrowing costs, stressing that the central bank's focus remains firmly on employment and price stability.
⭐️Personal Comment:
Growth with the trend, maintaining the accumulation price zone above 3300
🔥 Technical:
Based on the resistance and support levels of gold prices on the 4-hour chart, NOVA has identified the following important key areas:
Resistance: $3392, $3447
Support: $3330, $3308, $3246
Goldprice
GOLD Breakout or Fakeout? Thief’s Guide to Safely Rob the Move!🏆 XAU/USD Master Plan: Loot the Bullish Rally Before the Bearish Trap!💨💰
🌟 Hola! Bonjour! Hallo! Marhaba! 🌟
Attention Money Makers & Market Robbers! 🤑💸
🔥 Thief Trading Strategy Alert 🔥
Time to execute our gold heist on XAU/USD! Based on technical + fundamental looting tactics, here’s the play:
📈 ENTRY ZONES (4H TIMEFRAME)
BUY: Sneak in at Market Maker’s Buy Zone (Pullback Entries Only!).
SELL: "The vault’s wide open!"—Ambush bearish traps at risky highs (Red Zone).
🛑 STOP-LOSS (THIEF RULES)
Hide your SL at:
Past key lows OR nearest swing low (4H).
Adjust based on your risk, lot size, & robbery multiplier.
🎯 TARGET: 3525.00 (OR ESCAPE EARTHER!)
Scalpers: Long-side only! Trail your SL to lock loot.
Swing Thieves: Join forces—big pockets or small, execute the plan!
⚠️ WARNING: NEWS = VOLATILITY TRAPS!
Avoid new trades during news.
Use trailing SL to protect stolen profits.
📰 FUNDAMENTAL LOOT LIST (READ BEFORE HEIST!)
COT Report, Macro Data, Sentiment Outlook—Link in bi0! 🔗🤙🏻👉🏻👉🏻
Gold’s bullish now… but robbers adapt fast!
💥 BOOST THIS PLAN = STRONGER GANG!
Hit 👍 & Share—More boosts = More gold stolen daily!
Stay tuned… Next heist drops soon! 🚀🐱👤

GOLD UPDATE Hello friends🙌
📉Regarding the decline we had, which we also analyzed for you and said that the price is falling...
✔Now, with the support hunt identified, you can see that the price has returned strongly and broken the identified resistance and managed to reach higher ceilings, which also created a QM pattern, which increases the likelihood of the upward trend continuing.
Now with capital and risk management you can move towards your specified goals.
🔥Follow us for more signals🔥
*Trade safely with us*

GOLDGOLD was spot on last week, expect a small correction one more push up towards 3380 level and then we will see the reaction.
Disclosure: We are part of Trade Nation's Influencer program and receive a monthly fee for using their TradingView charts in our analysis.

Gold trend analysis: long positions are still the general trend
After opening on Friday morning, it started to rise directly. The opening was the low of the day and continued into the European session, reaching the highest point near 3340-45, which was also close to the previous high point. After touching this position, the bears also ushered in a symbolic correction and tried to test the position above 30 many times. However, it finally catered to the strength of the bulls and began to break through in the US session, reaching the highest point near 3369, and also pierced the previous high of 3365 for the first time, and then retreated and corrected again. The daily line also closed in the form of a large positive line with an upper lead. The gold hourly line continued to diverge from the golden cross upward bullish arrangement. The gold bullish strength is still there, and the gold moving average support has also moved up to around 3320-25. After gold broke through the 3345 line on Friday, it rose all the way, reaching the highest point of 3369. We continue to be bullish on gold when it falls back to the 3320-25 line next week. The short-term 3320-25 line of gold has formed a strong support, and gold will continue to buy on dips when it falls back next week. If your current gold operation is not ideal, I hope Yulia can make your investment smooth. Welcome to communicate with us!
From the 4-hour analysis, the support below is around 3320-25, and the short-term bullish strong dividing line is around 3365-3370. The overall low-multiple bullish rhythm remains unchanged. Before the daily level falls below the 3300 mark, any retracement is a long opportunity. Be cautious about short positions against the trend.
Gold operation strategy:
Gold retracement 3320-25 line long, stop loss 3313, target 3365-70 line, break and continue to hold

XAUUSD Daily Sniper Plan – July 14, 2025Hey team 👋 and welcome to a fresh new week on the charts!
We’re starting this Monday without any major news — just pure price action, clean zones, and structure doing all the talking. No distractions. No excuses. Let’s lock in our focus and let the market show us where the edge is.
🔸 Bias: Bearish while below 3390
Last week’s rejection from the H1 premium zone (around 3375) created clear signs of exhaustion. Price is now forming lower highs and lower lows, with clean CHoCHs on both H1 and M15. Until we reclaim 3390, we remain bearish — waiting for the next lower high to form.
🔽 Sniper Sell Zones (above current price)
3360–3370 → H1 premium FVG + CHoCH OB + EMA5 cap
3380–3390 → Inducement zone + internal imbalance + RSI divergence
🔼 Sniper Buy Zones (below current price)
3310–3320 → Discount FVG + BOS base + HL support
3280–3290 → Final HL structure zone + fib 61.8% + OB + RSI oversold
🟡 Decision Zone:
3330–3340 → Neutral zone
→ Wait for break and retest or rejection confirmation.
→ No setup = no trade.
🧠 Battle Plan – Execution Scenarios:
🔴 Scenario A – Bearish Setup Active:
If price returns to 3360–3370 or 3380–3390 and shows M15/M30 rejection → enter short.
Target: 3330 → 3310.
If 3390 is broken and held → cancel short bias.
🟢 Scenario B – Bullish Setup Activated:
If price sweeps 3320 or 3290 and reacts with strong bullish PA (engulfing or CHoCH) → enter long.
Target: 3340 → 3360.
No confirmation = stay flat, do not anticipate.
🟡 Scenario C – No Reaction / Choppy Flow:
If price consolidates between 3330–3340 without clean rejection or break → wait.
Let price show its hand. Today is Monday — we need clarity, not emotion.
Every level in this plan was drawn with purpose — no shortcuts, no borrowed zones.
If you value structure, discipline, and originality in your trading, you’re in the right place.
Your support means everything — I see every 🚀 and every comment, and I appreciate this community deeply.
Let’s keep growing, with real work and real structure.
Follow GoldFxMinds — we stay sharp, we stay true. 💛
📎 Trade Nation Disclaimer
Chart and structure based on Trade Nation broker feed on TradingView. For educational purposes only — not financial advice.

Bitcoin pushes higher, but its not the only game in townBitcoin is up around 26% this year. A strong gain. But it’s not alone. The higher Bitcoin rises, the less the gains become in percentage terms. It's now in a different league, so a $1,000 or $10,000 move its necessarily what it used to be.
Meanwhile, Gold, silver and copper have also pushed higher in 2025. The Nasdaq 100 is up too. All signs point to a weakening US dollar.
When risk assets and commodities rally together, it's a signal. Investors are shifting. Not out of fear, but to diversify away from the dollar. This is a theme that’s building strength.
Gold is up nearly over 25% YTD. Silver even more. Copper, the industrial bellwether, has joined the rally. These aren’t just trades. They’re strategic moves. A hedge against dollar debasement, inflation, and long-term fiscal risks in the US.
The Nasdaq’s rise tells a similar story. Tech stocks benefit when yields fall and the dollar softens. Big tech also has global revenue exposure. A weaker dollar inflates their earnings in foreign currencies.
What ties all this together? Loss of confidence in the dollar as the sole reserve hedge. Too much debt, too much printing. Central banks know it. They’ve been buying gold for years. Now, retail and institutional investors are catching on.
Bitcoin, the digital alternative to gold, gets the headlines. But it’s part of a broader move. The USD remains the world’s most important currency. That’s not changing tomorrow. But its dominance is being questioned in ways we haven’t seen in decades.
This isn’t just a crypto rally. It’s a dollar diversification play. And it’s gaining momentum.
The forecasts provided herein are intended for informational purposes only and should not be construed as guarantees of future performance. This is an example only to enhance a consumer's understanding of the strategy being described above and is not to be taken as Blueberry Markets providing personal advice.

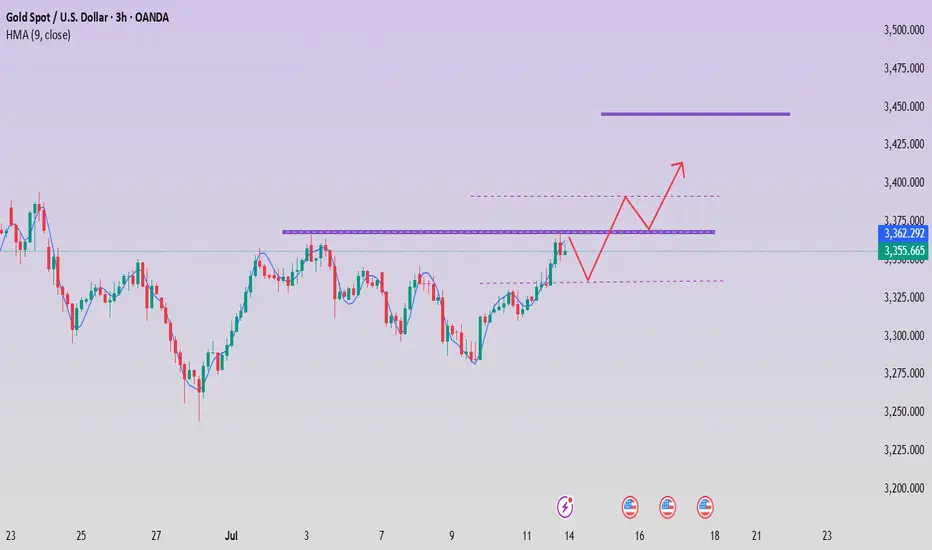
Gold breaks through. Will it continue?After breaking through the position predicted by Quaid on Friday, gold rose strongly and finally maintained the fluctuation range of 3345-3360 that I predicted. Gold bulls are now strong. If there is no major change in the news over the weekend, the price will likely continue to rise after a slight decline at the beginning of next week. I think we can still follow the strategy of Dutou.
The 1-hour moving average of gold continues to diverge with a golden cross and upward bullish arrangement, and the bullish momentum of gold is still there. The current strong support level of gold has also moved up to around 3330. After gold broke through 3330 over the weekend, the price fell back to 3330 and stabilized and rose twice. In the short term, this position has formed a strong support.
There is a high probability that the price will have a small correction at the beginning of next week. We can continue the bullish strategy after the price falls back.
Market transactions should abandon personal preferences. Preconceived subjective consciousness will eventually be taught a lesson by the market. The market is always right. We should follow the fluctuations of the market. Instead of having a head full of random thoughts. There are always traces of market changes, and you need to have the ability to discover them or follow those who have the ability. The market changes rapidly, so pay attention to more timely changes.

Gold - This is the official top!Gold - TVC:GOLD - might top out soon:
(click chart above to see the in depth analysis👆🏻)
Since Gold confirmed its rounding bottom in 2019 it rallied more than +200%. Especially the recent push higher has been quite aggressive, squeezing all bears. But now Gold is somehow unable to create new all time highs, which could constitute the a top formation.
Levels to watch: $3.500, $3.000
Keep your long term vision🙏🙏
Philip (BasicTrading)

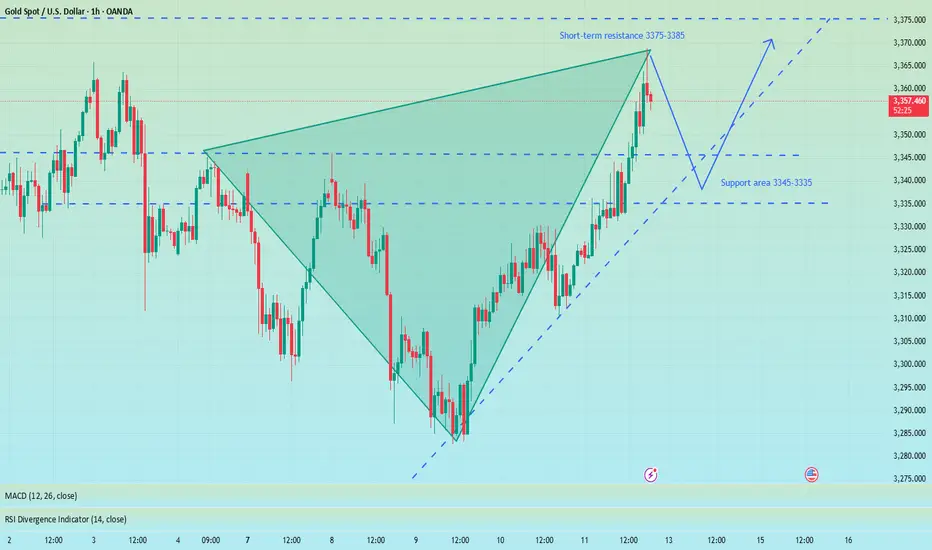
Precisely look at 3365 and pay attention to the pullback chanceAt present, gold has risen as expected and reached the highest level near 3368. The upper 3375-3385 constitutes a short-term resistance level. At present, the bullish momentum is still relatively strong, and the short-term support structure below has been formed. I still maintain the views of the previous transaction and wait for a second trading opportunity when it pulls back below. Although the 1H chart shows that the current trend remains strong and the retracement is small, it is necessary to remain cautious - even if the market is strong, it is not recommended to chase long easily, and the risk of a deep correction in the gold price must be guarded against. First, pay attention to the support area of 3345-3335 below. If it falls back to this level, you can consider going long with a light position.
OANDA:XAUUSD
Gold price rises as expected, is 3400 far behind?
💡Message Strategy
Trump announced on Friday that he would impose a 35% comprehensive tariff on Canadian imports, which will take effect on August 1, which caused a market shock. As Canada's largest trading partner, the United States accounts for 76% of Canada's exports in 2024. This move will undoubtedly have a profound impact on the global supply chain and trade pattern.
In addition, Trump's tariff policies on copper and Brazil have further exacerbated market uncertainty, pushing gold prices to break through key technical resistance levels and move towards the $3,400 mark.
The Fed's policy moves also have an important impact on market sentiment. The minutes of the June meeting released on Wednesday showed that the Fed's internal concerns about tariffs potentially pushing up inflation are growing. The minutes pointed out that "most participants emphasized that tariffs could have a more lasting impact on inflation."
Despite this, the Fed reiterated that it would remain on the sidelines and wait for further clarity on inflation and economic activity. At present, according to the market forecast of the CME FedWatch tool, the probability of a 25 basis point rate cut in September has risen to 62.9%, reflecting investors' expectations that the Fed may ease early.
📊Technical aspects
Yesterday’s strategic recommendations mentioned that the effective support level for gold was in the 3280-3285 range. Today, gold fell back to the 3280 level, stabilized, and began to rise, perfectly reaching the target.
From a technical perspective, gold has shown significant upward momentum this week. The daily chart shows that the price of gold has successfully broken through the symmetrical triangle resistance and touched the 20-day simple moving average (SMA) of $3,339.97.
This breakthrough marks a strengthening of the short-term technical pattern, showing that bulls have the upper hand. The relative strength index (RSI) has rebounded to around 55 on the daily chart and is trending upward, indicating that there is slight bullish momentum in the market.
However, in the short term, the upside of gold may be limited by the 23.6% Fibonacci retracement level ($3,370). If this level can be effectively broken, the psychological level of $3,400 and the June high of $3,452 will become the next target.
💰Strategy Package
Long Position:3335-3340,SL:3320,Target: 3370-3400

The idea remains unchanged, NY3360-3365 is emptyThe idea remains unchanged during the NY period. Although gold has currently reached a high of around 3348, it has not stabilized above it. If gold successfully breaks through 3350 in the short term, it may reach 3360 or 3365. In the 4H cycle, it presents a step-by-step upward pattern. The K-line is temporarily fluctuating sideways near the upper track. At the same time, 3345 has formed a double top pattern. Combined with Thursday's low of 3310, an inverted triangle oscillation range of 3345-3310 is formed in the short term. This week's trend needs to pay close attention to the breakthrough direction of this range. Short-term long positions can be taken after the trend is confirmed.
XAUUSD@3330-3320 long TP 3345-3365
OANDA:XAUUSD

Breaking through 3350, the bullish trend remains unchanged📰 News information:
1. Pay attention to the impact of Trump administration tariffs
📈 Technical Analysis:
Possible interest rate cuts and tariffs in the fall continue to stimulate risk aversion. Currently, the 3300-3285-3310 points form a head and shoulders bottom pattern. The bullish momentum is relatively strong in the short term. Our short trade near 41 has hit the stop loss. As I wrote before, gold may continue to rise to 3360 or 3365 after breaking through 3350. The current RSI indicator is seriously oversold, so be cautious when operating in a unilateral trend in the short term. The safe way is to wait for a pullback to 3345-3340 to go long
🎯 Trading Points:
BUY 3345-3340
TP 3360-3370-3400
In addition to investment, life also includes poetry, distant places, and Allen. Facing the market is actually facing yourself, correcting your shortcomings, facing your mistakes, and exercising strict self-discipline. I share free trading strategies and analysis ideas every day for reference by brothers. I hope my analysis can help you.
TVC:GOLD FXOPEN:XAUUSD
Bulls rise, beware of Friday's black swan📰 News information:
1. Pay attention to the impact of Trump administration tariffs
📈 Technical Analysis:
Gold rose as expected and touched around 3344, which was in line with our judgment last night. However, from the market point of view, the K-line entity did not stand firmly above 3335. There are only two possible scenarios for the subsequent trend of gold. One is to stand directly above and test the 3345 resistance again, and the other is to fall in the European and American markets due to timeliness and retest the key support of 3310. At present, the upper positions are 3345 and 3365 respectively. If 3345 is repeatedly not broken and the European market falls with acceleration, then the 3310 area will still need to take back the long positions, which can be defined as a long wide-range wash. 3330-3320 is a very critical support position, and 3310 is a strong support. Therefore, the best position for shorting during the day is around 3335-3345, with the target at 3330-3320. Consider long positions after falling back and getting support here.
🎯 Trading Points:
SELL 3335-3345
TP 3330-3320
BUY 3330-3320
TP 3345-3365
In addition to investment, life also includes poetry, distant places, and Allen. Facing the market is actually facing yourself, correcting your shortcomings, facing your mistakes, and exercising strict self-discipline. I share free trading strategies and analysis ideas every day for reference by brothers. I hope my analysis can help you.
OANDA:XAUUSD PEPPERSTONE:XAUUSD FOREXCOM:XAUUSD FX:XAUUSD FXOPEN:XAUUSD TVC:GOLD

Trump's tariff news stimulates gold to explode!
📌 Driving Events
Gold prices rose for the third consecutive day and are expected to close higher this week. The trend turned in favor of gold buyers as tariff tensions intensified. US President Trump announced new tariffs, exacerbating concerns about a trade war.
📊Personal Comments:
Signs of instability in Trump's trade policy have once again hit investor confidence, reviving safe-haven demand for gold. In the absence of any top US economic data, the market will continue to focus on trade headlines. Weekend fund flows may also drive gold price movements.
⭐️Set Gold Price:
🔥Sell Gold Area: 3360-3369 SL 3374
TP1: $3355
TP2: $3342
TP3: $3325
⭐️ Note: Labaron hopes that traders can properly manage their funds
- Choose a lot size that matches your funds
Gold resumes its rally
From the 4-hour analysis, the upper side focuses on the short-term suppression of 3345-50. Today's lower support focuses on the vicinity of 3309-16. The short-term bullish strong dividing line is near 3295-3301. The overall bullish rhythm of high-altitude and low-multiple continues to remain unchanged. Before the daily level falls below the 3300 mark, any retracement is a long opportunity. Short orders against the trend should be cautious.
Gold operation strategy:
1. Go long on gold when it falls back to 3316-25, stop loss at 3307, target at 3340-45, and continue to hold if it breaks;
2. Go short on gold when it rebounds to 3345-50, stop loss at 3357, target at 3320-3326, and continue to hold if it breaks;

Gold prices are faking declines but rising, so beware
💡Message Strategy
As trade uncertainty heats up, gold welcomes safe-haven buying
After the Trump administration issued a series of tariff notices against many countries around the world, market risk aversion has intensified. The US President announced on Wednesday that a new 50% tariff on copper imports will be imposed from August 1, and reiterated that "the deadline will not be extended for countries that have received the notice, and any retaliatory measures will be responded to by tax increases."
This move has triggered market concerns about the slowdown in global economic growth, and traditional safe-haven assets such as gold have been sought after. The current gold price has rebounded significantly from the one-and-a-half-week low hit the previous day.
According to market surveys, safe-haven funds are being reconfigured, especially in the context of the unclear Fed policy and the direction of the US dollar, gold has become a non-yielding asset preferred in the short term.
📊Technical aspects
From the 1H chart, the gold price has approached the 100-period simple moving average (SMA), which is currently located around 3,335, forming an initial resistance. If the price effectively breaks through this area, the next resistance level will be in the 3,345-3,350 range. Once it breaks through, it may trigger a short-covering market, pushing the gold price back to the 3,400 integer mark.
If gold breaks above 3,360, it will confirm the short-term bottom and open the door to re-challenging the high point of the year. On the contrary, if the gold price falls below 3,300 again, it may retest the 3,280 support, and further downside space will extend to the July low of 3,247.
For now, the performance of gold bulls is relatively prominent, and it is recommended to do more on the pullback.
💰Strategy Package
Long Position:3300-3310,SL:3285,Target: 3340-3350

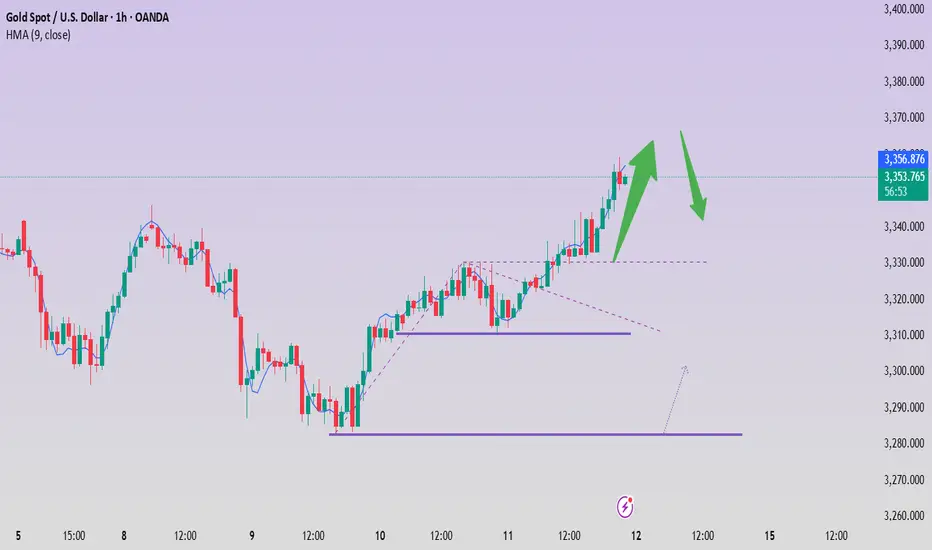
XAUUSD Approaches Key Resistance – Will 3,345 Hold or Break?As of July 11, 2025, gold (XAUUSD) is showing a mild recovery around 3,331 USD, following a rebound from the 3,318–3,322 USD support zone. This move comes amid a wave of macroeconomic data and global monetary policy expectations that continue to weigh heavily on gold’s intraday direction.
1. Key Fundamentals Impacting XAUUSD Today
Dollar Index (DXY) remains strong near 106.0 – sustaining pressure on gold due to a firm greenback.
U.S. 10-year Treasury yields are holding above 4.36%, reflecting persistent market expectations that the Fed may keep interest rates elevated in the near term.
June CPI data (YoY) came in at 2.4%, slightly below forecast (2.5%), increasing hopes for a potential rate cut in Q4 – a short-term bullish catalyst for gold
Geopolitical tensions remain subdued, limiting safe-haven inflows into gold in the medium term.
Upcoming U.S. PPI data this week could trigger volatility, depending on whether it surprises to the dovish or hawkish side.
2. Technical Analysis – XAUUSD on H4 Timeframe
Support zone: 3,316 – 3,322 USD, aligning with the 0.5–0.618 Fibonacci retracement of the latest bullish leg.
Resistance zone: 3,345 USD – a confluence of previous highs and 0.618 Fibonacci level of the prior correction wave.
EMA outlook: Short-term EMA is turning upward, indicating potential bullish momentum building.
RSI: Recovering toward 60 but not yet overbought – a sign of healthy upside potential, though confirmation is still needed.
3. Trade Scenarios to Consider
Bullish Breakout Scenario (if price breaks 3,345 USD):
Entry: Buy on H4 candle close above 3,345 USD
Target: 3,357 – 3,370 USD
Stop-loss: Below 3,322 USD
Bearish Rejection Scenario (if price fails at 3,345 USD):
Entry: Sell on bearish reversal candlestick (e.g., pin bar, engulfing) at 3,345 USD
Target: Revisit support at 3,318 – 3,309 USD
Stop-loss: Above 3,350 USD
Gold is trading in a decision zone between short-term support and a major resistance barrier. While macro fundamentals are slightly leaning bullish after soft CPI data, strong dollar strength and high bond yields still cap upside momentum. Traders are advised to wait for price confirmation at 3,345 USD before committing to directional setups.
Follow for more daily gold trading strategies, and save this analysis if you found it useful!

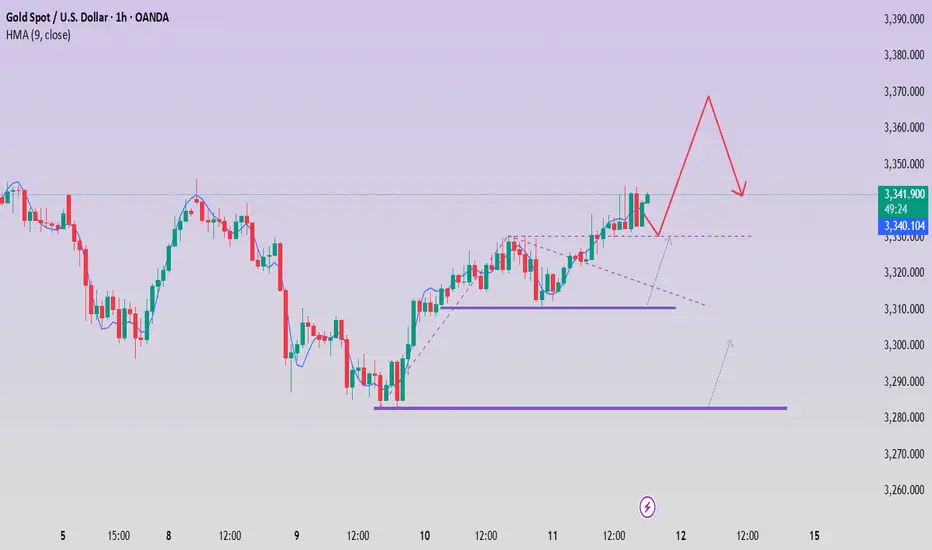
XAUUSD Rises Steadily After RetestXAUUSD Rises Steadily After Retest – Buy Zone Showing Strong Effectiveness
Technical Analysis – July 11, 2025 (H4 Timeframe)
Gold (XAUUSD) is currently trading around $3,345, continuing its steady upward move from the key confluence support at $3,309–$3,318. The bullish momentum has strengthened following a clean break and successful retest of the previous bearish structure.
1. Updated Technical Data:
Current Price: $3,345.10
Fibonacci Retracement:
0.618 at $3,309.69
0.5 at $3,318.91
Recent Swing High (1.0 Fibo): $3,345.69
RSI (H4 Estimate): Around 62 – nearing overbought territory, but still has room for further upside
EMA20/EMA50: EMA20 has crossed above EMA50 – short-term trend is bullish
Next Resistance: $3,357.97 (previous swing high)
Immediate Support: $3,318–$3,309 (Fibonacci confluence zone)
2. Price Action Insight:
Following the correction low at $3,287.02, gold has shown strong recovery with a clear impulsive wave formation. The previous Buy Zone between $3,309–$3,318 has proved highly effective, leading to the current bullish breakout.
A classic “break–retest–continuation” pattern is forming on the H4 chart, suggesting that bulls remain in control unless disrupted by macro events.
3. Suggested Trading Strategies:
Primary Scenario: Buy on Dip
Entry Zone (on retest): $3,330 – $3,318
Stop Loss: Below $3,308
Take Profit 1: $3,345 (already reached)
Take Profit 2: $3,357
Extended Target: $3,368 – $3,372 if $3,357 breaks decisively
Alternative Scenario: Short from $3,357 if Reversal Signal Appears
Stop Loss: Above $3,362
Take Profit: Toward $3,330 – $3,318 support
4. Conclusion for Today:
Short-Term Trend: Bullish
Medium-Term Outlook: Neutral to bullish – watch $3,357 breakout for confirmation
Main Bias: Buy the dip and hold toward resistance at $3,357–$3,372
Follow for more real-time trading strategies and insights. Save this post if you find it helpful!

Gold in Equilibrium, Possible Minor Pullback📊 Market Overview:
• Spot gold currently trades around 3,332–3,333 USD/oz
• A slightly weaker US dollar and declining Treasury yields are supporting gold
• Yet strong US jobs data and delayed Fed rate cuts are limiting gold’s upside
• Escalating trade tensions and new tariffs keep safe-haven demand intact
📉 Technical Analysis:
• Resistance: 3,345–3,350 USD, repeatedly tested zone
• Support: 3,316–3,322 USD, strong bottom near 3,310 USD
• EMA 9: Price hovering around it—no clear trend direction
• Momentum/RSI: RSI fading from overbought, momentum weakening
• Candle Patterns/Volume: Narrow consolidation, forming pennant structure
📌 Outlook:
Gold is likely to remain range-bound or dip slightly if USD strengthens. Conversely, renewed economic headwinds or Fed dovishness could push gold higher, especially on a break above 3,345 USD.
💡 Suggested Trade Strategy:
SELL XAU/USD : 3.347–3.350
🎯 TP: 40/80/200 pips
❌ SL: 3.355
BUY XAU/USD : 3.316–3.319
🎯 TP: 40/80/200 pips
❌ SL: 3.310

The weekend closed higher to around 3360
📌 Driving Events
Gold prices (XAU/USD) were on track to rise for the third consecutive day on Friday, climbing to the upper limit of this week's trading range as escalating trade tensions fueled safe-haven demand. Amid a significant intensification of global trade disputes, U.S. President Donald Trump this week sent formal notices to multiple trading partners detailing individual tariff rates that will take effect on August 1 if no agreement is reached. This has disrupted investor sentiment, weighed on risk assets, and provided solid support for gold.
Meanwhile, expectations of an imminent rate cut by the Federal Reserve (Fed) have cooled after last week's strong U.S. jobs data. As a result, the U.S. dollar (USD) remained firm, holding near more than two-week highs set on Thursday. A stronger dollar could limit upside for the non-yielding gold in the short term. Therefore, traders could look for a sustained breakout before going further bullish on the XAU/USD pair.
📊Personal comments:
Gold price broke through 3330, maintained good buying pressure, and rebounded over the weekend
⭐️Set gold price:
🔥Sell gold area: 3367-3369 SL 3374
TP1: $3355
TP2: $3342
TP3: $3325
🔥Buy gold area: $3306-$3308 SL $3301
TP1: $3315
TP2: $3325
TP3: $3338
⭐️ Note: Labaron hopes that traders can properly manage their funds
- Choose a lot size that matches your funds
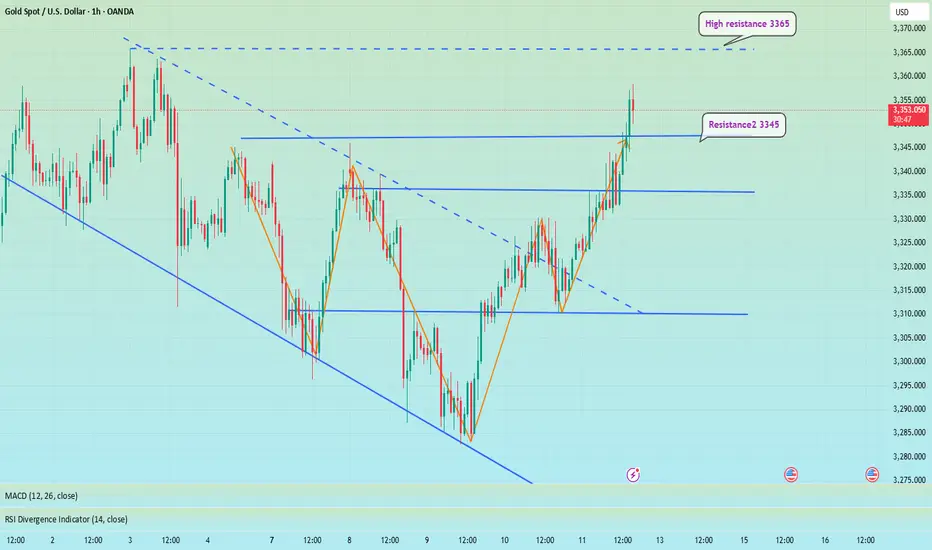
The price fell back. Watch out for a breakthrough.After reaching the resistance position near 3345 predicted by Quaid, the price fell back slightly, and the price fluctuated around 3335 so far.
From the hourly chart, before the price stabilizes at 3345, it is likely to maintain a range of 3330-3345. 3330-3345 is a temporary range. If it stands firm and breaks above 3345 again, the fluctuation range will become 3345-3360.
On the contrary, if it falls below 3330, the range may drop to 3320-3330. However, as long as the downward trend does not fall below 3320, gold will still maintain a bullish trend. If the price breaks down below 3320, today’s trend will be reversed.
As long as it is above 3320, gold will maintain a bullish trend today.
On the last trading day of this week, I wish all traders a good harvest.

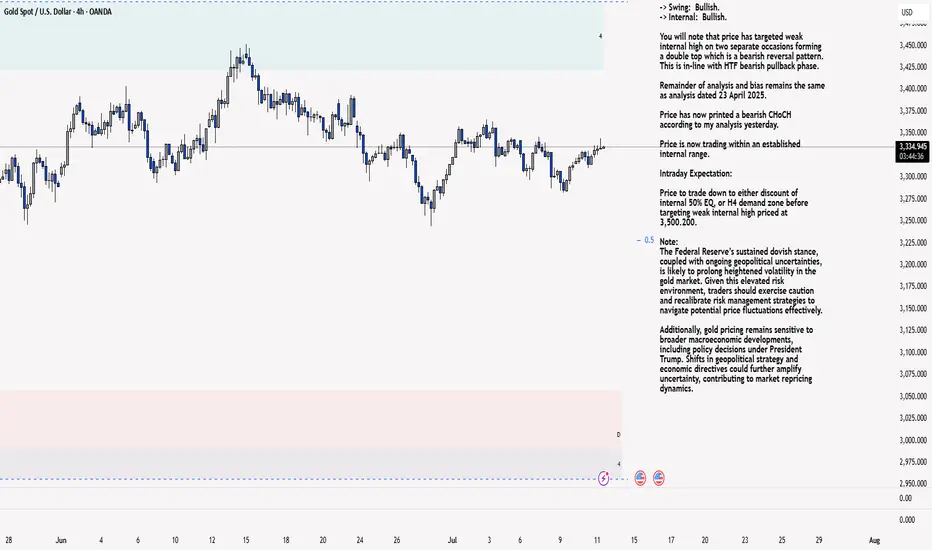
XAU/USD 11 June 2025 Intraday AnalysisH4 Analysis:
-> Swing: Bullish.
-> Internal: Bullish.
You will note that price has targeted weak internal high on two separate occasions forming a double top which is a bearish reversal pattern. This is in-line with HTF bearish pullback phase.
Remainder of analysis and bias remains the same as analysis dated 23 April 2025.
Price has now printed a bearish CHoCH according to my analysis yesterday.
Price is now trading within an established internal range.
Intraday Expectation:
Price to trade down to either discount of internal 50% EQ, or H4 demand zone before targeting weak internal high priced at 3,500.200.
Note:
The Federal Reserve’s sustained dovish stance, coupled with ongoing geopolitical uncertainties, is likely to prolong heightened volatility in the gold market. Given this elevated risk environment, traders should exercise caution and recalibrate risk management strategies to navigate potential price fluctuations effectively.
Additionally, gold pricing remains sensitive to broader macroeconomic developments, including policy decisions under President Trump. Shifts in geopolitical strategy and economic directives could further amplify uncertainty, contributing to market repricing dynamics.
H4 Chart:
M15 Analysis:
-> Swing: Bullish.
-> Internal: Bullish.
H4 Timeframe - Price has failed to target weak internal high, therefore, it would not be unrealistic if price printed a bearish iBOS.
The remainder of my analysis shall remain the same as analysis dated 13 June 2025, apart from target price.
As per my analysis dated 22 May 2025 whereby I mentioned price can be seen to be reacting at discount of 50% EQ on H4 timeframe, therefore, it is a viable alternative that price could potentially print a bullish iBOS on M15 timeframe despite internal structure being bearish.
Price has printed a bullish iBOS followed by a bearish CHoCH, which indicates, but does not confirm, bearish pullback phase initiation. I will however continue to monitor, with respect to depth of pullback.
Intraday Expectation:
Price to continue bearish, react at either M15 supply zone, or discount of 50% internal EQ before targeting weak internal high priced at 3,451.375.
Note:
Gold remains highly volatile amid the Federal Reserve's continued dovish stance, persistent and escalating geopolitical uncertainties. Traders should implement robust risk management strategies and remain vigilant, as price swings may become more pronounced in this elevated volatility environment.
Additionally, President Trump’s recent tariff announcements are expected to further amplify market turbulence, potentially triggering sharp price fluctuations and whipsaws.
M15 Chart: