Gold is rising. Second starting point?Information summary:
1. The US dollar index has experienced the longest consecutive monthly decline since 2017. The weakening of the US dollar has increased the attractiveness of gold denominated in US dollars to non-US dollar holders, becoming an important support factor for gold prices.
2. Trump's continued pressure on the Federal Reserve to cut interest rates has formed a resonance effect with the weakening of the US dollar, which has jointly pushed up the short-term attractiveness of gold.
Multiple factors are intertwined, and gold has risen slightly again.
Market analysis:
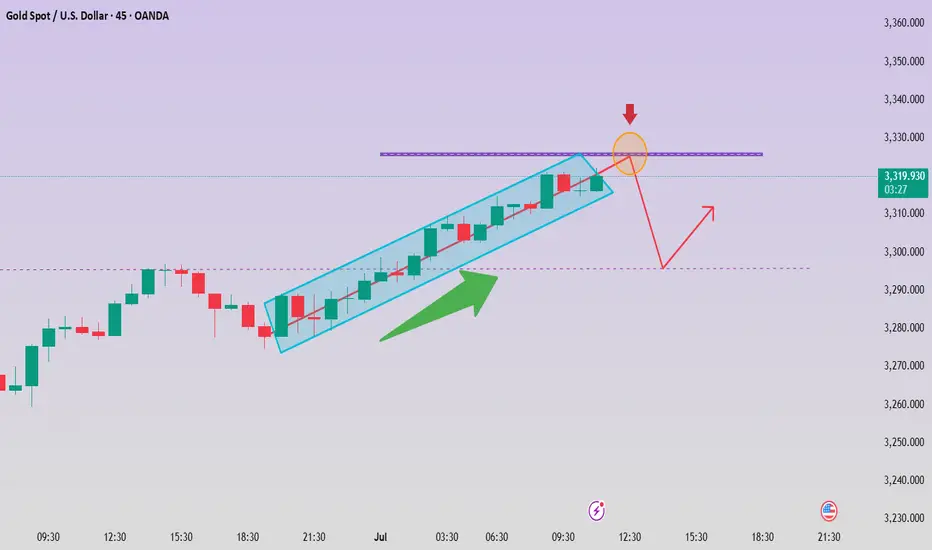
Gold bottomed out and rebounded on Monday, showing a positive closing, and above 3300. After falling sideways for 5 consecutive trading days last week, although it fell for a short time on Monday, it did not continue. In this case, whether a new high can be reached, the watershed is the 3295 line. As long as the European session breaks the high, the long position is near the starting point of 3305 in the early trading session.
At present, the main focus is on the upper resistance around 3325. It opened directly upward on Tuesday, but did not break through too much space, unless it directly broke through 3325-3330; then the next resistance is around 3340. At present, the bulls are still running at a high level. The upward trend line generated after the reversal is more obvious, and the trend line has good effectiveness.
Since the current market is in the first wave of rise, the high point has not been confirmed. Quaid believes that when the high point is clear and the price falls back to the support area, consider entering the market to go long based on the support level. Of course, aggressive trading can choose to buy around 3320 and choose a suitable high point to take profit.
Operation strategy:
Short near the rebound 3340, stop loss 3350, profit range 3310-3300
Long near the fall 3305, stop loss 3290, profit range 3320-3335
Goldpriceaction

This is the reason why gold suddenly "changed its face"!
📣 Gold News
Spot gold closed up $28.59, or 0.87%, at $3,302.71 per ounce on Monday. Gold prices fell to around $3,246 per ounce in early Asian trading, the lowest level since May 29.
At 21:30 Beijing time on Tuesday, Federal Reserve Chairman Powell, European Central Bank President Lagarde, Bank of England Governor Bailey, Bank of Japan Governor Kazuo Ueda, and Bank of Korea Governor Lee Chang-yong will hold a group meeting.
Last Tuesday and Wednesday, Federal Reserve Chairman Powell attended a congressional hearing and said that the Fed needs more time to observe whether tariffs make inflation rise higher before considering cutting interest rates.
Powell said in his congressional testimony that he and most Fed officials expect inflation to start to pick up soon, and the Fed is not in a hurry to cut interest rates before that.
Powell said: "At present, we have good conditions to wait and further understand the possible development path of the economy before considering whether to adjust the policy stance." Yesterday, gold opened at $3381.6 and quickly fell back, reaching a low of $3248.8, then rebounded, rebounded in the early trading and touched $3270 and fell again, gold fell back, reaching a low of $3259.4, then gold did not continue to fall, and rebounded. Gold continued to rebound in the European and American markets, with the highest rebound in the US market reaching $3309.4, and finally closed at $3002.9 in the late trading. The monthly line closed with a long upper shadow line and a shooting star pattern. After such a pattern ended, today's gold rebounded high, and the upper resistance focused on the $3326 line. The rebound relied on the resistance below here to short, and the lower side looked at the $3295 line.
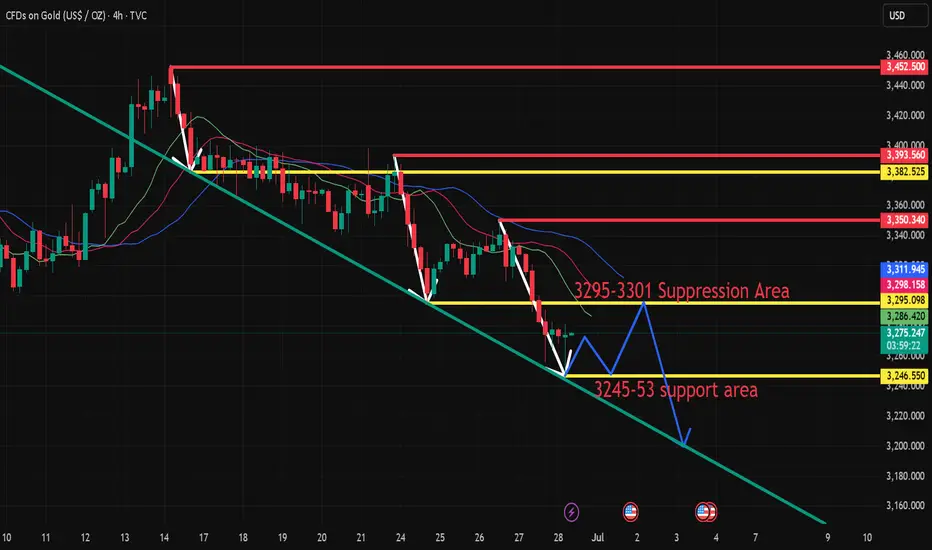
Gold fluctuates upward. Is the decline over?On Monday, gold opened at around 3282, and then fell back quickly to around 3247 under pressure; the downward low was blocked, and then rebounded strongly to around 3297; the market currently maintains a small upward trend.
At present, we need to focus on the resistance range of the upward trend.
From the 4-hour chart, the upper short-term resistance is around 3295-3300, followed by the suppression range of 3310-3315. The main direction of short-term operations maintains the rebound short-selling strategy. The support below is around 3255; the overall short-term operation relies on 3260-3300 to maintain the main tone of high-altitude participation unchanged.
Operation strategy:
Short near 3305, stop loss 3320, profit range 3270-3260.
A new week has just begun. I wish you all gain something from the market fluctuations.

Gold long-short strategy US trading range operation
Gold prices (XAU/USD) recovered some of their losses during Monday's Asian trading session, driven by expectations that the Federal Reserve may cut interest rates further this year (and perhaps earlier than previously expected). This prospect weighed on the dollar, making dollar-denominated gold more attractive to overseas buyers.
However, the recent improvement in global risk sentiment (driven by the US-China trade agreement and the Israeli-Iranian ceasefire agreement) may reduce the safe-haven demand for gold. Investors will now turn their attention to upcoming comments from Federal Reserve officials, with Atlanta Fed President Rafael Bostic and Chicago Fed President Austan Goolsbee expected to speak later in the day.
Gold prices recovered, accumulating around the 3,300 price range at the beginning of the new week. Still in a major downtrend.
⭐️Set Gold Price:
🔥Sell Gold Area: 3316-3318 SL 3323
TP1: $3305
TP2: $3290
TP3: $3277
🔥Buy Gold Area: $3248-$3246 SL $3241
TP1: $3258
TP2: $3270
TP3: $3286
⭐️Technical Analysis:
Set reasonable buy orders based on technical indicators EMA 34, EMA89 and support and resistance areas.

Gold's rally has not reversed yet? The consolidation pattern hasTechnicals:
Short-term risks remain skewed to the downside as the momentum of the relative strength index (RSI) and the moving average convergence divergence indicator (MACD) weakens. The RSI hit a new low below the neutral 50 mark. If short pressure intensifies in the next few trading days, gold prices may retest the upper track of the previous falling channel at 3215, followed by the rising support line from October 2024 at 3150. If it falls below this level, the decline may accelerate towards the psychological level of 3000, or even lower to 2970.
On the upside, if a strong catalyst pushes gold to rebound above the 20-day and 50-day moving averages (currently 3320-3350), the next resistance level may appear in the 3400-3435 range. A decisive close above this boundary may pave the way for gold prices to move towards 3500, or test resistance near 3530, and then may target the 3600 level.
Overall, despite the weakening technical indicators, gold has not completely lost its bullish reversal potential. As long as the price remains within the sideways structure above 3150, the downward pressure may still give rise to a "buy on dips" strategy.

Gold is trading sideways. Has it reached a high point?On the first trading day of this week, after hitting 3247 in the early Asian session, it quickly rebounded to around 3295, and then fell back slightly. It is currently maintained at around 3285.
From the hourly chart, the Fibonacci 0.618 position of this trend from 3247 to 3297 is at 3278. The price has always been above 3278, but it has only fallen below this position in a very short time. If the retracement does not break through the 0.618 position, there is a high probability that there will be a high point in the subsequent trend.
Next, we should focus on the area around 3280. If the price always closes above 3280, then today's high point of 3297 will most likely be refreshed. If the upward trend is opened again, it is very likely to touch around 3310. 3310 is also the current 0.618 position. And it is also the top position of this hourly chart range.
Therefore, we should be cautious when shorting gold above 3280, as there is a high probability that it will reach above 3300.
Aggressive trading can rely on entering the market and going long near 3280, and the profit range is between 3300-3310.
For short strategy trading, Quaid recommends that it is safer to short when the price rebounds near 3310.

6.30 Safe haven disappears, gold loses its luster!Gold did not break through the upper pressure at midnight last Friday. Gold fell directly after opening in the morning on Friday. The bears broke through the previous 3295 support line, and the lowest reached 3255 in the evening. It closed at around 3274, and the daily line also closed in the form of a big Yin line.
From the 4-hour analysis, the upper short-term resistance focuses on the 3295-3301 line, and the 3316 line is focused on. In terms of operation, it is still rebounding and continuing to be short and follow the trend to fall. The short-term support below focuses on the 3250-3255 line. The overall high-altitude participation tone remains unchanged relying on this range. I will remind you of the specific operation strategy during the session, and pay attention to it in time.
Gold operation strategy:
1. Short gold rebounds at the 3295-3301 line, and short gold rebounds at the 3314-16 line, stop loss at 3326, target 3255-3260 line, and continue to hold if it breaks;
Market Analysis: Gold Drops — Traders Eye Macro TriggersMarket Analysis: Gold Drops — Traders Eye Macro Triggers
Gold price started a fresh decline below $3,320.
Important Takeaways for Gold Oil Price Analysis Today
- Gold price climbed higher toward the $3,400 zone before there was a sharp decline against the US Dollar.
- A key bearish trend line is forming with resistance near $3,300 on the hourly chart of gold at FXOpen.
Technical Analysis of Gold Price
On the hourly chart of Gold at FXOpen, the price climbed above the $3,320 resistance. The price even spiked above $3,350 before the bears appeared.
A high was formed near $3,395 before there was a fresh decline. There was a move below the $3,350 support level. The bears even pushed the price below the $3,300 support and the 50-hour simple moving average.
It tested the $3,245 zone. A low is formed near $3,247 and the price is now showing bearish signs. There was a minor recovery wave toward the 23.6% Fib retracement level of the downward move from the $3,393 swing high to the $3,247 low.
However, the bears are active below $3,300. Immediate resistance is near $3,280. The next major resistance is near the $3,300 zone. There is also a key bearish trend line forming with resistance near $3,300.
The main resistance could be $3,320 or the 50% Fib retracement level, above which the price could test the $3,350 resistance. The next major resistance is $3,395.
An upside break above the $3,395 resistance could send Gold price toward $3,420. Any more gains may perhaps set the pace for an increase toward the $3,450 level.
Initial support on the downside is near the $3,245 level. The first major support is near the $3,220 level. If there is a downside break below the $3,220 support, the price might decline further. In the stated case, the price might drop toward the $3,200 support.
This article represents the opinion of the Companies operating under the FXOpen brand only. It is not to be construed as an offer, solicitation, or recommendation with respect to products and services provided by the Companies operating under the FXOpen brand, nor is it to be considered financial advice.

XAU/USD 30 June 2025 Intraday AnalysisH4 Analysis:
-> Swing: Bullish.
-> Internal: Bullish.
You will note that price has targeted weak internal high on two separate occasions forming a double top which is a bearish reversal pattern. This is in-line with HTF bearish pullback phase.
Remainder of analysis and bias remains the same as analysis dated 23 April 2025.
Price has now printed a bearish CHoCH according to my analysis yesterday.
Price is now trading within an established internal range.
Intraday Expectation:
Price to trade down to either discount of internal 50% EQ, or H4 demand zone before targeting weak internal high priced at 3,500.200.
Note:
The Federal Reserve’s sustained dovish stance, coupled with ongoing geopolitical uncertainties, is likely to prolong heightened volatility in the gold market. Given this elevated risk environment, traders should exercise caution and recalibrate risk management strategies to navigate potential price fluctuations effectively.
Additionally, gold pricing remains sensitive to broader macroeconomic developments, including policy decisions under President Trump. Shifts in geopolitical strategy and economic directives could further amplify uncertainty, contributing to market repricing dynamics.
H4 Chart:
M15 Analysis:
-> Swing: Bullish.
-> Internal: Bullish.
On H4 TF price has been failing to target weak internal high, therefore, it would not be unrealistic if price printed a bearish iBOS.
The remainder of my analysis shall remain the same as analysis dated 13 June 2025, apart from target price.
As per my analysis dated 22 May 2025 whereby I mentioned price can be seen to be reacting at discount of 50% EQ on H4 timeframe, therefore, it is a viable alternative that price could potentially print a bullish iBOS on M15 timeframe despite internal structure being bearish.
Price has printed a bullish iBOS followed by a bearish CHoCH, which indicates, but does not confirm, bearish pullback phase initiation. I will however continue to monitor, with respect to depth of pullback.
Intraday Expectation:
Price to continue bearish, react at either M15 supply zone, or discount of 50% internal EQ before targeting weak internal high priced at 3,451.375.
Note:
Gold remains highly volatile amid the Federal Reserve's continued dovish stance, persistent and escalating geopolitical uncertainties. Traders should implement robust risk management strategies and remain vigilant, as price swings may become more pronounced in this elevated volatility environment.
Additionally, President Trump’s recent tariff announcements are expected to further amplify market turbulence, potentially triggering sharp price fluctuations and whipsaws.
M15 Chart:

6.30 Four-hour resistance determines the strength of the reboundAt the weekly level, the short-term focus is on the adjustment and continued breaking of the weekly support. As time goes by, the weekly support is at the 3285 watershed. At the daily level, after the price broke the daily support last week, the price continued to rely on the daily resistance to bear pressure. At present, the daily resistance is at the 3355 area resistance. Below this position, gold can continue to be shorted. At the four-hour level, the four-hour key position is the key to our emphasis on short-term trends. At present, the four-hour watershed is in the 3300 area, so the focus is on the gains and losses of this position. Before it breaks up, the short-term focus will be on the pressure first, but once it breaks up, it will need to focus on the rebound to the daily resistance. From the one-hour perspective, the bottom rebounded during the early morning session and broke through the high point of the previous trading day’s early morning retracement, so the short-term is still in adjustment. Temporarily pay attention to the gains and losses of the 3300 position, and treat it as the right-side trading method in terms of operation.

Gold continues to be weak, but be careful about operations
📣Gold prices fell 2% last Friday, hitting a near one-month low. Optimistic trade-related agreements boosted risk appetite and weakened the attractiveness of gold as a safe-haven asset. This week, the market will usher in a group meeting of major central bank governors around the world (Fed Chairman Powell, European Central Bank President Lagarde, Bank of England Governor Bailey, Bank of Japan Governor Kazuo Ueda, and Bank of Korea Governor Lee Chang-yong). The market will also usher in non-agricultural data. In addition, Powell's remarks on whether to resign may ignite the market this week. Gold prices may fluctuate more around the lower track of the Bollinger Band at $3,270/ounce this week.
Technical analysis:
Last Friday, the K-line had a lower shadow, and the Bollinger Band did not diverge. It is not easy to go short directly in operation, but wait for the rebound to confirm 3295 and the key resistance of ma5 to be short.
💰 Operation strategy: Rebound to 3280-3283 to go short, target 3270-3265, stop loss 3288-3290

"The Great Gold Heist" – XAU/USD Master Plan🏆 "The Great Gold Heist" – XAU/USD Master Plan (High-Risk, High-Reward Loot!) 🚨💰
🌟 Attention, Market Robbers & Money Makers! 🌟
Hola! Oi! Bonjour! Hallo! Marhaba! 🤑💸
🔥 Based on the legendary Thief Trading Strategy (technical + fundamental heist tactics), here’s our blueprint to STEAL massive profits from the XAU/USD (Gold vs. Dollar) market! 🔥
🎯 The Heist Plan (Long Entry Setup)
Entry Point 📈: *"The vault is UNLOCKED! Swipe bullish loot at any price—but for a cleaner steal, set Buy Limits within 15-30M recent swing lows/highs. ALERT UP! ⏰"*
Stop Loss 🛑: "Thief’s SL hides at the nearest swing low (3H TF: 3250.00) OR below the last daily candle wick. Adjust based on your risk appetite & lot size!"
Target 🏴☠️: 3490.00 (or escape early if the cops—err, bears—show up!)
⚡ Scalper’s Quick Loot Guide:
"Only scalp LONG! Rich? Go all-in. Broke? Join the swing traders & rob slow ‘n’ steady. Use Trailing SL to lock profits!"
📊 Market Status:
XAU/USD (GOLD) – Neutral (But Bullish Sneak Attack Likely! 🐂💥)
"The heist is ON, but watch for traps—overbought zones, consolidation, and bearish robbers lurking!"
🔍 Pro Thief Moves:
✅ Fundamentals Matter! (COT Reports, Geopolitics, Macro Data, Sentiment—check our BIO0 for the full loot list!) 🔗👉🏻☝🏻
✅ News = Danger! Avoid new trades during releases. Trail your SLs to protect stolen cash! 📰🚨
💖 Support the Heist Crew!
"Hit the BOOST BUTTON 💥 to strengthen our robbery squad! More boosts = easier money steals daily!"
🚀 Stay tuned—another heist drops soon! 🐱👤💎

Non-agricultural data is coming. Will it affect the market trendBecause there will be non-agricultural data next week, Quaid thinks that the market will not be in a hurry to perform at the beginning of the week. And Friday is the US Independence Day, and the market will be closed in advance; maybe only Wednesday and Thursday are really needed.
This week, gold closed below 3300, and the daily line was also broken, and gold officially entered a bearish trend.
First look at the monthly line chart
Because next Monday is the last day of June, the monthly line will start to close, so you can still pay attention to the support of the monthly line. The MA5 moving average below the monthly line is currently around 3170. Moreover, with the support of non-agricultural data next week, the possibility of touching around 3170 is not ruled out.
Secondly, from the weekly line chart
The weekly line is basically the same as the monthly line. The MA20 moving average below is also around 3170. So next week, I think we should focus on around 3170. The monthly line and the weekly line resonate, so the probability of touching this position is very high.
Finally, let's look at the daily chart. The daily chart shows a downward trend and the short-term support has been broken. The current support is around 3250. I think there is a high probability of a small sideways consolidation at the beginning of the week. If the market conditions are eager to change, it may rebound slightly and then continue to decline. If it falls below 3250, it will continue to fall towards 3200. If this level is broken, it may hit the low point of 3170-3175.

GOLDGOLD is about to get ready for a push up, keep an eye from the reaction zone for buy setups.
Disclosure: We are part of Trade Nation's Influencer program and receive a monthly fee for using their TradingView charts in our analysis.

Gold has been falling continuously. Will it continue next week?Market review:
The conflict between Israel and Iran intensified, and gold surged in the early stage, and then continued to fluctuate downward. Affected by the situation in the Middle East and weak data from the United States, it fell severely in three trading days, and most of the other time periods were in the stage of repeated washing.
The first round of decline began at the high point of 3452. Affected by the situation in the Middle East, the price rose rapidly, but the rapid rise led to insufficient upward momentum, and the departure of buyers led to continuous declines in a single trading day. The second round of decline was affected by the easing of the conflict between Iran and Israel, and the US dollar, crude oil, and gold all plunged sharply; the third round of decline was Powell's wait-and-see attitude towards the interest rate cut policy, and some US data were bearish for gold, leading to a new round of decline.
Market outlook for next week:
The breaking of the key support bands of 3303 and 3295 means that the downward adjustment has not ended, but after touching the support near 3250, there was a clear bottoming out and recovery. It means that there is strong support below, and the focus of next week's opening is the emergence of price rebound. There were rebounds to varying degrees after the previous two rounds of decline, so this round of decline still needs to be paid attention to. The strategy mainly revolves around shorting on price rebound, with a focus on the upward suppression range of 3285-3310.
If the rebound is small, then at the beginning of next week, it is likely to maintain a small fluctuation in the range of 3270-3285.

Gold Continues to Fall Below $3,300As the week comes to a close, gold is on track for a decline of more than 1.5% during the latest trading session. So far, the bearish bias remains firmly in place in the movements of the precious metal, as demand for safe-haven assets continues to fade, mainly due to the ceasefire agreement in the Middle East conflict, which has helped restore market confidence. Since gold is a classic safe-haven asset, demand has steadily weakened in recent sessions, and as long as this situation holds, selling pressure on gold may continue to intensify.
Uptrend Breaks:
Recent selling activity has played a crucial role, as it has led to a bearish breakout below the short-term trendline, which had been consistently holding on the chart. This breakdown has now opened the door for a lateral channel to form, suggesting that market sentiment has entered a more neutral zone in the short term. If bearish pressure continues, it could pave the way for a more dominant downtrend to take shape in the sessions ahead.
Indicators:
RSI: The RSI line has started oscillating steadily below the 50 level, signaling that downward momentum is beginning to dominate. If the line continues to move away from the neutral 50 level, we could expect more consistent bearish pressure on the chart.
MACD: A similar setup is emerging on the MACD. The indicator's histogram has dropped below the neutral line at zero and is showing persistent negative readings. This signals that selling momentum remains dominant, based on the average strength of the moving averages. If this continues, it would confirm a clear bearish bias.
Key Levels to Watch:
$3,300 – Current barrier: This level aligns with the midpoint of the short-term lateral channel. Price action around this area could reinforce the neutral outlook in the near term.
$3,400 – Key resistance zone: This level marks the historical highs of the gold market. A return to this level would revive the recently abandoned bullish trend and could reestablish a more optimistic outlook.
$3,200 – Critical support: This marks the lower boundary of the short-term channel. A breakdown below this level could trigger a fresh selling trend in the coming sessions.
Written by Julian Pineda, CFA – Market Analyst

The data is negative. Will the price rebound from the bottom?Gold prices have continued to fall since the high near 3450. This trading day started the downward mode near 3328, and the European session continued to fall, breaking a new low. The negative PCE data also continued the downward mode. So far, it has rebounded after hitting the lowest level near 3255. However, the rebound is small, and the upper pressure is still very strong.
From the 4-hour chart, short-term resistance focuses on the vicinity of 3295-3300, followed by important pressure near 3315. The short-term support below focuses on the vicinity of 3265-3270. The overall strategy of shorting at high positions remains unchanged based on this range.
Operation strategy:
Short at the price rebound near 3295, short covering at the high point of 3315, stop loss 3325, profit range 3370-3360.
At present, the price fluctuates greatly. If you want to try scalping transactions, you can trade with a light position and float up and down 5 points to stop loss or profit in time.
This is the last trading day of this week. I hope you all will gain something and have a happy weekend with your family.

6.27 Gold rebounds and adjusts, don't chase shorts at low levelsGold fell below this week's low of 3295 today. As of now, gold has hit 3285 and is fluctuating. Don't chase the short position and short it when it rebounds. Now you can only wait patiently for the rebound before entering the short position. Be a steady hunter and wait patiently for the appearance of prey!
Gold is now focusing on the short-term suppression of the upper 3301-3306 line, focusing on the suppression of the upper 3314-16 line, and the support below is 3276-80. Short it when it rebounds.
Strategy ideas:
1. Gold rebounds to 3301-3306 line and shorts lightly, rebounds to 3314-16 line to cover short position, stop loss 3324, target 3280-85 line;

Gold is weak. Can it continue?Gold is still fluctuating and falling slightly today. Gold is weak, so gold is likely to be short-term. If the price rebounds, it will be a short opportunity.
We need to pay attention to the release of US PCE data later.
From the 1-hour chart
the moving average continues to cross the short arrangement and diverge downward. After gold fell below the early support near 3340, it began to move downward weakly. The current upward pressure is around 3295-3310.
From the daily chart, the price is below the MA20 cycle and the 50 cycle, but remains above the 100 cycle. The technical indicators turned higher, but the momentum indicator is at a neutral level, and the RSI index is around 42.7, which does not point to an upward trend.
Since the upcoming data may have some impact on the price, the price may have a short-term high opportunity. Steady trading is still waiting for the price to rise and then short. Of course, if your trading strategy is more aggressive, you can use a long strategy before the price rises.
Operation suggestions:
Radical: Buy near 3280, stop loss at 3265, profit range 3305-3310.
Conservative: Wait for the price to rise and then bear pressure, sell near 3310, stop loss at 3320, profit range 3290-3285.

Where will gold go?In 4 hours, it has fallen below the previous low of 3295, and will continue to fall. There are two supports below, namely 3280 and 3265. Don't expect a big rebound before going short in a negative market. If the rebound is large, it will not fall. This kind of negative decline is generally judged by the 15- and 30-minute patterns. When resistance appears in the big cycle, the market has actually fallen a lot.
Today, I think the pressure is mainly in the 3300 and 3310 areas. 3310 can be considered as the pressure of the top and bottom conversion. Pay attention to 3280 and 3265 below. If you consider going long, these two positions are the main positions. For the time being, the general direction is mainly short.

XAU/USD 27 June 2025 Intraday AnalysisH4 Analysis:
-> Swing: Bullish.
-> Internal: Bullish.
Analysis and bias remains the same as analysis dated 23 April 2025
Price has now printed a bearish CHoCH according to my analysis yesterday.
Price is now trading within an established internal range.
Intraday Expectation:
Price to trade down to either discount of internal 50% EQ, or H4 demand zone before targeting weak internal high priced at 3,500.200.
Note:
The Federal Reserve’s sustained dovish stance, coupled with ongoing geopolitical uncertainties, is likely to prolong heightened volatility in the gold market. Given this elevated risk environment, traders should exercise caution and recalibrate risk management strategies to navigate potential price fluctuations effectively.
Additionally, gold pricing remains sensitive to broader macroeconomic developments, including policy decisions under President Trump. Shifts in geopolitical strategy and economic directives could further amplify uncertainty, contributing to market repricing dynamics.
H4 Chart:
M15 Analysis:
-> Swing: Bullish.
-> Internal: Bullish.
Following previous high, and printing of bearish CHoCH, price has pulled back to an M15 supply zone, where we are currently seeing a reaction. Therefore, I shall now confirm internal high.
Price is now trading within an established internal range.
The remainder of my analysis shall remain the same as analysis dated 13 June 2025, apart from target price.
As per my analysis dated 22 May 2025 whereby I mentioned price can be seen to be reacting at discount of 50% EQ on H4 timeframe, therefore, it is a viable alternative that price could potentially print a bullish iBOS on M15 timeframe despite internal structure being bearish.
Price has printed a bullish iBOS followed by a bearish CHoCH, which indicates, but does not confirm, bearish pullback phase initiation. I will however continue to monitor, with respect to depth of pullback.
Intraday Expectation:
Price to continue bearish, react at either M15 supply zone, or discount of 50% internal EQ before targeting weak internal high priced at 3,451.375.
Note:
Gold remains highly volatile amid the Federal Reserve's continued dovish stance, persistent and escalating geopolitical uncertainties. Traders should implement robust risk management strategies and remain vigilant, as price swings may become more pronounced in this elevated volatility environment.
Additionally, President Trump’s recent tariff announcements are expected to further amplify market turbulence, potentially triggering sharp price fluctuations and whipsaws.
M15 Chart:

There are opportunities for both bulls and bears in gold!Gold fell back and closed lower yesterday. The daily line closed with a negative cross overnight. The overall market has not changed much. The short-term repeated tug-of-war is temporarily consolidating. Today is the closing of the weekly line, and we will continue to maintain the volatile thinking. In the 4H cycle, the Bollinger Bands closed, temporarily exerting pressure on the middle track. After rebounding to 3350 yesterday, it failed to continue and remained in a weak shock pattern. Therefore, today's operation is mainly short and supplemented by long. The upper pressure is at 3328 and 3336. Short according to the rebound strength, pay attention to the rise and fall of 3310 below. A breakthrough may see the previous low of 3295. If the support is not broken, you can consider going long.🔔For more specific operation details and strategy updates, please pay attention to the notification 🌐 at the bottom.
Gold operation suggestion: short gold around 3328-3338, target 3315-3310.

Gold fluctuated and fell, and the rebound was directly short
📣Gold News
Due to the easing of the situation in the Middle East, gold has fallen in the past few days, and the market has been eagerly looking forward to the interest rate cut, because the tariffs in the Trump era may push up inflation, but it has not come yet. "
On Thursday, the U.S. Department of Labor and Commerce issued key economic data, including initial jobless claims and the final value of real GDP in the first quarter. The number of initial jobless claims was 236,000, a decrease of 9,000 from 245,000 in the previous week, better than the market expectation of 245,000. At the same time, as of June 14, the number of continued unemployment claims in the week increased by 37,000 to 1.974 million, a new high since November 2021. Gold stopped below the moving average today. Gold did not continue the small positive line rise, and the decline continued during the U.S. trading period.
Today, focus on the continuation of short positions, comprehensive Labaron believes that gold is bearish today. For today's operation, consider rebound shorting as the main, and low long as the auxiliary.
📣 Pay attention to the resistance of 3330-3345 US dollars above
📣 Pay attention to the support of 3300-3280 US dollars below
💰 Go long near 3295-3285, target 3310-3320
💰 Go short near 3330-3340, target 3000-3290
If you have just entered the market, you are confused about the market of gold, oil and silver, and you always do the opposite operation direction and the entry price is unstable. I hope Labaron's article will help you.
