Gold Eyes QML Resistance: Ready for a PullbackHelloooo!
Gold, after gapping up strongly, has now entered the green QML (Quasimodo Level) supply zone at roughly 3,380–3,390. This zone has acted as resistance before, so a reaction here makes perfect sense.
What I see:
Engulfed Level (3,315.66): Earlier support that got taken out. This is our logical pullback target once the QML zone does its job.
Hurricane Move: The big up-spike looks exhausted now that it’s hit the QML.
Bearish Reversal Odds: if sellers step in around current levels, expect a drop back toward 3,315.
Plan: Watch for bearish candles or a failed rally inside the 3,380–3,390 area. If we see clear rejection, target a swift move down to 3,315, with a further slide possible to the 3,260 demand zone if momentum holds.
Goldsell

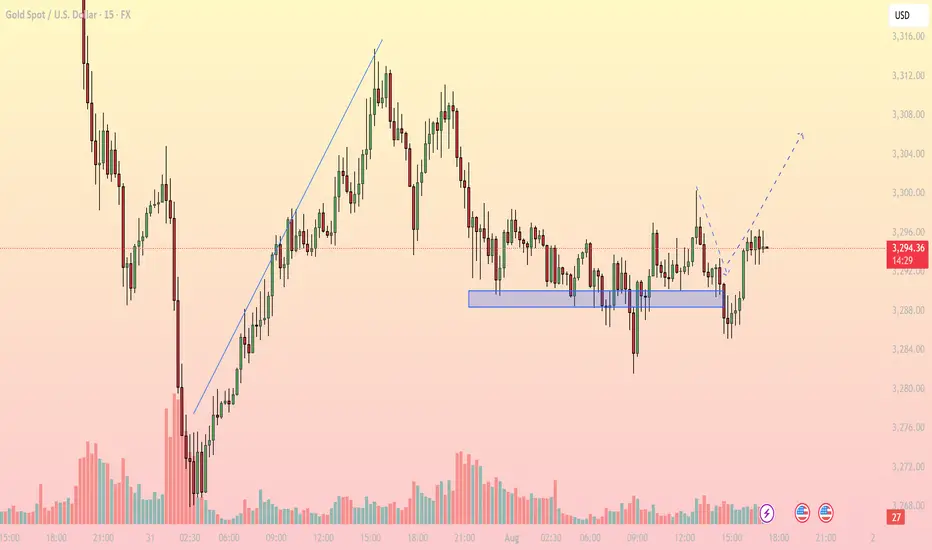
Bullish Rejection from Support, Upside in FocusMarket Overview: On the M15 timeframe, XAUUSD shows signs of a short-term bullish reversal after a prolonged sideways range around the key support zone of 3,286 – 3,289 USD. Price faked out below this support but quickly recovered, forming a V-shape reversal, suggesting strong buying interest has returned.
Key Levels to Watch:
Support Zones:
- 3,286 – 3,289: Strong intraday support, tested multiple times with sharp rejections
- 3,274: Next significant support if the above zone fails
Resistance Zones:
- 3,300 – 3,304: First resistance target aligned with the recent high
- 3,308 – 3,312: Higher resistance area where supply may emerge
Technical Indicators:
EMA: Price has reclaimed the short-term EMAs, indicating bullish momentum on lower timeframes
RSI: Rising above 50 but not yet overbought – there’s room for further upside
Volume: Increasing volume during the bounce confirms buying strength
Trading Strategy:
- Bullish Scenario (Preferred): Entry Zone: Watch for pullback toward 3,290 – 3,292
Stop Loss: Below 3,285
Take Profit 1: 3,300
Take Profit 2: 3,304
Extended Target: 3,308 – 3,312 (if bullish momentum continues beyond breakout zone)
- Bearish Scenario (Alternate): Only valid if price breaks and closes strongly below 3,286
Short Target: 3,274 – 3,270
Note: Counter-trend strategy – higher risk, requires strong confirmation
Conclusion: Gold is showing a bullish price structure on the 15-minute chart. As long as price holds above the 3,286 – 3,289 support zone, the path of least resistance appears to be upward, with 3,300 and 3,304 as the next logical targets. Monitor price action closely during the U.S. session for a potential long setup.
- Follow for more real-time gold trading strategies and save this idea if you find it helpful!
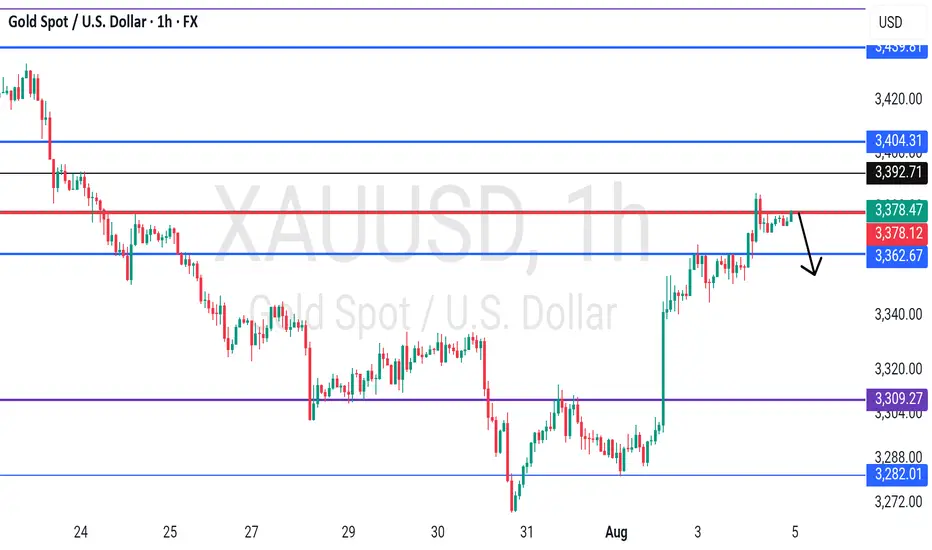
GOLD - at resistance ? Whats next ??#GOLD... market just reached at his current resistance area and that is 3378-79
Keep close and if market holds the cdrop expected from here.
Good luck
Trade wisely
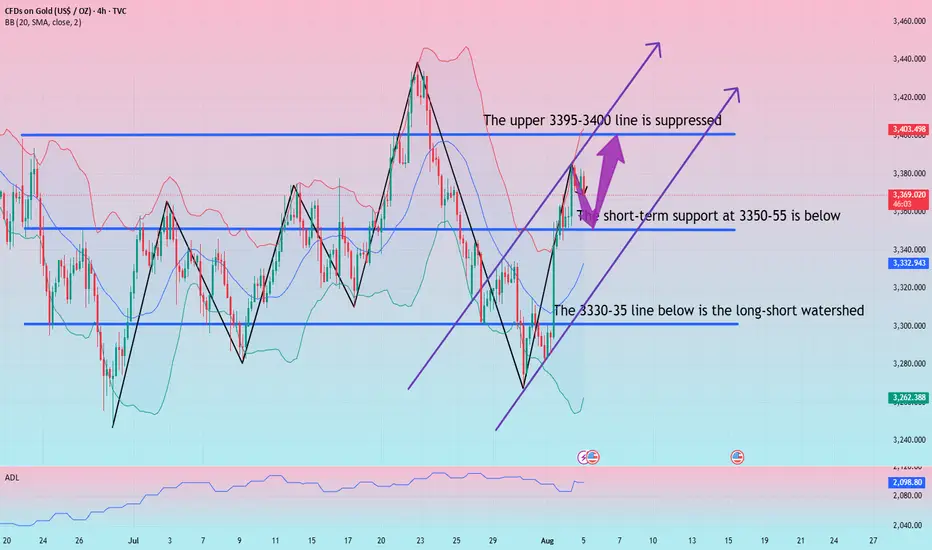
How to accurately capture golden trading opportunities?Bullish trend is still the main trend of gold at present. After rising to 3368 at the opening today, it fell under pressure and fluctuated. Technically, it has tested the pressure level and needs to be adjusted. The overall high-level carrying capacity has also declined, so it is not advisable to chase the rise too much. In terms of operation, it is recommended to wait for the price to stabilize before buying more. Judging from the current gold trend, the upper short-term resistance is in the 3380-3385 area, and the key pressure is at the 3395-3400 line; the lower short-term support is in the 3365-3355 area, and the key support is in the 3350-3345 range. The overall suggestion is to arrange long orders on dips around the support area, and try to maintain a stable wait-and-see attitude in the middle position. I will prompt the specific operation strategy at the bottom, please pay attention in time.
Gold Trading Strategy: Buy in batches as gold retreats to the 3365-3350 area, targeting the 3380-3385 area. If this resistance zone is broken, hold and look for upward movement.
Gold bulls are under pressure to adjust and continue to increase
Gold prices continued their strong upward trend yesterday amidst volatile trading. Gold prices strengthened strongly around the 3345 level during the Asian and European sessions, rising through 3370 in the European session and continuing their upward trend. Gold then retreated and tested the 3361 level before stabilizing and accelerating higher through 3380 before closing strongly. The daily K-line closed with a volatile breakout above the highs, forming a pattern of consecutive rising highs. Gold prices continue to strengthen in the short term, reaching as high as 3385 but failing to hold, indicating significant upward pressure. A break above 3400 would likely target 3430; otherwise, a deeper correction could be in the offing. Technically, adjustments are needed, so excessive buying into the rally is advised. If your current trading is not ideal, I hope I can help you avoid investment setbacks. Welcome to discuss your options.
Based on the 4-hour chart, support is currently focused on the 3350-55 area. Rebounds to this level will maintain a bullish trend. The short-term bullish trend line is focused on the 3330-35 area. If the daily chart stabilizes above this level, continue to buy on dips and follow the trend. I will provide detailed trading strategies during the trading session, so please stay tuned.
Gold Trading Strategies:
1. Short gold on a rebound to the 3385-90 area, then cover your short position at the 3395-3400 area. Target: 3345-50, stop loss: 3405.
2. Go long on a pullback to the 3350-55 area, stop loss: 3323, target: 3390-3395. Hold if it breaks through.
XAU/USD) Bearish Trend Read The captionSMC Trading point update
Technical analysis of Gold (XAU/USD) on the 1-hour timeframe, suggesting a potential short-term sell setup targeting a key support zone.
---
Analysis Summary
Asset: XAU/USD (Gold Spot)
Timeframe: 1H
Current Price: 3,371.56
Bias: Bearish pullback toward lower support
---
Key Technical Insights
1. FVG (Fair Value Gap):
Price tapped into a premium supply zone / FVG (highlighted in yellow at the top), showing rejection.
This zone likely acted as a liquidity grab, triggering potential reversal.
2. Structure Shift (SS):
Minor bullish market structure appears to be breaking down, signaling a shift in momentum.
3. Target Point:
Price is expected to revisit the support zone at 3,330.77, where prior accumulation and a bullish order block exist.
This also aligns with the 200 EMA around 3,340.48, adding confluence.
4. RSI (14):
RSI is currently at 54.86, indicating neutral momentum with room for downside.
---
Target Point
Target Zone: 3,330.77 (Key support and potential long re-entry area)
---
Trade Idea
Direction Entry Zone Stop-Loss Target
Sell 3,370–3,375 Above 3,390 3,330
Mr SMC Trading point
---
Summary
Gold is showing signs of short-term exhaustion after filling the FVG zone and is likely to pull back toward the 3,330 support area, making it a potential intraday short opportunity. The structure break, EMA, and RSI support this retracement.
Please support boost 🚀 this analysis)

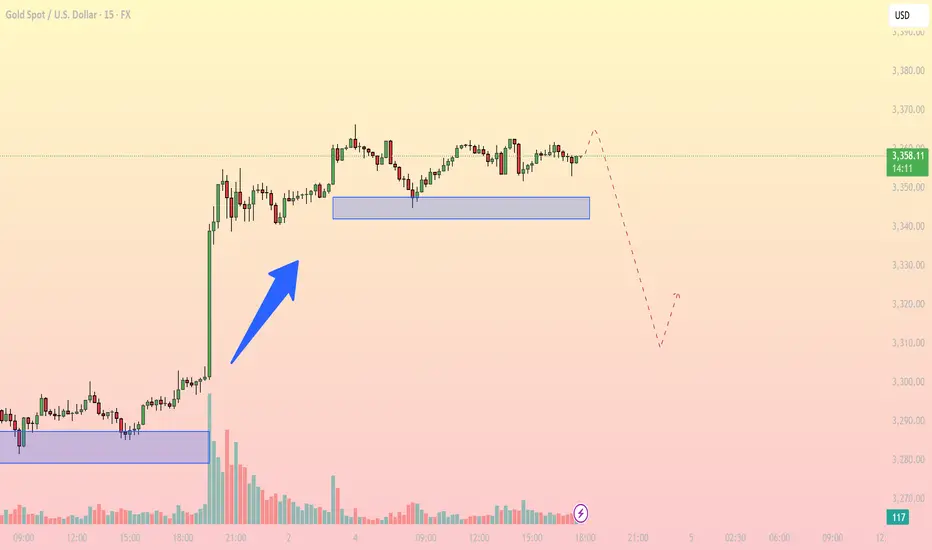
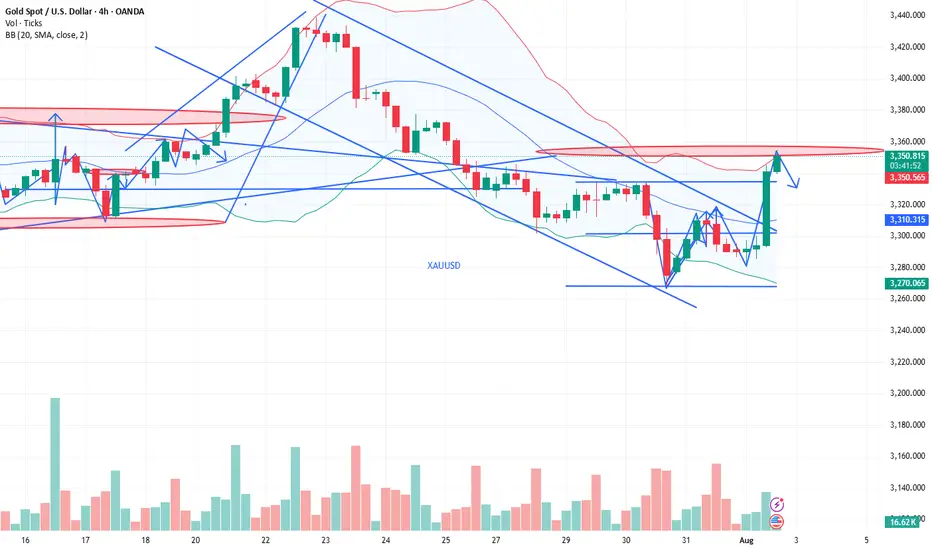
Distribution Phase at the Top, Key Support in FocusFollowing a sharp breakout from the demand zone around $3,310, gold has entered a sideways consolidation range between $3,355 – $3,367. The price has repeatedly tested the support at $3,352 – $3,354 but failed to form higher highs beyond $3,367. This signals buyer exhaustion and a potential distribution pattern at the top.
The inability to push higher suggests increased risk of a bearish breakdown.
Key Technical Levels
Immediate Resistance: $3,367.77
Short-Term Support: $3,352 – $3,354 (blue box zone)
Major Support Below: $3,310 – $3,315 (previous breakout base, near 0.5 Fibonacci retracement)
Suggested Trading Strategies
Primary Scenario: Sell on Breakdown
Trigger Condition: Price breaks below $3,352 with increasing volume
Entry: $3,350
Stop Loss: $3,360
Target: $3,320 – $3,310
This is a momentum-following setup, ideal if the current support fails.
Alternative Scenario: Buy from Major Support
Entry Zone: $3,310 – $3,315
Stop Loss: Below $3,300
Target: $3,345 – $3,355
Suitable for counter-trend traders looking to catch a rebound off strong demand.
Additional Technical Signals
EMA 20 (15m): Flattening out, indicating loss of bullish momentum
RSI: Hovering around 50, showing a balance between buyers and sellers
Volume: Gradually decreasing, suggesting a potential breakout setup is building
Gold is currently in a distribution phase after a sharp upward move. If the $3,352 support zone breaks, a retracement toward $3,310 – $3,315 is likely. However, bulls may step back in around that zone for a potential rebound.
Follow for more real-time gold strategies. Save this post if you find it useful for today’s session!
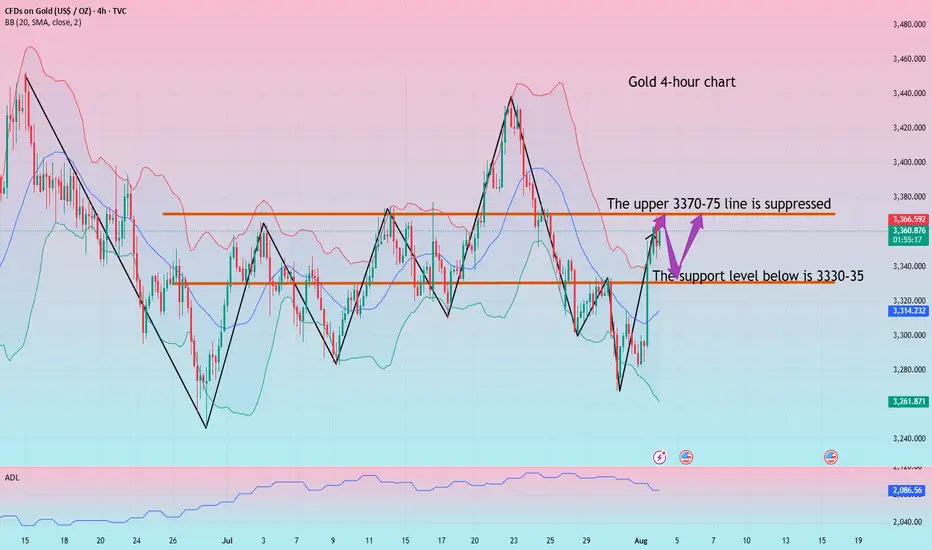
Gold falls back and looks for opportunities to go long
Bullish momentum remains the primary trend. The market opened higher near 3368 before experiencing a period of volatile decline under pressure. Technically, the market has tested resistance and needs to adjust. Overall support at higher levels has also weakened, so it's best not to chase the market too much. Opportunistically, buy on dips and stabilization before buying.
From a 4-hour analysis, short-term resistance is expected to be near 3370-3375, with a key resistance area at 3395-3400. Support is expected at 3330-35, so consider buying on dips. In the middle, maintain a cautious wait-and-see approach. I'll provide detailed trading strategies during the trading session, so stay tuned.
Gold Trading Strategy:
Buy on dips to 3330-35, with a stop-loss at 3318 and a target at 3370-3375. Continue holding if the market breaks above.
Technical indicators are bullish across the boardInfluenced by the NFP data, gold prices rose strongly, fully recovering last week's losses. The current gold market has broken the previous bull-bear equilibrium and remains in a strong upward trend. We are currently bullish but will not chase the rise. We will wait for gold to fall back and stabilize before trying to go long. Gold is currently in a sideways consolidation. If gold touches the upper short-term resistance of 3365-3370 again in the European session and encounters resistance and pressure, you can consider shorting with a light position and waiting for a pullback. If the gold price breaks up strongly, pay attention to the key suppression level above 3375-3385.
As the price of gold continues to rise, the support has moved up. Pay attention to the short-term support of 3345-3330 below. If it retreats and stabilizes, you can consider going long. Independent traders must strictly implement trading plans, and those who are not sure about the market must set stop-loss orders.
OANDA:XAUUSD

Weak non-farm payroll data injects newconfidence into gold bullsGold rebounded strongly late last week, shaking off early-week losses and surging toward key resistance at $3,400 per ounce as weak US jobs data rekindled hopes for a September rate cut by the Federal Reserve.
Spot gold closed at $3,363.16 on Friday (August 1st), up 2.23% on the day, or $73.24, after hitting a high of $3,363.37.
Lukman Otunuga, senior market strategist at FXTM, said Friday's rally in gold prices was impressive, driven by a plunging US dollar.
"From the chart, bulls were on a rampage that day, with $3,400 within 2% of the price at that point," he said. "With prices breaking through $3,330 resistance, the weekly chart is significantly bullish. A weekly close above this level could signal a move toward $3,400."
Last week, gold faced significant selling pressure after the Federal Reserve held interest rates steady and Chairman Powell raised uncertainty about a possible September rate cut.
"We haven't made a decision about September yet," Powell said at a press conference following the Fed's decision.
After disappointing U.S. job market data, lingering doubts about a September rate cut dissipated. According to the Bureau of Labor Statistics, the U.S. economy created only 73,000 jobs last month. Furthermore, total job growth in May and June was revised downward by 258,000. According to the revised data, only 14,000 jobs were created in June and 19,000 in May.
"This weaker-than-expected jobs report has dented confidence in the U.S. economy and put pressure on the dollar as markets anticipate a more dovish Fed, potentially leaning toward rate cuts to stimulate growth," said Aaron Hill, senior market analyst at FP Markets. "For gold, the disappointing jobs data reinforces its role as a hedge against economic uncertainty, supporting prices as investors seek stability."
According to the CME FedWatch tool, the market currently sees a 92% probability of the Fed easing monetary policy in September. Last Thursday, the market saw only a 38% chance of a rate cut.
Jamie Cox, managing partner at Harris Financial Group, said the Federal Reserve may ultimately regret its decision to hold interest rates steady earlier this week.
"A rate cut in September is a definite possibility, perhaps even a 50 basis point cut, to make up for lost time," he said.
Naeem Aslam, chief investment officer at Zaye Capital Markets, said he sees the potential for gold prices to steadily rise to $3,400 an ounce given the sharp shift in interest rate expectations.
"If the Fed signals a dovish stance, speculative inflows could push gold prices above the psychological $3,400 level, especially as investors seek safe havens during economic uncertainty," he said. "Technical indicators, such as a bullish trend in gold ETFs and rising open interest, support this potential breakout. We believe traders are already positioning for a dip bounce, with some analysts pointing to seasonal patterns in gold that typically gain traction after August. While volatility may still limit near-term gains, the overall trend looks positive, and the typical summer lull may be over."
This week will be light on economic data, with investors continuing to digest Friday's jobs report. Meanwhile, some analysts expect the economic uncertainty stemming from President Trump's ongoing trade war and global tariffs to further boost safe-haven demand for gold.
Trade tensions are providing another layer of support for gold. President Trump set an August 1st deadline for countries to finalize a trade deal. While the United States reached agreements with Japan and the European Union, resulting in a 15% increase in import tariffs, many major trading partners still face the risk of tariff increases.
As a result, exports from many countries now face significant cost increases. Specifically, Canada, the United States' second-largest trading partner, faces a 35% tariff increase. Meanwhile, India faces a 25% increase, Taiwanese exports will be subject to a 20% tariff, South African products face a 30% tariff, and Swiss goods face a 39% tariff.
Pepperstone market strategist Michael Brown said he remains bullish on gold, citing global trade uncertainty as a key factor driving its value as a monetary asset.
He said: "The diversification of reserves away from the US dollar and into gold, particularly in emerging markets, will continue for the foreseeable future. Of course, potential safe-haven demand stemming from concerns about the state of the US economy will further support the bullish view. The upside levels to watch remain the $3,400 mark, followed by a high of around $3,445, and then a potential run towards the all-time high of $3,500. I certainly wouldn't rule out the possibility of new highs in gold prices before the end of the year."
Chris Vecchio, Head of Futures Strategy and FX at Tastylive, said he sees gold as a very beneficial global currency.
"Tariffs mean that countries will trade less in US dollars, so I expect gold to continue to perform well as the world searches for an alternative monetary asset."
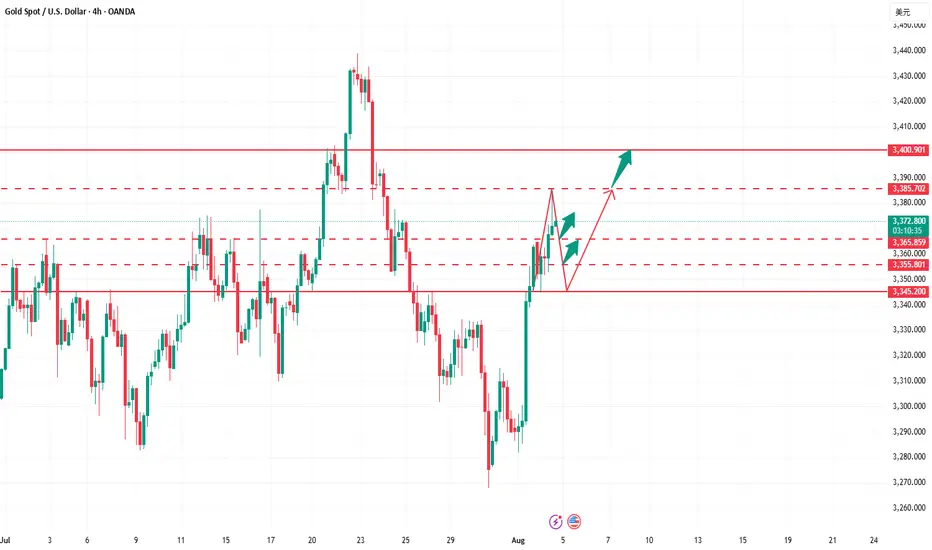
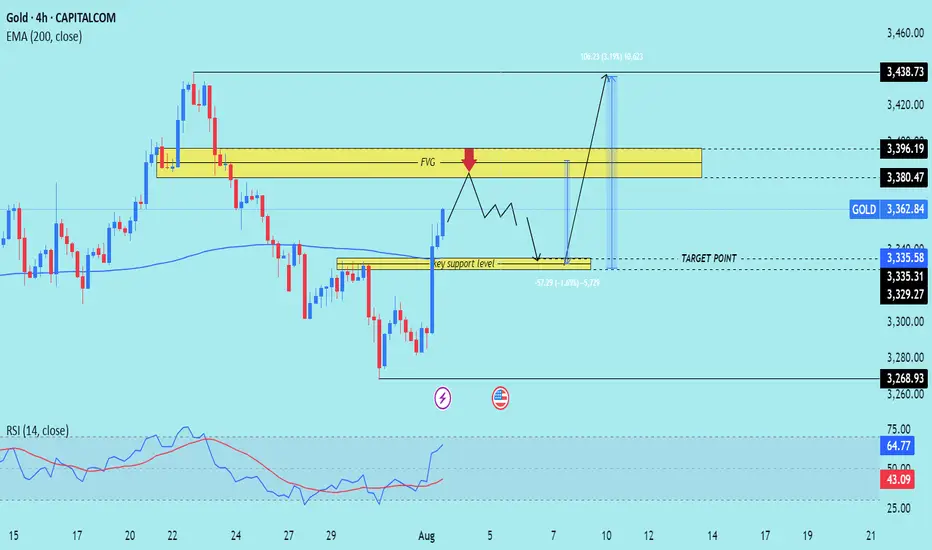
XAU/USD) Bearish Trend Read The captionSMC Trading point update
Technical analysis of (XAU/USD) on the 4-hour timeframe, showing both a potential retracement and a bullish continuation.
---
Technical Breakdown:
1. Current Market Structure:
Price recently made a strong bullish push from the key support level (~3,329–3,335), breaking structure to the upside.
It is now approaching a Fair Value Gap (FVG) and resistance zone between 3,380.47 and 3,396.19.
2. Key Zones Identified:
FVG / Resistance Zone: 3,380.47–3,396.19 — where price might initially reject (red arrow) due to unfilled imbalance and previous supply.
Key Support Zone: 3,329.27–3,335.31 — potential area of re-entry or demand if price pulls back.
EMA 200 (Blue): Currently at 3,335.58, aligning with key support.
3. Price Path Scenarios:
Primary Expectation: Price may tap into the FVG, face rejection, then pull back into the key support level for a higher low.
From there, it is projected to bounce back strongly toward the ultimate target at 3,438.73, marking a 3.19% upside move.
4. RSI (14):
RSI at 64.77, indicating strong bullish momentum but not yet in overbought territory. Favorable for continuation, but a short-term correction is possible.
Mr SMC Trading point
---
Trade Idea Summary:
Bias: Bullish (after a short-term rejection)
Entry Zones:
Watch for rejection at 3,380–3,396
Look to enter on a retest of 3,335–3,329 support
Target Zone: 3,438.73
Invalidation: Sustained breakdown below 3,329 or bearish engulfing with high volume
EMA & RSI Support: EMA 200 backs bullish bias; RSI confirms momentum
Please support boost 🚀 this analysis)
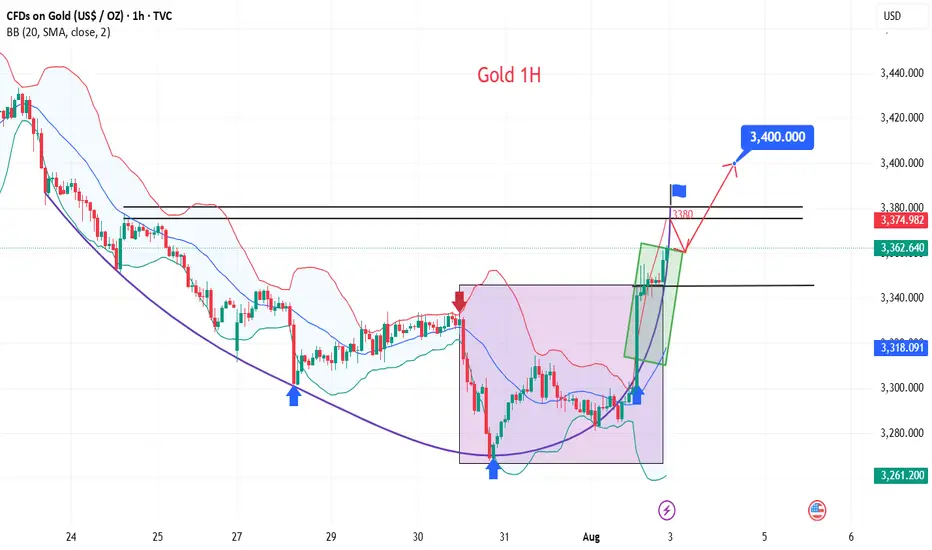
Is Gold 3400 Still Far Away?
💡Message Strategy
The spot gold market experienced a V-shaped reversal trend.Driven by unexpectedly weak U.S. non-farm payrolls data and risk aversion triggered by Trump's new tariff policy, gold prices rose nearly 2% on Friday to a one-week high of $3,347.66 per ounce, up 0.4% for the week. The Federal Reserve kept interest rates unchanged, but weak employment data rekindled expectations of a September rate cut, increasing the appeal of gold as a non-yielding asset.
At the same time, Trump's decision to impose tariffs of 10%-41% on many countries has exacerbated market concerns about global trade tensions and boosted the safe-haven demand for gold.
📊Technical aspects
The 1-hour moving average of gold has begun to turn upward, and the 1-hour moving average of gold has a double bottom structure. However, gold should not have such a large pullback for the time being. After the non-farm payrolls on Friday, gold fell back to the 3335 line and then began to fluctuate upward at a high level. The 3335-3345 area was also an important platform support in the early stage. Therefore, gold will mainly be bought on dips above 3335 next week.
💰Strategy Package
Long Position:3345-3355,SL:3325,Target: 3380-3400
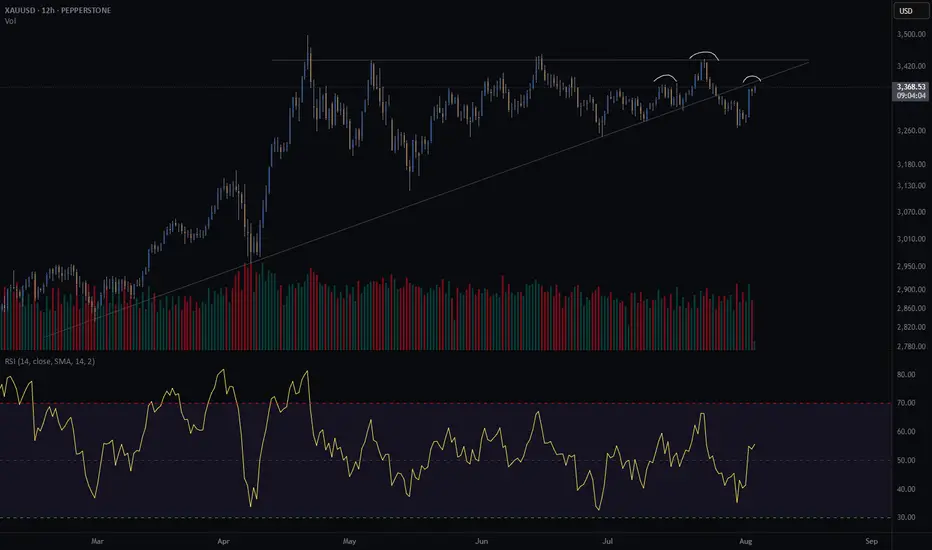
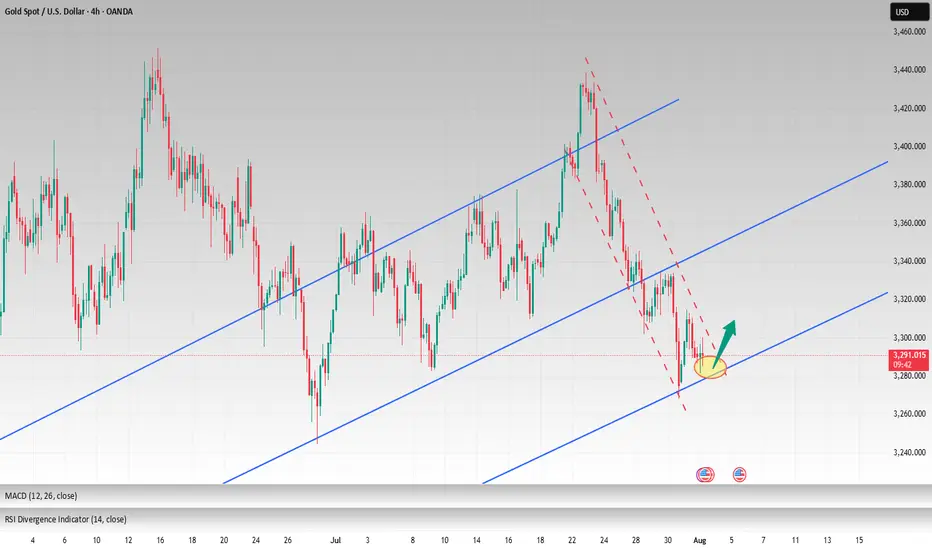
Gold crash (SHORT) - head and shouldersGold is at an interesting crossroad.
It broke through its diagonal support on Friday the 25th of July.
Price is retesting previous support. Does it turn into resistance?
Further confluence is a head and shoulders of the H8 and H12, with the right shoulder coinciding with the retest of the diagonal.
Since I am long gold with my investments, I am hesitant to short gold through my trading business. However, if my pattern is available, I take the trade. This will be a very short term trade - a few days at most if the trade goes in my favour.
Risk/reward = 12.6
Entry price = 3382.5
Stop loss price = 3396.2
Take profit level 1 (50%) = 3230
Take profit level 2 (50%) = 3181
The risk reward is exceptionally high. However, I have taken a more conservative approach with my entry because of my apprehension to short gold. For this trade I will enter at the extreme end of the range in which I will look for entries. This is the reason for such a high RR. It might result in me missing an entry.
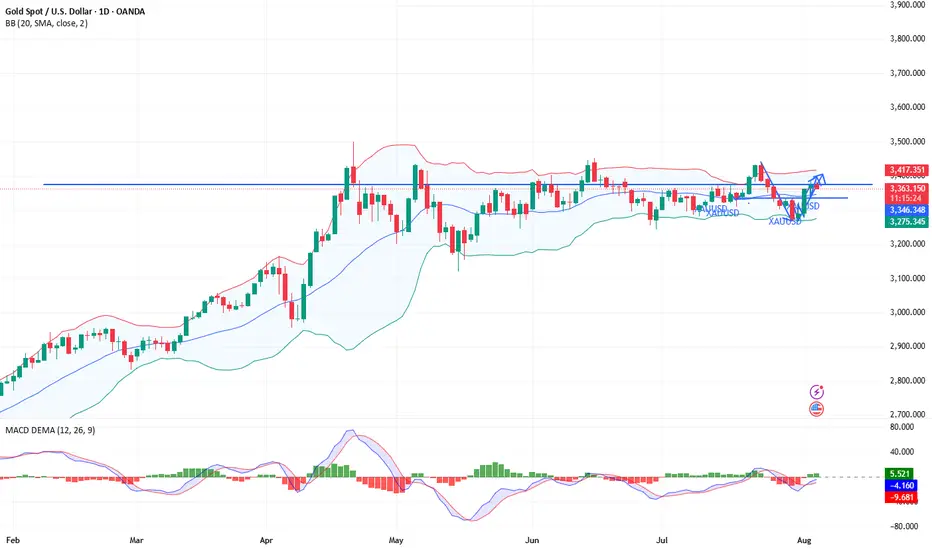
Can technical factors boost gold? (Must-read for traders)After three consecutive days of strong rebounds, spot gold has entered a period of sideways trading, trading around $3,370 in the European session, with a short-term seesaw pattern. A slight rebound in the US dollar index has weighed on gold prices, but market expectations of a September Fed rate cut remain supportive. Furthermore, lingering global trade uncertainty has prevented a significant decline in safe-haven demand.
Fundamentals:
Gold's recent upward momentum has been driven by weak US economic data and rising expectations of rate cuts. Last week's non-farm payroll data showed a significant weakening in the labor market, reinforcing market bets that the Fed will begin another round of rate cuts in September. The CME FedWatch tool shows that the market's expectation of a September rate cut has exceeded 90%. Meanwhile, US factory orders plummeted 4.8% in June, further highlighting economic weakness.
On the other hand, US President Trump signed an executive order last week raising tariffs on imports from dozens of countries, with the minimum tariff rate reaching 15% for countries with trade deficits with the US. With these measures about to take effect, this uncertainty continues to weigh on global market sentiment and supports gold's safe-haven properties.
However, a slight rebound in the US dollar partially offset gold's upward momentum. Traders will be watching the upcoming US ISM Services PMI data to determine whether the economic slowdown has spread to the services sector.
Technical Analysis:
On the daily chart, gold prices have recently traded between the middle and upper Bollinger Bands (3343.59) and 3411.09, failing to break through key resistance. The overall trend remains within the medium-term range, with no clear trend emerging.
The recent candlestick chart pattern forms a typical "sideways fluctuation" pattern, indicating significant pressure near the previous high of 3438.80, while the lower Bollinger Band (3276.09) provides support, suggesting a short-term "box consolidation" pattern.
On the MACD indicator, the fast and slow lines are near the zero axis, while the DIFF and DEA lines have formed a slight golden cross, but the angle is gentle. The red bar has limited momentum, indicating insufficient upward momentum and a lack of a strong rebound.
The Relative Strength Index (RSI) remained at 54.81, within the neutral to strong range, indicating a lack of clear short-term price direction. Market sentiment remains cautious. Further attention will be paid to whether the price stabilizes above the middle Bollinger Band or retreats to test previous support levels.
Market Sentiment Observation:
Current gold market sentiment is cautiously optimistic. Traders are pricing in a high level of interest in the Federal Reserve's rate cut, driving a short-term rebound in gold prices. However, the dollar's resilience remains, limiting gold's upside potential. Indicators show a lack of significant inflows into gold ETFs, suggesting the market has not yet fully shifted to a defensive position.
The technical chart shows a typical "consolidation platform," indicating that the market is awaiting clearer policy or data guidance. Investors remain interested in safe-haven assets, but their willingness to chase higher prices is weak. In the short term, market sentiment may continue to be constrained by fluctuations in external macroeconomic data and shifting policy expectations.
Market Outlook:
Bull Perspective:
Analysts believe that if gold prices break through the upper Bollinger Band at 3411.09 and the MACD indicator expands, further upside potential is expected, with the previous high of $3450 in sight. If the Federal Reserve signals a clear interest rate cut or if the US economy continues to weaken, gold could see a mid-term trend reversal and resume its upward trend.
Bear Perspective:
Analysts believe that if gold prices remain constrained in the 3400-3411 range and fall below the middle Bollinger Band and moving average support, a short-term pullback could occur, testing the lower support band at $3276. If the ISM Services PMI exceeds expectations and the US dollar strengthens again, gold could return to bearish momentum. FOREXCOM:XAUUSD ACTIVTRADES:GOLD ICMARKETS:XAUUSD CMCMARKETS:GOLD PYTH:XAUUSD FOREXCOM:GOLD ICMARKETS:XAUUSD CMCMARKETS:GOLDZ2025 CMCMARKETS:GOLD
XAUUSD Smart Money Concept (SMC) Setup – 15min We had a clear break of structure (BOS) to the downside after price formed a lower high around the 3,430 level. Price then swept liquidity below the 3,290 area before aggressively rallying.
🔸 Liquidity Grab + Return to Premium:
That strong bullish move was likely engineered to grab liquidity from trapped sellers and induce breakout buyers. Now price is approaching a premium zone (the red supply zone), which aligns with a previous demand turned supply area – a perfect spot for institutional order blocks.
🔸 Order Block:
The red zone (around 3,375–3,385) represents a bearish order block, which caused the previous drop. Price is now retracing into it.
🔸 Internal Structure:
While approaching this zone, price is showing signs of bullish exhaustion. If we get a change of character (CHOCH) inside that zone, it confirms redistribution and signals entry.
📌 Trade Idea (SMC-Based Plan):
POI (Point of Interest): 3,375 – 3,385 (Supply / Order Block)
Confirmation: CHOCH / Rejection wick / Bearish engulfing
Entry: On confirmation inside red zone
SL: Just above the order block (~3,392)
TP1: 3,320 (first internal liquidity pool)
TP2: 3,290 (external liquidity sweep area)
🔽 Expectation:
Price to react to the supply zone, break internal structure, and begin a bearish move back to the demand zone, filling the imbalance left during the previous pump.
🛑 Risk Disclaimer:
This is not financial advice. Trade at your own risk. Use proper risk management and wait for confirmation before entering.

GOLD (XAU) SHORT - Double top 30minRisk/reward = 2.8
Entry price = 3382.5
Stop loss price = 3390.5
Take profit level 1 (50%) = 3361.7
Take profit level 2 (50%) = 3356
I am considering a short on gold.
Still need some variables to fall into place before I enter the trade.
There is nice RSI negative divergence showing declining momentum.
Further confluence:
- Potential head and shoulders on higher time frame
- At area of previous diagonal support which could be turned into resistance if the 30min double top plays out
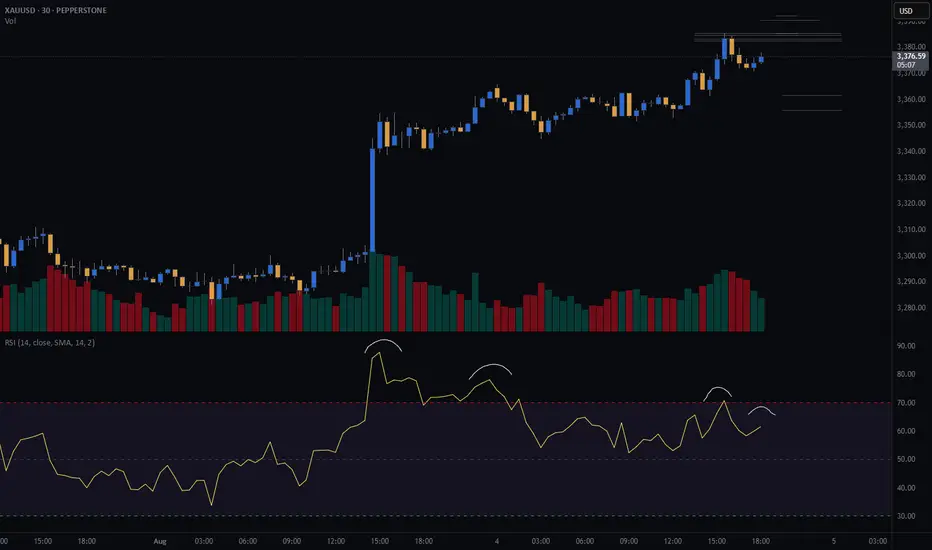
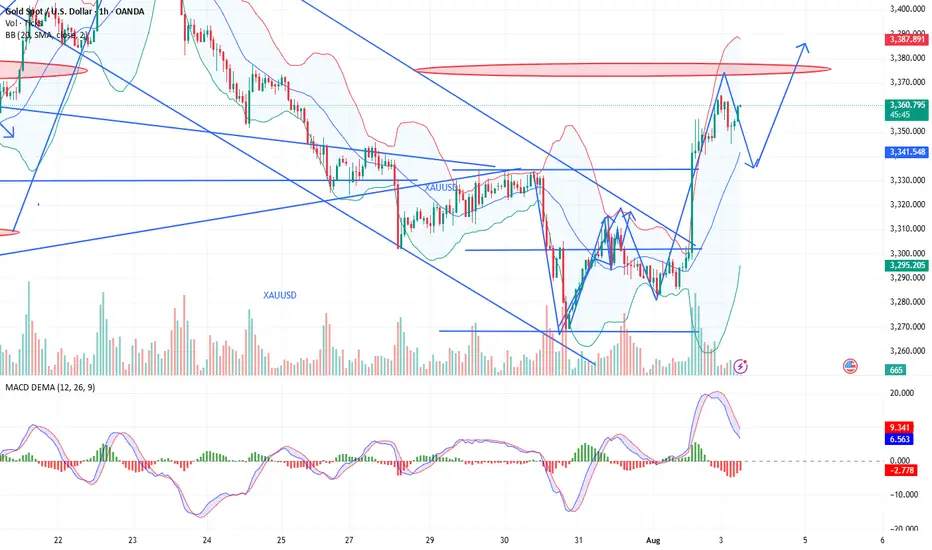
XAUUSD shows short-term bearish divergence.XAUUSD shows short-term bearish divergence.
On August 1 gold increased dramatically after the NFP report data came out. No wonder, recession risks generally drive XAUUSD higher due to increased safe-haven demand, a weaker dollar, and expectations of lower interest rates. Gold’s negative correlation with equities and its role as an inflation hedge make it a preferred asset during economic uncertainty.
However, on short-term timeframe, the bullion shows bearish divergence, the asset is to overbought and needs some downward correction in order to cool down a bit. Additionally, the price is retesting former trendline from below. The decline towards 3,300.00 is expected.

How to seize the key turning points in the gold market?The market is ever-changing, and following the trend is the best strategy. When the trend emerges, jump in; don't buy against it, or you'll suffer. Remember not to act on impulse when trading. The market is a haven for all kinds of resistance, so don't hold onto positions. I'm sure many people have experienced this: the more you hold onto positions, the more panic you become, leading to ever-increasing losses, poor sleep, and missed opportunities. If you share these concerns, why not try following Tian Haoyang's lead and see if it can open your eyes? I'm always here for you if you need help, but how can I help you if you don't even offer a hand?
Gold did not fall below 3280 during the day on Friday and started to fluctuate in the range of 3280-3300. The non-farm payroll data was bullish, and it directly broke through the pressure of 3315, and then broke through the important pressure of 3335 again. As of now, it has reached a high near 3355. The non-farm payroll data market has almost been exhausted. Next, we will focus on the technical form adjustment. At present, you can consider light shorting in the area near 3355-3370. After all, chasing long is risky, and the technical side needs to be adjusted. If your current operation is not ideal, I hope I can help you avoid detours in your investment. Welcome to communicate with me.
Based on the 4-hour chart, short-term resistance is near 3355-3365, with a focus on the key resistance level of 3370-3375. Short-term buy orders should be taken if a rebound continues. I'll provide detailed trading strategies at the bottom of the page, so stay tuned.
Gold operation strategy: Short gold in batches when gold rebounds to 3355-3370, with the target being the area around 3340-3335. Continue to hold if it breaks through.

Gold is significantly bullish, where can we short?The positive non-farm payroll report pushed the market from 3300 directly above 3330, demonstrating overall bullish momentum. Congratulations again, everyone. Real-time strategies are like a beacon guiding your investment journey. The market will never disappoint those who persevere and explore wisely. Charlie advises against blindly chasing highs. Trading advice (first hit is valid): Focus on key support levels: 3300 and 3310. Go long if these levels are reached.
~For those who want to go short above 3350-55, only use a stop-loss and feel free to try~ PEPPERSTONE:XAUUSD FXOPEN:XAUUSD ACTIVTRADES:GOLD FXOPEN:XAUUSD CMCMARKETS:GOLD VANTAGE:XAUUSD VELOCITY:GOLD
NF news, can gold selling pressure drop to 3240?⭐️GOLDEN INFORMATION:
Gold (XAU/USD) is trading lower, around $3,285 in early Asian hours on Friday, as a firmer U.S. dollar weighs on the non-yielding metal following new tariff measures announced by President Donald Trump.
The White House said late Thursday that Trump will set a 10% baseline tariff, stepping back from earlier speculation about hikes to 15% or higher, according to Bloomberg. He also signed an executive order raising the tariff on Canada from 25% to 35%, effective August 1, 2025, while extending Mexico’s current tariff rates for another 90 days to allow more time for negotiations.
⭐️Personal comments NOVA:
large frame, gold price is still moving in the downtrend line. will wait for NF result to have strong selling force again 3240
⭐️SET UP GOLD PRICE:
🔥SELL GOLD zone: 3374- 3376 SL 3381
TP1: $3365
TP2: $3350
TP3: $3333
🔥BUY GOLD zone: $3242-$3240 SL $3235
TP1: $3255
TP2: $3268
TP3: $3280
⭐️Technical analysis:
Based on technical indicators EMA 34, EMA89 and support resistance areas to set up a reasonable SELL order.
⭐️NOTE:
Note: Nova wishes traders to manage their capital well
- take the number of lots that match your capital
- Takeprofit equal to 4-6% of capital account
- Stoplose equal to 2-3% of capital account

XAUUSD 4H – Massive Sell Setup: Gold Crash Incoming? Gold (XAUUSD) just tapped into a key liquidity zone near the 38.2% Fibonacci retracement at $3,364, followed by a sharp rejection. This aligns with the upper channel resistance and a bearish confluence from previous supply zones.
Price has failed to break above the dynamic EMA cluster and is showing signs of exhaustion after a relief rally. If momentum follows through, this could mark the beginning of a deeper selloff targeting major downside levels.
Short Setup
Entry: Around $3,349–$3,364 (rejection zone)
SL: Above $3,379
🚨Strong bearish engulfing candle confirms seller pressure
🎯 Take Profit Targets (Fibonacci):
TP1: $3,305 (38.2%)
TP2: $3,275 (61.8%)
TP3: $3,241 (Full move – 100% Fibonacci extension)
This setup offers high risk-reward if the rejection holds and price breaks below the mid-zone structure at $3,330. A drop below $3,305 could accelerate the move as liquidity gets swept.

How to maintain stable operations before NFP dataYesterday, gold closed the month with a long upper shadow doji candlestick, indicating strong upward pressure, with monthly resistance at 3439-3451. Today marks the beginning of the month, and with the release of numerous data indicators such as NFP, unemployment benefits, and PMI, there is considerable uncertainty, so intraday trading should proceed with caution.
Judging from the daily chart, the current MACD indicator is dead cross with large volume, and the smart indicator is running oversold, indicating a low-level fluctuation trend during the day. At present, we need to pay attention to the SMA60 moving average and the daily middle track corresponding to 3327-3337 on the upper side, and pay attention to the intraday low around 3280 on the lower side. The lows of the previous two days at 3275-3268 cannot be ignored. There is a possibility that the low-level oscillation will touch the previous low again.
From the 4H chart, technical indicators are currently flat, with no significant short-term fluctuations expected. Low-level volatility is expected to persist within the day. Then just focus on the support near 3275 below and the middle track pressure near 3307 above. Looking at the hourly chart, gold is currently oscillating below the mid-range band, with resistance at 3295-3307 to watch in the short term.
Overall, the market is expected to remain volatile before the release of today's data. Based on Wednesday's ADP data, this round of data is also expected to be around $100,000. The contrast between ADP and NFP last time deserves our caution. The current market is basically optimistic about the short-selling situation, which is exactly what I am most worried about. If the gold price can stabilize above 3,300 before the NY data, the possibility of NFP data being bullish cannot be ruled out.
Intraday European trading suggestion: if the current gold price falls back to 3285-3280 and stabilizes, you can consider short-term long positions, with the target at 3295-3305. If the gold price tests the low of 3275-3268 again and does not break through, you can consider a second chance to go long. After making a profit of $10-20, you can consider exiting the market with profits. The market is volatile and unstable, so be sure to bring SL with you and pay close attention to the impact of the NFP data. Conservative investors can enter the market after the data is released.
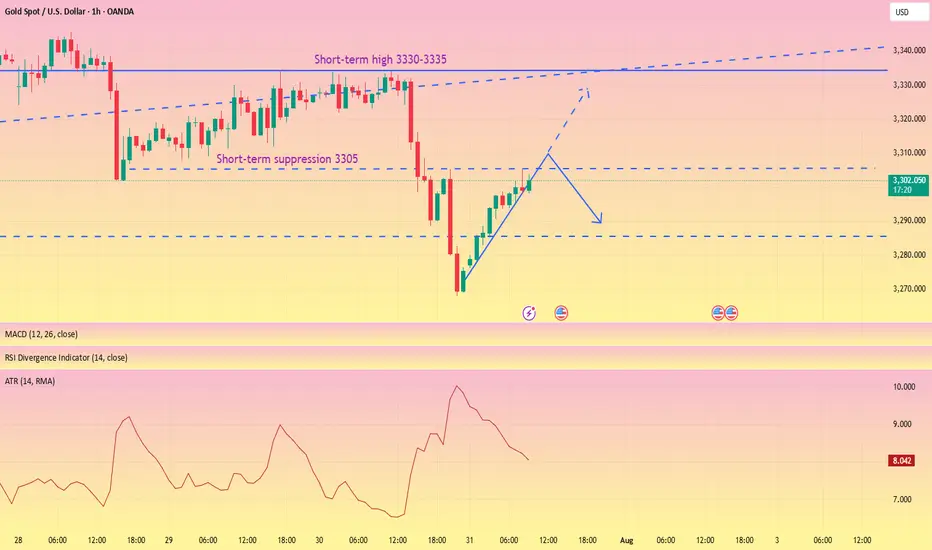
The rebound is weak, short orders intervene#XAUUSD
After two consecutive trading days of volatility, gold finally began to fall under pressure near 3335. After breaking through the 3300 mark, the price of gold accelerated its decline, reaching a low of around 3268, and yesterday's daily line closed with a large negative line. 📊
Today's rebound is more likely to be based on the buffering performance of the impact of news. The ATR data also shows that the bullish momentum is slowly weakening in the short term. 🐻After digesting the impact of yesterday's news through rebound during the day, it may fall again in the future.📉
📎The primary focus today is 3305 above, which was also the high point of yesterday's pullback correction. If the gold price rebounds to 3305-3320 and encounters resistance and pressure,📉 you can consider shorting and look towards 3290-3270.🎯
If the short-term gold rebound momentum is strong and breaks through the 3305-3320 resistance area, it will be necessary to stop loss in time. Gold may be expected to touch yesterday's high resistance of 3330-3335, which is the second point to consider shorting during the day.💡
🚀 SELL 3305-3320
🚀 TP 3290-3270