XAUUSD:Short mainly
Gold continued its pullback last week, bouncing back after meeting key support and closing below the negative shadow line. At the present stage, the trend is relying on the key support level shock, and the rebound has not made a breakthrough, the pressure after the retreat of risk aversion is more and more obvious, and there is still the possibility of deepening the decline.
Today's trend personal expected sideways shock, short-term pressure above 3245-3250, can be around this area short, below the first support to see 3200, after breaking the 3145-3150.
This week's overall operating range relies on the 3145-3250 range band.
↓↓↓ The detailed strategy club will have tips, updated daily, come and get them →→→
Goldsell

Gold Sell Setup: Bearish Price Action Points to 3092!Hello traders,
I'm currently keeping a close eye on Gold (XAU/USD) for potential short setups. Recent price action shows clear bearish pressure, with Lower Highs (LHs) and Lower Lows (LLs) forming consistently — a strong indication that bulls are losing control and sellers are still in charge.
I'm particularly watching the internal highs around the 3265 zone. I’m anticipating a possible liquidity sweep above that level — a fake breakout that could tap into the daily imbalance zone (highlighted on the chart below). If price reacts bearishly from that area, I’ll be looking for confirmation to go short.
GOLD Daily
My short-term target for this sell idea is around 3092, just below last week's low.
That’s my current perspective on Gold — what are your thoughts?
Feel free to drop your analysis or any alternative views in the comment section below. Let’s learn and grow together!

Gold Alert: Short-Term Drop Ahead?🔴Trump’s Tariffs Eased, but U.S. Recession Risk Doubles!
Although President Trump has temporarily de-escalated trade tensions—helping U.S. stocks rebound—the risk of a U.S. recession in the next 12 months has doubled, according to a survey by the Philadelphia Fed, rising from 15.4% to 37%.
Experts warn that prolonged uncertainty from the trade war is making businesses and consumers more cautious, increasing the risks of slower growth and rising unemployment.
The U.S. GDP growth forecast for 2025 has been revised down to just 1.4%, the lowest in 16 years (excluding the pandemic). Meanwhile, public sentiment has slightly improved, thanks to signs of a temporary easing from the Trump administration.
⚠️ Gold price has recovered in the European session, returning to the old peak area, trading sideways around 3250. Bearish pressure continues to build. This is a signal traders need to watch closely.
💡 Short-Term Trade Scenarios:
SELL XAU: zone 3248-3251 scalping
💰 TP: 50 - 100 - 200 pis
🚨 SL: 3254

How to layout in the battle between long and short positionsGold surged directly at the opening, which is in line with our analysis expectations. We gave a short position near 3240-45. As expected, gold fell to the 3230 line for profit. There is great pressure from above and limited space above. Up to now, it has been fluctuating near 3220. For gold, we are now focusing on the short-term support of 3200-06. If it breaks through this position, it is very likely to go to the 3175-90 line.
From the current trend analysis, today's support continues to focus on 3170-80, strong support 3150, and upper pressure 3253-60. Relying on this range as a whole, the main tone of high-altitude low-multiple cycle participation remains unchanged. In the middle position, you must watch more and move less, be cautious in chasing orders, and wait patiently for key points to enter the market. I will notify you of the specific operation strategy in time and pay attention to it in time.
Gold operation strategy: short gold rebound near 3240-50, target 3230-3220. Pay attention to the support of 3202 and 3175 below, and go long according to the strength of the decline!

Swing analysis on Gold of target achieving storyHow far accuracy goes in your analysis ??
swing analysis in Gold.
Follow for more simple and accurate analysis of INDEX |COMMODITIES| CURRENCY

Gold layout summary and forecast for next week
Before the fishermen went out to sea, they didn't know where the fish were? But they still chose to go because they believed they would return with a full load. When you invest, you don't know whether you can make a profit, but you still need to try. Success is not something that will happen in the future, but from the moment you choose and decide to do it, you will gain something if you insist on believing. The same is true for gold investment. You may still be losing money at the moment, but as long as you find me, all losses will be solved!
Views on the trend of gold next week!
Gold continued its downward trend on Friday. In the morning, there was another long-short wash and returned to the 3200 mark. The daily line closed with a small negative line. Then we have to consider a problem now, that is, whether the daily line will form a continuous decline. In the daily rhythm, we can see that the position of the high point has been declining, which means that after the top resistance level of the three-point line is blocked, it is easy to form a secondary turning point of the trend downward, which means that next week we still have to look at the retracement.
As for the future market direction, the short-term bearish trend will continue to be the theme! On the whole, the gold price rebounded in 4 hours and made a backtest. If the rebound does not break the resistance, it will continue to fall, and the direction of the decline will continue! After the short turning point turned downward from the high point, the current short trend is still extending downward, that is to say, before the short reaches the key node and the long builds a bottom, the rebound is still the main rhythm!
Gold: Enter short orders near 3212 next week, defend 22, and target 3180-60!

Gold ended this week successfully!In terms of news, first, the easing of the trade situation weakened the safe-haven property of gold. Secondly, a series of data released this week and the Fed's emphasis on not rushing to cut interest rates also suppressed the gold price. In addition, the parties involved in geopolitical conflicts also began talks. Although there are differences in negotiating positions, they still have to solve the problem when they can sit down and talk. Because of the repeated news, the closing price at the end of the week was also above 3200, so some people still believe that the gold price will go to 3500, and even think that it will exceed this position. I have mentioned this in my previous analysis. The gold price was first stimulated by multiple news and buying rushed up. Now that the risk aversion has receded, I think it is reasonable to see the gold price fall.
Let's analyze it from the technical side: the rhythm of gold has changed rapidly recently, and next Monday is actually the key. The 1-hour moving average of gold has begun to show signs of turning around, so whether it can form a golden cross upwards is the key next time, or it will oscillate a few times and continue to diverge downward. The strength of gold on Monday is very critical. Gold closed with a big positive line on Thursday, which was a very fast trend. However, it fell directly on Tuesday and broke through more than half, so it cannot be said that the bulls are strong. Although it rebounded slightly in the late trading, it still closed with a big negative line. There will be two key positions on Monday next week. Pay attention to 3180 on the bottom of gold. If it falls below 3180 soon after the opening on Monday, then gold will still be weak as a whole. Pay attention to 3215 on the top. If gold breaks through 3215, then gold will be strong as a whole. If gold opens flat on Monday and the upward momentum is not strong, and it is under pressure at 3215, then you can continue to go short in the short term.
TVC:GOLD OANDA:XAUUSD FOREXCOM:XAUUSD

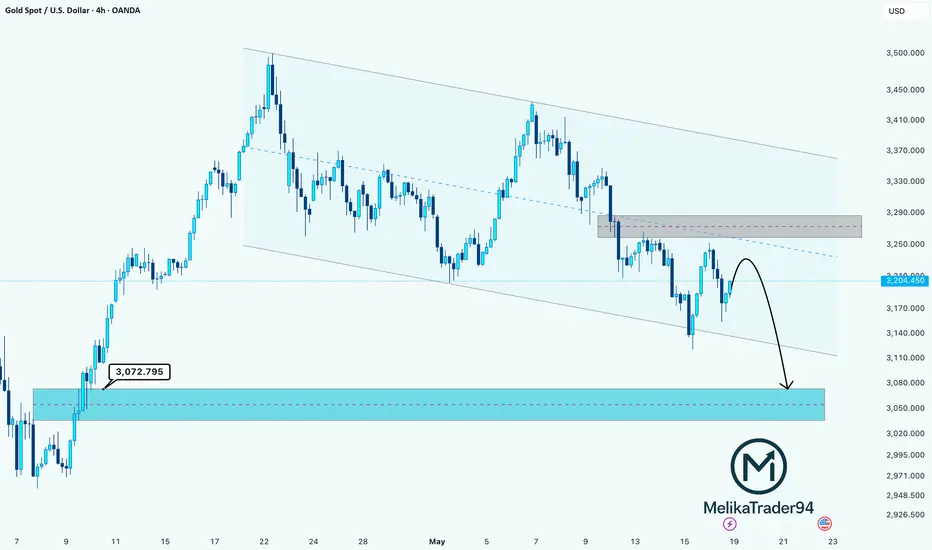
GOLD (XAU/USD) Bearish Play Setting UpHello guys!
Gold is currently respecting a bearish descending channel, forming clean lower highs and lows. After tapping into the supply zone around 3,285–3,295, the price is showing signs of exhaustion.
Now, a potential rejection from this zone could trigger another leg down targeting the demand zone around 3,060–3,080.
🧠 What I see:
🔹 Bearish channel = trending lower
🔹 Clean retest of supply block
🔹 Price respecting midline resistance
🔹 Momentum favors sellers
🎯 Bearish Trade Idea (Not financial advice):
Entry zone: 3,240–3,260 (on confirmation candle)
TP1: 3,110
TP2: 3,072 (demand zone)
📐 Risk/Reward: 1:2+ potential
💡 Watch for confirmation candlesticks near the supply zone for safer entries.
GOLD MARKET OVERVIEW – WEEKLY SUMMARY 📉 Key Developments
• Gold price (XAU/USD) dropped from a weekly high of $3,252 to a low of $3,154, indicating strong selling pressure.
• U.S. bond yields have edged higher, making gold less attractive to investors.
• Recent inflation data suggests the Federal Reserve may maintain higher interest rates for longer, adding downward pressure on gold.
• Profit-taking has intensified following a strong rally in previous weeks when gold hit multiple all-time highs.
🔮 Expected Short-Term Scenario
• Market sentiment leans towards profit-taking, especially since the $3,200–$3,250 zone has failed to hold.
• The inability to sustain higher levels indicates weakening buying momentum, increasing the likelihood of a deeper correction.
• Over the past week, gold formed strong bearish candles and repeatedly tested the $3,150 support zone, signaling that this level is weakening and could be broken soon.
📉 Conclusion & Outlook for Next Week
Based on:
• Weak price behavior
• Negative technical indicators
• Profit-taking sentiment
• Bearish macroeconomic backdrop
→ The scenario of breaking below $3,150 support and continuing downward toward $3,100 or lower is highly plausible in the coming week.
📌 SHORT-TERM TRADING STRATEGIES
🔻 SELL
• Entry Zone (SELL): 3245 – 3248
• Take Profit (TP): 3235 – 3238
• Stop Loss (SL): 3253
🔼 BUY
• Entry Zone (BUY): 3120 – 3123
• Take Profit (TP): 3133 – 3135
• Stop Loss (SL): 3116
🔁 Note: Only enter trades based on clear confirmation signals. Manage risk carefully — limit exposure to no more than 1–2% of your account per trade.


Gold still has room to fall and rebounds to continue to shortGold fell as expected in the Asian session, which was in line with our thinking and expectations. Our short position was shorted near 3237-38 and exited with profit, and then shorted near 3194 and exited with profit again, and we made good profits both times. There are many people who followed the trend and went long in today's market, or even chased the long position, and without exception, they were trapped and wailing. We have repeatedly emphasized that we should treat it with a sweeping approach, and different market rhythms should be responded to with different methods. Judging from the current market trend, the European session continues to weaken. The focus should be on the gains and losses of 3180 support. If it breaks through, it will continue to look at 3150 and 3120. In this case, the short-term will return to weakness. If it does not break, we will look at a wide sweeping range. The upper pressure will focus on 3200, 3215, and 3230. The rebound will be mainly high. The weekly line will be closed tonight, and volatility will intensify.

Gold Sell to 3080? Gold just broke the channel.
There is a potential bearish move to 3080 and if that breaks, 3050

Gold-----Buy near 3170-3180, target 3200-3230Gold market analysis:
Recently, gold trading has been very fierce. Yesterday, there was a sharp drop and then a sharp rise, with a range of 200 points. This range is rare in history. We have said many times before that the fluctuation rhythm of gold this year is the largest in history. Before, it fluctuated by 200 points in a month, and now it can fluctuate by 200 points in a day. The market is ever-changing. In such a market, ordinary investors need to take losses. Only if you take losses, it means you have made a mistake. At most, you can get out. Don't increase the bet repeatedly, which will make you die very quickly. Don't fight against the market. It is always right and you are always wrong. Today's idea is that we estimate that gold will be repaired. The possibility of continuing to rise in the Asian session is gone. It rose too much yesterday. Today, it needs a repair and daily adjustment. The estimated adjustment range of the Asian session is 3192-3252, and the central axis position is around 3227. Note that the market has been sold yesterday.
In the European and American markets, we focus on the two long opportunities at 3155 and 3175. If the middle axis does not go back, you can short short. Now the rhythm is the most important. The above analysis chart shows that it is already in a V-shaped pattern. Short-term conversion to buy. If it breaks 3155, be careful that it will be washed again. The repair market can be bought and sold today. The important rhythm issue is.
Fundamental analysis:
Recently, there are a lot of fundamentals, but there are relatively few data. The impact on the market is also very large. The Sino-US trade negotiations, the Russian-Ukrainian negotiations, and the India-Pakistan ceasefire have all affected the market.
Operational suggestions
Gold-----Buy near 3170-3180, target 3200-3230

XAU/USD(20250516) Today's AnalysisMarket news:
Fed Chairman Powell: The Fed is adjusting its overall policy-making framework. Zero interest rate is no longer a basic situation. The wording of underemployment and average inflation rate needs to be reconsidered. PCE is expected to drop to 2.2% in April.
Technical analysis:
Today's buying and selling boundaries:
3200
Support and resistance levels:
3318
3274
3245
3154
3125
3081
Trading strategy:
If the price breaks through 3245, consider buying, the first target price is 3274
If the price breaks through 3200, consider selling, the first target price is 3154

Technical & Historical Key TakeawaysThis chart analyzes the historical price cycles of Gold (XAU/USD) over the past decades, focusing on the alternation between long bull runs and prolonged bear markets.
You highlighted clear phases:
1970 - 1980: 10-year Bull Run
Massive price rally, followed by a sharp correction.
1980 - 2001: 20-year Bear Market
Prolonged sideways and downward movement.
2001 - 2011: 10-year Bull Run
Strong upward trend, reaching new all-time highs.
2011 - 2016: 5-year Bear Market
Significant correction but shorter in duration.
2016 - 2025: 10-year Bull Run
Another strong bullish phase, possibly ending in May 2025.
🔮 Scenarios projected:
Scenario 1 (Blue path):
A shorter bear market (5 years) similar to 2011-2016 correction, then continuation of the long-term uptrend.
Scenario 2 (Yellow path):
Gold enters a long-term 20-year bear market, similar to what happened post-1980.
You are asking if Gold is now entering a short bear phase (Scenario 1) or will fall into a multi-decade bear market (Scenario 2).
Cyclicality of Gold:
Gold has shown repetitive cycles of 10-year bull runs followed by either short (5-year) or long (20-year) bear markets.
These cycles seem to reflect macroeconomic shifts (inflation, interest rates, global crises).
Current Cycle (2016 - 2025):
If we respect the pattern, May 2025 might mark the end of the current bull cycle, opening the door to a corrective phase.
Scenario 1 favors a soft correction:
Based on the last cycle (2011-2016), a 5-year bear market might occur.
This would keep the long-term bullish trend alive, especially if macroeconomic conditions stay inflationary or geopolitical risks remain high.
Scenario 2 warns of a harsh bear market:
If history repeats the 1980-2001 phase, gold could enter a multi-decade bear market, driven by reduced inflation fears, strong dollar cycles, or financial system stability.
Key Indicators to watch:
Real interest rates.
USD strength vs global currencies.
Demand from central banks and emerging markets.
Geopolitical tensions and inflation expectations.

Long orders are trapped,what should we do with the US gold marke🗞News side:
1. India considers using new Indus River project to cut water supply to Pakistan.
2. Pay attention to the news of Russia-Ukraine ceasefire negotiations today
📈Technical aspects:
Gold once fell to around 3170, which is in line with our judgment of bullish weakness. This is why we are not in a hurry to participate in long orders today. I know that many bros also listened to the outside world and went long around 3200, which led to being trapped. At present, the gold price is constantly testing the 3170 support line. If it falls below, it will look to the 3150 support line. If it does not break, it will be treated as a shock. On the top, temporarily pay attention to the 3205-3215 line of resistance. If it encounters resistance and pressure, go short. On the bottom, first pay attention to the 3170 support line, and then pay attention to the 3150-3140 support line. Hold if it breaks.
If you agree with this view, or have a better idea, please leave a message in the comment area. I look forward to hearing different voices.
OANDA:XAUUSD FX:XAUUSD TVC:GOLD FXOPEN:XAUUSD FOREXCOM:XAUUSD

SHORT - GOLD (XAU/USD): Decending Triangle on GOLD Good Morning, Traders.
As always, please note that this is not financial advice — always do your own research (DYOR).
This morning, we are observing the development of a descending triangle pattern on the 15-minute timeframe, forming at a critical support level. This technical formation is often indicative of bearish momentum.
Should the price action decisively break below this key support, it would signal a potential shorting opportunity. Such a breakdown could trigger accelerated selling pressure, offering the possibility of favourable risk-to-reward setups for short positions.
Traders are advised to closely monitor price behavior around the support line, watch for increased volume on the break, and ensure proper risk management before entering any positions.
Stay vigilant and trade smart.

GOLD Update – Short Opportunity After Pullback! Gold traders! 💛 Our key support zone (3,212 - 3,196) has just been broken, and price is now consolidating below! 🎯
We previously took big profits from this level (our followers know!), and now we’re waiting for a pullback to enter a high-probability short trade!
⚡️ Golden Rule:
✅ If price retests the level as new resistance, go SHORT!
✅ If it reverses and breaks back above, consider a LONG!
📌 Always trade with a strategy—be ready for any scenario!
💸 The Secret to Trading Success:
🔹 Keep losses small & controlled.
🔹 Let profits run & grow!
🔹 We can’t control the market, but we CAN control our risk!
🚀 Gold is always hot—what’s your take?
👇 What’s your analysis on this move?
For detailed entry points, trade management, and high-probability setups, follow the channel:
ForexCSP

XAUUSD remains bearish unless it breaks 3265🗞News side:
1. India considers using new Indus River project to cut water supply to Pakistan.
2. Pay attention to the news of Russia-Ukraine ceasefire negotiations today
📈Technical aspects:
Today's opening correction is due to technical repair and adjustment, which is why I shorted. The support of 3200-3210 is of great significance to the short-term trend. If it can be supported here again, it may further promote the upward expansion space. However, after the rebound in the morning Asian session, it did not break through the 3265 line. On the contrary, the bulls began to weaken. Today is Friday, and the market is not expected to show a unilateral strong attitude. It will be treated as a shock during the day. Before breaking through 3265 above, we can short at a small level during the intraday rebound. Short-term operation suggestions, temporarily look at 3235-3240 on the upper side, and look at the support of 3210-3200 on the lower side.
If you agree with this view, or have a better idea, please leave a message in the comment area. I look forward to hearing different voices.
FOREXCOM:XAUUSD FXOPEN:XAUUSD TVC:GOLD FX:XAUUSD OANDA:XAUUSD

Can a V-shaped reversal continue the bull market?🗞News side:
1. Hamas official: If a permanent ceasefire is achieved, control of the Gaza Strip can be handed over
2. Fed Chairman Powell: The Fed is adjusting its overall policy-making framework. Zero interest rates are no longer a basic situation. The wording of underemployment and average inflation rate needs to be reconsidered. PCE is expected to fall to 2.2% in April.
3. Russia and Ukraine reached a ceasefire at the technical level
📈Technical aspects:
Yesterday, the gold price staged a V-shaped reversal and once rose to close near 3244. Although the technical indicators in the hourly chart show a favorable situation, there has been no correction in the current round of gold price increase, and the rise is slow. In addition, the RSI has entered the overbought area, so we need to be alert to the possibility of gold price correction today. Focus on the 3250-3260 resistance on the top and the 3210-3200 support on the bottom.
SELL 3245-3250 TP 3210-3200
If you agree with this view, or have a better idea, please leave a message in the comment area. I look forward to hearing different voices.
OANDA:XAUUSD FX:XAUUSD TVC:GOLD FXOPEN:XAUUSD FOREXCOM:XAUUSD

Continue to short goldTechnical aspect:
Gold rebounded gradually after hitting 3120, and has now rebounded to around 3200. Where will gold rebound? Is there still a chance to continue to short gold?
In fact, from the current structure, gold has not shown a clear bottoming signal, so this wave of rebound can only be regarded as a technical repair after the decline; however, the rebound from 3120 to around 3200 is not small, which will significantly increase the probability of 3120 as a short-term bottom; so where will gold rise? I think gold is currently under resistance in the 3200-3210 area, and it may be difficult to break through this resistance area in a short period of time. When facing this resistance area, gold may fall under pressure and test the 3165-6155 area again;
If gold really needs to form a reversal structure, it is necessary for gold to retest the 3165-3155 area support again and form a "W" double bottom structure with the 3120 low; only in this way can a complete reversal structure be formed.
Trading strategy:
Consider continuing to short gold in the 3195-3205 area, TP: 3165-3155

Gold V-shaped reversal? How to solve the short order quilt🗞News side:
1.PPI has fallen for three consecutive months
2. Russia-Ukraine talks are ongoing
3. Powell says the era of long-term low interest rates is over
📈Technical aspects:
Gold rebounded from oversold in the European session, hitting a low of 3120 before pulling back and rising. After a second retracement to confirm 3130, it made a V-shaped reversal. Currently, gold is still testing the 3190-3200 resistance line. Before breaking the resistance range, gold may still usher in a second bottom detection
🎁SELL 3190-3200, SL 3210, TP 3170-3160
If you agree with this view, or have a better idea, please leave a message in the comment area. I look forward to hearing different voices.
FOREXCOM:XAUUSD FXOPEN:XAUUSD TVC:GOLD FX:XAUUSD OANDA:XAUUSD

XAU/USD) bearish trand analysis Read The ChaptianSMC Trading point update
Technical analysis of XAU/USD (Gold vs. USD) on the 4-hour timeframe suggests a bearish outlook. Here's a breakdown of the key elements:
---
Key Levels:
1. Resistance Zone (Upper Yellow Block):
Around 3,450–3,500.
Price was previously rejected from this level, forming a double-top like structure.
2. Rejection Point (Mid-Level Zone):
Near 3,300–3,310.
Price repeatedly failed to break and hold above this zone, indicating strong selling pressure.
3. Support Zone / Demand Block (Lower Yellow Block):
Around 3,100–3,125.
This is the target area, labeled clearly as TARGET POINT: 3,116.501.
---
Indicators:
200 EMA:
Currently above the price, suggesting downward momentum.
Acting as a dynamic resistance.
RSI (14):
Around 39, slightly above oversold territory (30).
Indicates bearish pressure but not yet oversold — room for further downside.
The chart suggests that if price breaks below the mid-level support, we could expect a move towards the support block around 3,116.
The bearish wave projection drawn in the chart confirms the trader’s expectation of a drop.
The setup appears to be a break-and-retest of the mid-zone, followed by continuation downward.
Mr SMC Trading point
---
Trading Idea Summary:
Bias: Bearish
Entry Trigger: Break below ~3,225–3,230 with confirmation
Target: ~3,116
Invalidation/Stop: Close above 3,300–3,310 (rejection zone)
Pales support boost 🚀 analysis follow)
