Gold on Edge – Will Powell Trigger the Drop?📈 Short-Term Trend Analysis – XAU/USD
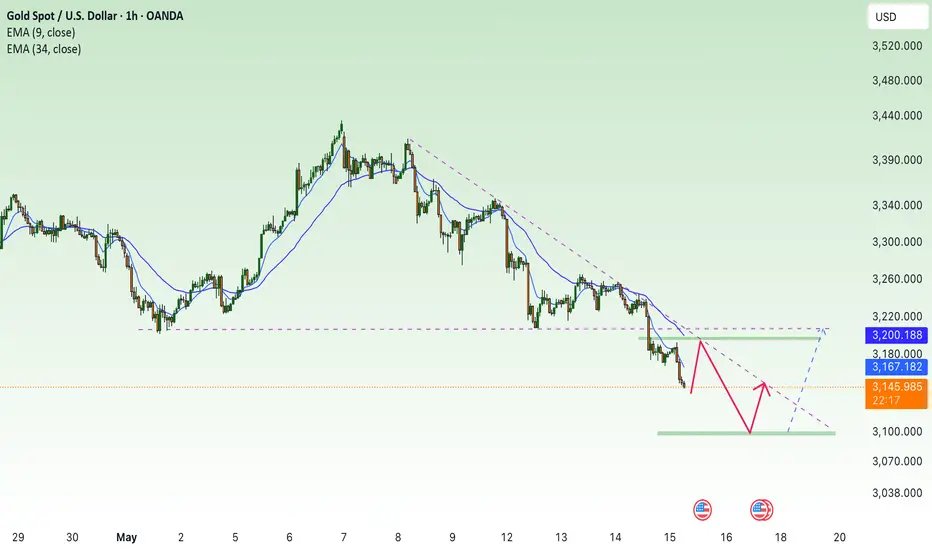
On the H1 timeframe, gold price formed a short-term top at $3,170, then sharply declined to the $3,150 area.
The current price action shows a pattern of lower highs and lower lows, indicating a clear bearish trend.
Price has broken below the EMA20 and is trading below the EMA50 on the H1 chart – signaling a loss of bullish momentum in the short term.
This reflects market hesitation ahead of key U.S. economic data and the upcoming Fed speech.
📊 Short-Term Technical Scenario
Main Scenario: SELL ON BREAK OF SUPPORT AT $3,150
Sell Entry: Below $3,148 (confirmation of support break)
Stop Loss (SL): $3,158 (above the 23.6% Fibonacci retracement)
Take Profit (TP):
TP1: $3,139 (Fibonacci 61.8%)
TP2: $3,131 (Fibonacci 78.6%)
TP3: $3,120 (strong support zone, previous swing low)
🔔 Important Notes
Closely monitor Fed Chair Jerome Powell’s speech later today. If he hints at maintaining higher interest rates, gold may continue its downward momentum.
A break below $3,120 would shift the trend from short-term bearish to medium-term bearish, with extended targets around $3,100 – $3,080.
Goldsell

The technical side collapses! Can the bear market continue?🗞News side:
1. Russia and Ukraine hold ceasefire talks
2. Initial jobless claims data released during today's US trading session
3. Trump administration exposed to trillions of national debt
📈Technical aspects:
After gold fell below 3200, it pointed directly at the 3100-3000 line. Although there has been a rebound in the process, the current short-term short-term situation has not changed. The current lack of rebound momentum in the market is mainly due to the fact that the bad news has not been completely digested. At present, the gold price has rebounded to around 3160. Above, we need to pay attention to the first-line suppression of 3168, which is the first low point in the decline, followed by the 3190-3200 resistance zone above. If the gold rebound cannot break through the 3168 point, then the gold price will most likely continue its decline, test the 3120 low again, or even move towards 3000. If the European market hits the 3168 line and encounters resistance, it can be short-term and focus on the release of initial jobless claims data in the US market.
If you agree with this view, or have a better idea, please leave a message in the comment area. I look forward to hearing different voices.
OANDA:XAUUSD FX:XAUUSD TVC:GOLD FXOPEN:XAUUSD FOREXCOM:XAUUSD

Gold, let's fall like crazy
Gold is consistent with our previous analysis. It has reached a new low recently, breaking through the key position of $3,220, ushering in a new round of decline. Some people directly said: It can't hold on.
This time, after the gold price opened lower on Monday, it has been hovering above $3,200-3,220, fluctuating back and forth, and finally failed to rebound successfully.
There are various opinions on the market about the reasons for the decline, and the key point I emphasize is: whether the decline is over must depend on whether the high point before the last decline is lost, and if the key support position is lost, it can no longer be defended.
For example: Yesterday we first entered the market near $3,220 and rebounded to around $3,243, and we have always emphasized the gains and losses of the key position of $3,215. When it is lost here, we must adjust our thinking in time. The difference between us is who can change their thinking faster at the critical moment.
For physical gold or accumulated gold, it is very passive without hedging tools. For example, when the price breaks the key position, it can only be solved by cutting losses. Because of chasing in at a high position, there is no follow-up funds to lower the cost. At the same time, the funds account for too large a proportion of their own cash flow, which will lead to passive beating.
Therefore, the market will not always rise and never fall, nor will it only fall and never rise. The key is how to balance the allocation of funds and risks, whether the key position can be accepted in time after it is lost, rather than holding on to it. Trading is not a simple one-trick win, but a flexible response. For example, gold ETF: I have always been investing weekly, from last year to now, and the proportion will not be too large. The rise and fall in the middle has almost no effect on me, and the leverage method must be to make a day-to-day settlement. If you encounter a unilateral long-term, you will take a bite, and if you don’t encounter it, you will seize the moment.
Okay, let’s talk about today’s gold market:
On Wednesday, the formula for gold application is: Asian market falls, European market continues, and the rebound before the US market is to lure more, and go short when you see a high. The Asian session fell from the high point to $3220 and has been fluctuating repeatedly. After rebounding to $3243 in the European session, it did not continue, but started a wave of decline. The key position of $3215 was broken during the US session, and the short position was confirmed at this time.
Also, today is: the previous day's weak bottom closing, the next day's early trading can still be shorted, today's pressure position is around $3195, the rebound pressure is the position of the early morning high, and then it breaks down to $3150, and the key pressure at this time is the top and bottom conversion.
As shown in the figure, after the bottom oscillation, a new high point moves down and the low point breaks, which is a typical decline. The early morning high of $3195 is the key long-short dividing point, and the top and bottom conversion becomes today's new entry position for shorting. Remember one sentence: Never look for support to go long in a falling market, but look for pressure to go short. When will the decline end: the high point before the last 1-hour or 4-hour decline is broken and closed above this position. The retracement confirms that there is no new low. The market outlook will rebound or reverse. There is no need to guess when the bottom will be reached. The bottom is found, not guessed! ! ! !
Today, gold rebounded and went short in the range of 3165-70. This is the pressure point for the top and bottom conversion. There are three short periods today: the opening rebound high, the top and bottom conversion of the European session rebound, and the rebound before the US session after the European session weakened. The defensive position is above 3195 US dollars, and the focus below is 3145-40-32 US dollars.

Gold plummets, pay attention to the 3100 first-line support🗞News side:
1. Russia and Ukraine hold ceasefire talks
2. Initial jobless claims data released during today's US trading session
3. Trump administration exposed to trillions of national debt
📈Technical aspects:
Gold has been in a sideways consolidation yesterday, and we did not have a good entry opportunity to trade in the evening. Today, it has been falling with inertia since the opening of the market. It has now fallen to around 3130, successfully breaking through 3150, the key early point. At present, the daily chart of gold is in a downward wedge arrangement, with the focus on 3130 support below and 3200 suppression above. If the European market cannot fall below 3130, then be wary of bullish counterattacks.
On the other hand, if we fall below the 3130 line, we will fall back and continue to focus on the 60-day moving average support 3105-3110 area. Therefore, in terms of operation, gold will first focus on the 3130 first-line support. If it breaks below, wait for the 3105-3110 area and then consider buying based on the long-short game. The top target is the 3190-3200 area. If it does not break 3200, then go short!
If you agree with this view, or have a better idea, please leave a message in the comment area. I look forward to hearing different voices.
FOREXCOM:XAUUSD FXOPEN:XAUUSD TVC:GOLD FX:XAUUSD OANDA:XAUUSD

Gold Holds Key Support Ahead of CPIOANDA:XAUUSD Gold (XAU/USD) edged higher to $3,255 early Tuesday as traders awaited the US April CPI report. While the 90-day US-China tariff truce improved market sentiment and limited gold’s upside, geopolitical tensions in Ukraine, the Middle East, and South Asia continue to drive safe-haven flows. A de-escalation in US-China trade tensions triggered the recent pullback, with price failing to reclaim the $3,271 resistance. The $3,213 area remains a major support. A break above $3,271 is needed to resume bullish momentum, while failure to hold $3,213 could expose $3,127.
Resistance : $3,271 , $3,305
Support : $3,213 , $3,127

Gold heads towards 3100 price zone, long or short?
📌 Driving Events
Gold prices (XAU/USD) fell for the second straight session on Thursday, the third decline in the past four days, and fell to a more than one-month low below $3,150 during the Asian trading session. The continued downward pressure is largely due to renewed optimism after signs of a substantial de-escalation in the Sino-US trade dispute, a development that has dampened demand for traditional safe-haven assets such as gold.
The announcement of a 90-day trade truce between the world's two largest economies also helped ease recession fears in the United States, prompting investors to reduce expectations for aggressive monetary easing by the Federal Reserve. The shift supported the continued rise in US Treasury yields, further suppressing demand for the non-interest-bearing gold.
📊Comment Analysis
Downtrend, bears continue to exert downward pressure on the market, heading towards the 3100 price area
⭐️Set Gold Price:
💰Strategy Package
🔥Sell Gold Area: 3178-3188 SL 3191
TP1: $3180
TP2: $3170
TP3: $3160
🔥Buy Gold Area: $3101 - $3099 SL $3094
TP1: $3110
TP2: $3120
TP3: $3130
⭐️ Note: Labaron hopes that traders can properly manage their funds
- Choose a lot size that matches your funds
- Profit is 4-7% of the fund account
- Stop loss is 1-3% of the fund account

Gold price downtrend with PPI news⭐️GOLDEN INFORMATION:
Gold prices (XAU/USD) extended their decline for a second consecutive session on Thursday, marking the third drop in the past four days and slipping to a more than one-month low below the $3,150 mark during Asian trading hours. The sustained downward pressure is largely driven by renewed optimism following signs of a meaningful de-escalation in the US-China trade dispute — a development that has dampened demand for traditional safe-haven assets like gold.
The announcement of a 90-day trade truce between the world’s two largest economies has also helped ease recession fears in the U.S., prompting investors to scale back expectations for aggressive monetary policy easing by the Federal Reserve. This shift has supported a continued rise in U.S. Treasury yields, further weighing on demand for the non-interest-bearing yellow metal.
⭐️Personal comments NOVA:
Downtrend, bears continue to put downward pressure on the market, heading towards the 3100 price zone
⭐️SET UP GOLD PRICE:
🔥SELL GOLD zone : 3198- 3200 SL 3205
TP1: $3190
TP2: $3180
TP3: $3170
🔥BUY GOLD zone: $3101 - $3099 SL $3094
TP1: $3110
TP2: $3120
TP3: $3130
⭐️Technical analysis:
Based on technical indicators EMA 34, EMA89 and support resistance areas to set up a reasonable sell order.
⭐️NOTE:
Note: Nova wishes traders to manage their capital well
- take the number of lots that match your capital
- Takeprofit equal to 4-6% of capital account
- Stoplose equal to 2-3% of capital account
Short selling on the rebound is determined to winAfter gold fell below 3202 in the US market, it rebounded to 3198 at its highest. This rebound was just an oversold rebound, and then continued to fall back. Although it has not refreshed the low point for the time being, the pattern has weakened and it is difficult to rise again in the evening. Weak shorts can hardly get past 3198. The short-term support below is 3150-3140. Gold continues to cross downward shorts in 1 hour. The short strength is still there. The rebound continues to give shorts opportunities. There is no obvious sustained upward momentum in the short term. Then such a market is just a rebound. Gold rebounds in the US market and continues to be short. On the whole, the short-term operation strategy for gold today is recommended to be short on rebounds and long on pullbacks. The short-term focus on the resistance line of 3202-3205 is on the upper side.
Gold operation strategy reference:
Strategy 1: Short gold near 3195-3205, target near 3180-3170.
Strategy 2: Long gold near 3160-3150, target near 3170-3190.

Gold rebounds weakly, US market ideas for reference!
📌 Driving factors
As Sino-US trade tensions ease, market concerns about a global recession ease, investors' risk appetite rises, and gold's attractiveness as a safe-haven asset declines, gold prices fell on Wednesday (May 14). After the tariff truce announced over the weekend, the stock market rose sharply, weakening gold's safe-haven appeal in the short term, which was an important factor that pushed gold prices to new highs in the previous few months, and it is also the starting point for the current large-scale selling!
📊Commentary Analysis
After gold fell below 3200 in the US market, it rebounded to 3198 at its highest. This rebound was just an oversold rebound, and then continued to fall back. Although it has not refreshed the low for the time being, the pattern has weakened, and it is difficult to get up again in the early morning. Weak shorts can't even get past 3198, and the short-term support below is around 3160.
The daily cycle is constructed based on the M-head pattern. 3200 is the long defensive position. If it fails to close, there will be a fall. The technical side has already experienced a major break. Pay attention to the change of thinking. If the adjustment range is large, it may even reach 2900/3000. It rises fast and falls fast, but the long-term logic of gold's rise remains unchanged. It is also an opportunity to lay out more positions, but the position needs to follow the market observation, which is difficult to predict at present.
💰Strategy Package
In the short term, we will rely on 3198 for defensive short selling. After breaking 3200, please note that even if it rebounds, we should follow the trend and short. If it rebounds upward, we should short at the golden section resistance of 3265.
Good luck to everyone!
Labaron believes that
Guaranteeing the principal is the bottom line for survival, controlling risks is the armor for survival, earning income is a stage medal, and long-term stable and continuous profit is the only certificate to finally stand up from the sea of corpses and blood.

Short-Term Outlook: Gold Slumps After Breaking Key Support📉 Short-Term Trend Analysis – XAU/USD
- Gold (XAU/USD) is under heavy selling pressure after decisively breaking below the key support level at $3,200, marking a significant shift in short-term momentum.
- The $3,176 zone, which marks the April 11 low, now serves as a crucial technical support. A clear break below this level could open the door for a deeper drop toward the next key support around $3,140.
If the $3,176 level fails to hold and bearish momentum continues, the market is likely to push lower toward the $3,140 support zone.
📰 Fundamental Drivers Behind the Decline
No major news has been released today, but the market continues to be weighed down by:
- Ongoing U.S.-China trade tensions, which remain unresolved.
- U.S. CPI data for April came in weaker than expected, causing investors to adjust interest rate expectations and favoring short-term downside for gold.
🔮 Short-Term Technical Scenario
After breaching the $3,200 support level, gold is expected to consolidate briefly in the $3,176–$3,190 range before potentially resuming its downtrend.
💡 Short-Term XAU/USD Trade Setups
🔻 SELL
Entry Zone: 3193 – 3190
Take Profit: 3188 – 3185
Stop Loss: 3198
🔺 BUY
Entry Zone: 3179 – 3176
Take Profit: 3184 – 3181
Stop Loss: 3171
📌 Note:
In the current market environment, short-term strategies are preferred.
Apply strict risk management as volatility may increase due to geopolitical headlines or technical retracements.
Closely monitor price action around $3,176 — a confirmed break below this level could accelerate the move toward $3,140.

Gold's consolidation is over and bears will break 3200!Gold market analysis:
Short-term gold has entered a repair period. The previous tariff negotiations led to a sharp drop in gold. It has now fallen to around 3200 and is stuck. The shape and indicators show that 3200 is a super support. This position is greatly beneficial for selling on the weekly and daily lines. Yesterday, the daily cross star, the overall trend is still empty, the short-term repair range is 3265-3220. If you want to grasp the trend trading, sell at a high price and arrange the selling order. Lao Gu believes that the possibility of continuing to fall after the shock is over is greater, and it will break 3200 later. The daily moving average indicator is also broken. The gold fluctuation rhythm is very large, that is, a technical rebound and repair are basically dozens of points. It is most important for us to grasp the rhythm in operation. Today's idea can rely on the upper edge pressure of the shock to sell.
If the Asian session rebounds around 3256 first, consider selling it first. There are opportunities for buying and selling in the volatile market. What we need is patience and waiting. In addition, the daily moving average begins to rush down, and selling begins to move. If it breaks 3200, we will consider selling. We must learn to follow the recent market. We rarely follow it before, because the recent gold will not turn back when it falls or rises, and the speed of buying and selling is also very fast. It is very important to control the rhythm.
Support 3220, 3207, strong support 3200, pressure 3244, 3256, 3265, the watershed of strength and weakness of the market is 3230.
Operation suggestion
Gold-----short around 3256, target 3150-3200

XAU/USD(20250514) Today's AnalysisTechnical analysis:
Today's buying and selling boundaries:
3243
Support and resistance levels:
3292
3274
3262
3224
3212
3194
Trading strategy:
If the price breaks through 3262, consider buying, the first target price is 3274
If the price breaks through 3243, consider selling, the first target price is 3224

XAUUSD | UNPRESIDENTED GOLD RALLY : Where to Next?GOLD has been trading extremely bullish over the past year, with high volume indicating lots of interest and movement in this commodity's market:
Is this where we should be getting worried?
Rapid surges in gold prices have historically been followed by sharp corrections as markets adjust. Three key examples illustrate this;
🧨 the 1980 spike to $850 due to global instability, followed by a 65% drop;
🧨 the 2011 peak near $1,900 driven by economic anxieties, leading to a 40% decline by 2015;
🧨and the 2020 high above $2,075 amid pandemic fears and stimulus, which subsequently settled into a lower range.
Noticing how gold has been trading in a parabolic curve, first corrections are likely to be down the curve (as it has been, historically):
Across past gold peaks ( 1980, 2011, and 2020) and recent record highs, markets share four core similarities:
🎈elevated inflationary expectations,
🎈low or negative real interest‐rate environments,
🎈heightened geopolitical and trade‐war tensions,
🎈aggressive central‐bank and ETF buying.
Today’s gold rally mirrors these patterns, driven by persistent inflation concerns and renewed safe‑haven demand amid Middle East conflicts and Ukraine risk. Aggressive central‑bank and ETF purchases have also replicated past behavior. Emerging‑market central banks have accelerated gold reserves diversification since 2022, just as they did after the 2008 crisis and the Euro‑debt peak in 2011.
Historically, swift peaks have been followed by multi‑year corrections as external conditions normalize. After January 1980’s peak, gold fell by two‑thirds over two years; following 2011’s high, it dropped 40% by 2013. If inflation cools or central banks signal genuine rate normalization, this rally may likewise give way to a sustained consolidation or correction.
Did the BBC just signal the peak??
Recently the BBC warned that while current trade‑war and market volatility parallels past booms, overreliance on gold alone risks miss-timing the eventual downturn when macro fears realize.
Therefore, if the curve breaks, it's likely the beginning of the hard correction.
__________________________
OANDA:XAUUSD

Gold May Drop Further Below the $3,200 Level in the Short TermGold (XAU/USD) faces the risk of a deeper decline if the following factors continue to develop unfavorably for the precious metal:
📌 1. Continued Improvement in US-China Relations
• The joint statement between the US and China has eased trade tensions.
• If both sides announce more concrete agreements or actions (such as tariff reductions or market access), safe-haven demand may weaken significantly, leading to gold sell-offs.
📌 2. Sustained Strength in the US Dollar
• The USD is strengthening on expectations that the Fed will maintain higher interest rates for longer.
• Capital continues to flow into the USD rather than gold, especially as US bond yields rise.
📌 3. Lack of Supportive News for Gold
• Geopolitical risk factors have temporarily subsided.
• Inflationary pressure is no longer strong enough to support gold prices as before.
📉 Key Support Levels Ahead
If gold breaks below the $3,200 level, the next potential support zones include:
• $3,185 – a recent short-term low (if applicable)
• $3,160 – $3,170 – a technical support confluence zone
• $3,140 – a strong psychological support level, and a potential target if a sell-off intensifies
⚠️ Recommendation
• If gold decisively breaks below $3,200 with rising volume and continued positive developments in US-China trade, the downtrend could accelerate.
• Traders should monitor the $3,195–$3,200 range closely to assess whether to expand short positions.

Gold Sees Technical Rebound, But Downtrend Remains IntactGold has seen a modest rebound from its lowest level in over a week, driven by dip-buying interest. However, the overall downtrend remains intact as risk appetite increases across markets, following a temporary trade and tariff agreement between the U.S. and China. This progress has reduced demand for gold as a safe-haven asset.
In addition, if the U.S. continues to release more positive updates on bilateral trade relations, downward pressure on gold is likely to persist — especially amid a stronger U.S. Dollar. As such, current rebounds are likely to be technical in nature, and investors should exercise caution with long positions.
🔮 Expected Short-Term Scenario
Gold (XAU/USD) may continue a technical recovery around the $3,275–$3,280 zone due to bottom-fishing activity. However, without a clear breakout, the broader trend remains bearish, driven by:
• Increasing risk-on sentiment
• Continued USD strength
🧭 Suggested Trading Strategy
• Short-term Sell in the zone: $3,275 – $3,280
• Short-term Buy in the zone: $3,205 – $3,210
• Always use tight stop-losses to mitigate risk from news-driven volatility.
💡 Short-Term Trade Setup
🔻 SELL XAU/USD at: $3,275 – $3,280
• 🎯 TP1: $3,265
• 🎯 TP2: $3,255
• 🚨 SL: $3,300
🔺 BUY XAU/USD at: $3,205 – $3,210
• 🎯 TP1: $3,215
• 🎯 TP2: $3,225
• 🚨 SL: $3,195
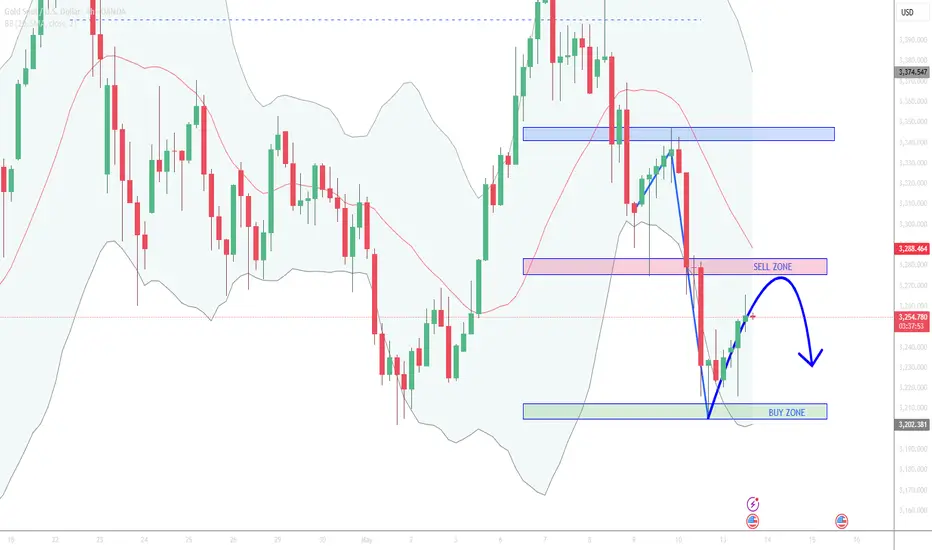
Gold 3200 Life and Death Battle!Gold stabilized after touching the support of the 3193-3202 rising trend line. Although the US market rebounded, it did not form an effective breakthrough. In the short term, it is still dominated by shorts.
Short-term strategy:
Before 3200 is broken, you can go long on dips. If it falls below, stop the loss decisively, and use a small stop loss to game the potential bull reversal. Whether the 3250 pressure is broken or not determines the short-term direction

XAUUSD Price Outlook – Bearish Setup in Play ??Asset Overview
The chart represents a price action analysis with support and resistance zones, along with EMA indicators (50 and 200), likely on a 4H or 1H timeframe.
Key Technical Levels
Resistance Zone: ~3,400 to 3,450
First Support Zone: ~3,230 to 3,250
Second Support Zone: ~3,090 to 3,130
Indicators
EMA 50 (Red): Currently around 3,340, acting as dynamic resistance.
EMA 200 (Blue): Positioned near 3,232, reinforcing the first support zone.
Price Action Insight
Price had a strong uptrend, peaking above 3,440 before pulling back.
A lower high may be forming, suggesting possible trend exhaustion.
The current bounce appears to be a retracement back toward resistance or EMA 50.
Projected Move (As Illustrated on Chart)
Short-term bullish move into the resistance zone (~3,400–3,450).
Failure to break above resistance leads to sharp rejection.
Price retraces to first support zone (aligned with EMA 200).
If support fails, deeper drop expected toward the lower support zone (~3,100).
Strategic Notes
📉 Bearish Bias if price fails to break above resistance.
🔍 Watch for bearish candlestick patterns or divergences near resistance.
🛡️ First support aligns with EMA 200, making it a critical level for bulls to defend.
🔻 Breakdown below 3,230 opens room for larger correction to 3,100–3,090.
Conclusion
Currently, the chart suggests a potential short opportunity if price confirms rejection at resistance. The EMA cross structure remains bullish long-term, but momentum is weakening, and failure to reclaim highs could shift sentiment bearish in the short to mid-term.

Gold is trading sideways, can the bearish trend continue?🗞News side:
1. China-US trade relations eased, suspending some tariffs and countermeasures
2. Russia and Ukraine suspended firing for 30 days, and the India-Pakistan conflict was temporarily mediated
📈Technical aspects:
The trading strategy given today, if brothers have reference and follow the trading strategy to participate in long orders, I think you should all have good gains on hand. At present, gold is in consolidation, the 4H moving average is in a short position, and the MACD dead cross continues to increase, so the short-term short momentum still exists. From a technical point of view, in the downward trend from last week's high of 3347 to the current low of 3207, 3260 is at a key position. Therefore, we pay attention to the possibility of gold rebounding to 3260 in the evening.
If you agree with this view, or have a better idea, please leave a message in the comment area. I look forward to hearing different voices.
OANDA:XAUUSD FX:XAUUSD TVC:GOLD FXOPEN:XAUUSD FOREXCOM:XAUUSD

Gold’s 3200 mark is the key!Due to the ceasefire between India and Pakistan and the easing of the Sino-US trade war, gold opened directly and fell below 3280 and 3260 successively, so the decline of gold will continue.
From the gold hourly chart, the focus below is on the 3200 integer mark. If it falls below 3200 and cannot effectively stabilize, then gold will have a big double top here, and the next decline will extend to around the 3000 integer mark. On the contrary, if the 3200 mark is not broken, then the bulls will fight back, at least they will fill the gap again
So in terms of operation, it is not recommended to chase the short now. If you want to go long on gold, you can wait for it to fall back to the 3200-3210 area and stabilize before buying

Focus on shorting opportunities near 3250 in the US market
📌 Gold drivers
After two days of trade talks in Switzerland, the United States and China announced "substantial progress", marking a possible turning point in efforts to ease tensions between the world's two largest economies. Chinese Vice Premier He Lifeng called the talks an "important first step" toward stabilizing bilateral trade, and U.S. Treasury Secretary Scott Bessant expressed the same view, noting that the talks had made meaningful progress. The United States is expected to release more details on the results of the negotiations on Monday.
As the United States and China announced an agreement to cut reciprocal tariffs, the dollar strengthened, weakening the appeal of gold as a safe-haven asset. Spot gold fell 3% on Monday to a low of more than a week, hitting a low of $3,208 during the day, the lowest level since May 1, and the day's decline had reached $100. At the same time, the U.S. dollar index rose by more than 1%, making gold more expensive for holders of other currencies.
📊Comment Analysis
Gold still has room to go down, and the strength of gold bears is still there. Gold rebounded twice in the US market and fell back under pressure near 3250.
💰Strategy Package
At present, the US market still has a demand for a pullback, and the long position near 3220 can now be closed for profit. For the US market, we should first look at the area around 3250. After the pullback is in place, continue to play short orders to look at the target position of 3200. If it breaks upward, find a new point layout. This week's data market and news will have a further impact on gold. For real-time layout of accurate trading signals, please follow the free channel.
⭐️ Note: Labaron hopes that traders can properly manage their funds
- Choose the number of lots that matches your funds
- Profit is 4-7% of the fund account
- Stop loss is 1-3% of the fund account

(XAU/USD) Bearish Trade Setup – Targeting $3,222 with 1:6 Risk/REntry Point: Around 3,409.33 - 3,408.41 USD.
Stop Loss: 3,437.87 USD.
Target (Take Profit): 3,222.53 USD.
Risk/Reward Ratio: Approximately 1:6, which is favorable.
📉 Price Action & Trend Analysis:
A rising wedge (or channel) appears to have formed and broken to the downside — a bearish signal.
The current price at 3,341.47 has broken below a minor support zone (highlighted in purple), indicating bearish momentum.
Price is now approaching the 200 EMA, which is acting as potential dynamic support.
📌 Key Levels Highlighted:
Support Zones: Near 3,347.47 (previous minor support) and 3,222.53 (main target zone).
Resistance Zones: At the entry level and above, near 3,437.87 (Stop Loss zone).
🔄 Indicators:
Moving Averages (Red and Blue Lines): Shorter-term moving average (red) is below the longer-term (blue), indicating downward pressure.
Momentum Shift: The sharp drop suggests a likely continuation of the bearish trend.

How to layout gold as Sino-US trade eases🗞News side:
1. China-US trade relations eased, suspending some tariffs and countermeasures
2. Russia and Ukraine suspended firing for 30 days, and the India-Pakistan conflict was temporarily mediated
📈Technical aspects:
Affected by the easing of Sino-US economic and trade relations, coupled with the fact that the Russian-Ukrainian negotiations are on the right track and India and Pakistan have suspended firing, the risk aversion sentiment in the gold market has eased, and the gold price has fallen sharply since the opening today. At present, the 3200 line has formed an important short-term support. If the support effect is strong at this point, the gold price may rebound further; if it falls below this key support, it will accelerate the opening of downward space. The upper 3250-3260 is the previous intensive trading area, which will pose a certain pressure in the short term. At the top of the European market, focus on the resistance range of 3250-3260, and at the bottom, the support range is 3210-3200.
🎁BUY 3200-3210
🎁TP 3250-3260
🎁 SELL 3260-3270
🎁 TP 3250-3230
If you agree with this view, or have a better idea, please leave a message in the comment area. I look forward to hearing different voices.
FOREXCOM:XAUUSD FXOPEN:XAUUSD TVC:GOLD FX:XAUUSD OANDA:XAUUSD

The golden earthquake storm is coming!In terms of news: Major events over the weekend include the conflict between Russia and Ukraine, the sudden change in the situation between India and Pakistan, and the progress of Sino-US negotiations: Although India and Pakistan announced a truce, India's surprise attack turned the agreement into a joke. The high-level economic and trade talks between China and the United States are still continuing in Geneva, and it is difficult to have clear results in the short term. The war between Russia and Ukraine is still in a stalemate. The superposition of multiple events has injected uncertainty into the market.
Technical aspects:
Pay attention to the pressure in the 3360-3380 area. If it stands firm at 3346, it can fall back to arrange long orders. If it directly breaks below 3300 at the opening, pay attention to the support near 3280 - this position is likely to be lost, and effective support depends on the downward pattern formed after the 3260 break, and the ultimate target is 3200.
