Profit again, follow-up operation strategyBrothers, as I mentioned in my last opinion, gold is facing support below 3030-3020, so I still prefer to go long on gold in terms of trading. Today, we went long on gold near 3023 according to the strategy of short first and long later. Just when gold rose to around 3038, I manually closed my long position and easily made a profit of 140 pips again.
Today, Friday, gold hit the highest level of 3047 in the morning and started to fluctuate and fall. As of now, gold has hit the lowest level near 3021 and started to rebound. The 3025-15 line below is also the support position we have been talking about. Here we can find opportunities to intervene in long orders. We must be cautious in operation on Friday. All profits have been made this week. Since the announcement of the US interest rate decision, gold has been running all the way and has set a new record high again. Again, don’t chase gold at high levels, look for opportunities to go long when it falls back, and the operation is mainly to go long when it falls back. If your current gold operation is not ideal, I hope I can help you avoid detours in your investment. Welcome to communicate with us!
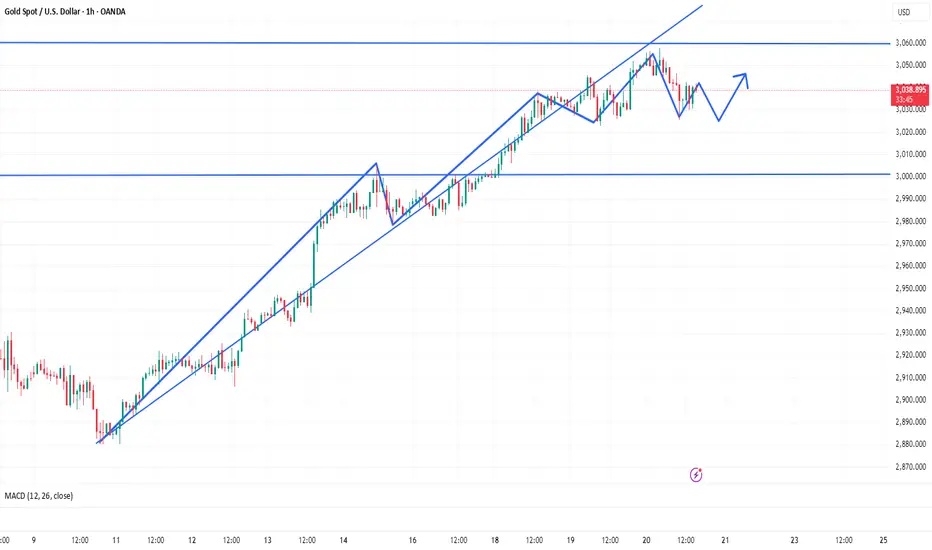
From the 4-hour analysis, the short-term support of 3025-3015 is concerned, and the important support of 3000-05 is focused on. If it does not break, it will continue to be bullish. The upper target is to pay attention to the upper pressure. Before the daily level does not fall below the lower support, the main long rhythm will remain unchanged. I will inform you of the specific operation strategy in time, so please pay attention to it in time. Gold operation strategy: Gold will go long after stepping back on the 3025-3015 first line.
Goldsell

The Bear Awakens: A Perfectly Executed Short on Gold📍Over the past few days, I’ve consistently emphasized that the bear is on the verge of fully awakening, warmly inviting everyone to watch it dance. Today, gold has indeed pulled back to the 3000 level as anticipated, making our short position from the 3035-3045 range a resounding success!
📍Since gold has tested the 3000 level for the first time, a second test is highly likely. Therefore, the primary trading strategy remains focused on selling gold on rebounds. The head-and-shoulders formation continues to exert significant pressure, making a sustained breakout to the upside unlikely in the near term.
📍With this in mind, the resistance zone can be adjusted lower to 3025-3035. If gold fails to break through this region during its rebound, further downside movement is expected. In that case, gold will likely retest the 3000 level and could potentially breach it, extending losses towards the 2995-2985 range.
🔎Trade Idea:
Xauusd: Sell at 3025-3035
TP:3005-2995
SL:Adjust according to risk tolerance.
📩Trading means that everything has results and everything has feedback. I have been committed to market trading and trading strategy sharing, striving to improve the winning rate of trading and maximize profits. If you want to copy trading signals to make a profit, or master independent trading skills and thinking, you can follow the channel at the bottom of the article to copy trading strategies and signals

The bearish trend will continue📍Since the day before yesterday, I've been sincerely inviting everyone to watch the bear dance.Gold has decisively broken below the recent support zone at 3030-3026 and extended its decline to around 3021. Based on this price action, two key conclusions can be drawn:
1. 3057 is now confirmed as the current high.
2. Gold has successfully formed a head and shoulders pattern in the short term.
📍This indicates that bearish momentum remains strong and far from exhausted. Under the pressure of structural resistance, gold is likely to continue testing lower support levels around 3010-3000, with a possible extension toward 2995.
🔎Trade Idea:
Xauusd: Sell at 3035-3045
TP:3015-3005
SL:Adjust according to risk tolerance.
📩Trading means that everything has results and everything has feedback. I have been committed to market trading and trading strategy sharing, striving to improve the winning rate of trading and maximize profits. If you want to copy trading signals to make a profit, or master independent trading skills and thinking, you can follow the channel at the bottom of the article to copy trading strategies and signals

XAU/USD M30 Trade IdeaIf price break 3026 and restest this area, it is a good posibility to take a sell with TP in the TP Area and SL above 3031.

GOLDHello friends
We have created a good pattern, let's see if the price will work or not.
What do you think?
*Trade safely with us*

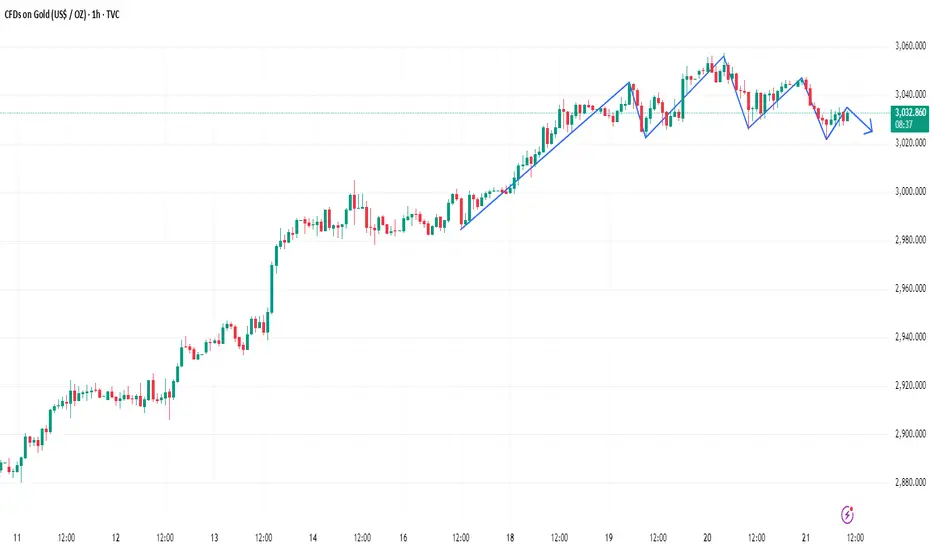
Can gold be shorted directly?The 1-hour moving average of gold has begun to turn slightly downward, and the strength of gold bulls has been suppressed. The 1-hour gold has now formed a head and shoulders pattern. If the strength of gold's rebound is limited, then the room for further decline of gold will increase.
Trading idea: short gold around 3032, stop loss 3042, target 3022
Gold's pullback is the last chance to get on boardAccording to our previous operation strategy of short first and long later, the short position has perfectly reached our target area, and the position was closed in time to lock in the profit. Next, we will go long after the rebound and continue to look forward to the performance of the gold market.
The Bollinger Bands in the H4 chart are closing, and the golden cross of the 13-day moving average and the 21-day moving average is slowing down, suggesting that the short-term long and short competition is fierce. Focus on the strong resistance in the 3050-3055 range on the upper side during the day, and the probability of breaking through is low. The support below is at 3022-3015, forming a double insurance. The small cycle now also has the performance of high-level fluctuations, but it still lacks some certainty. For example, the Bollinger Bands in the H4 cycle are closing. Today's rise is not optimistic about setting a new high again. The upper high point is suppressed to around 3050, and the downward movement must break the Bollinger middle rail support, and the space below can see 3000. Therefore, today we should not only remind everyone to wait patiently for the decline to go long, but also remind everyone to try to go short at the high of 3050, and then look at today's adjustment space, as well as the support points and key points below. Again, gold maintains a bullish trend for the time being.
Gold's retracement to 3020-3030 is the last chance to get on board. You will regret it if you miss it. Gold operation suggestion: Buy more near 3020-3030, target: 3050
Brothers, you must keep up with the rhythm. If you are interested, you can follow me. Communicate real-time market conditions, follow up on real-time orders, read bottom signals, interpret daily market conditions, share real-time strategies, and don't blindly follow the trend.

XAUUSD H1 : Drop is coming!"By analyzing the one-hour structure of gold, I think the price will touch the FVG H1 at $3040 and then start dropping, sweeping the liquidity of the lows."

MCX Gold intraday trend forecast for March 21, 2025I have a bearish outlook for the day. The first phase is bearish and then a pull back is likely to take place. This is my mathematically derived outcome. Use your technical analysis and trade with Stop-Loss.

GOLD (XAU/USD) H1 Trading Plan📉 GOLD (XAU/USD) H1 Trading Plan 📉
🔹 Wait for Sell-Side Liquidity Break! 🏦💧
Gold is currently testing key liquidity zones. Before entering a trade, we must wait for a sell-side liquidity grab (sweep of lows). Once liquidity is taken, shift to a lower time frame (M5/M15) for confirmation before executing a position.
✅ Trading Steps:
1️⃣ Identify sell-side liquidity zones (equal lows, swing lows).
2️⃣ Wait for a break below liquidity to confirm stop-hunt.
3️⃣ Look for bullish confirmation on LTF (Break of Structure, order block, or engulfing candle).
4️⃣ Enter with tight stop-loss & proper risk management.

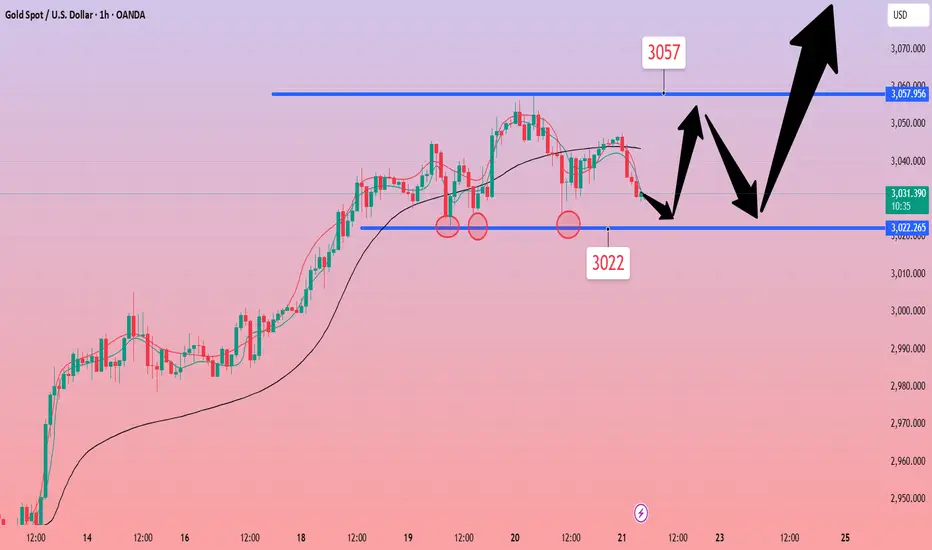
Gold------Buy around 3022, target 3060-3090Gold market analysis:
Recently, the market is dominated by bulls. The daily line has been setting new highs. However, after setting a new high of two points yesterday, the bulls did not continue. Today, we need to adjust our thinking in the short term. The bullish daily line cross star means that the short term needs to be oscillated and repaired. There is no market that has been rising all the time. Repair is inevitable. Is 3057 a big top? I can tell you very confidently that it is not. The current daily and weekly lines are both bullish. If there is no big waterfall on Black Friday today, the weekly line will still close with a big positive. Then gold will continue to hit a new high next week. The general direction of the unilateral rise can be followed.
Today, the gold bulls should not chase so aggressively, and they should adjust and wait patiently for the big position before considering it. In the Asian session, we pay attention to two position supports. One is 3020-3022, which is the recent entry direction. If this position is broken, the short-term will turn to short. Today's thinking also needs to be adjusted. After working for a week, it may be sold at the end of Friday today. The hourly support is around 3030. This position is supported by the pattern and 1-hour indicator. Buy before it is broken.
Support 3030, strong support 3020-322, pressure 3047, strong pressure 3057, the strength and weakness dividing line of the market is 3040.
Operation suggestion:
Gold------Buy around 3022, target 3060-3090
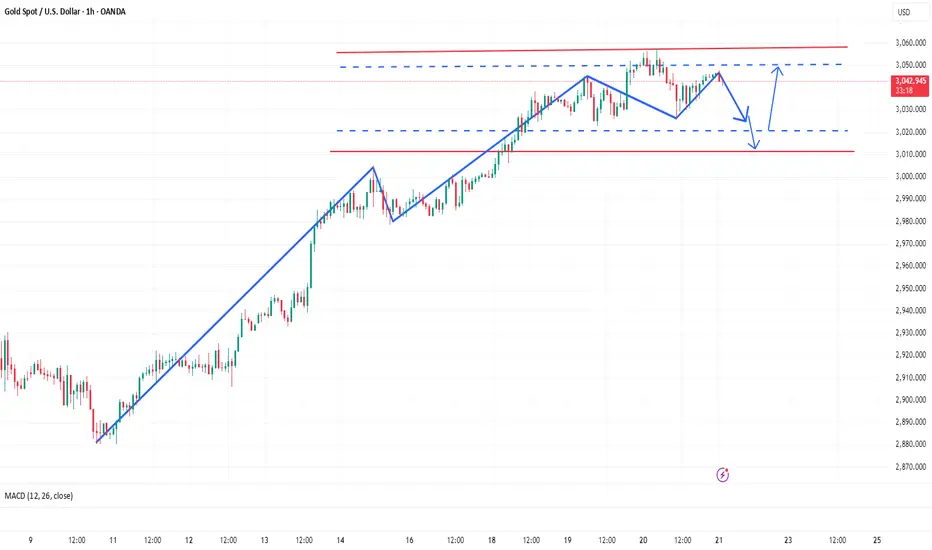
Gold has short-term callback demandGold hit a high of 3057 and then fell back. The daily line closed with a negative cross star, and a correction is needed in the short term. The daily resistance is near 3050. It touched 3047 in early trading and fell back. If the market falls below 3042, continue to look at 3030-3025. The operation is the same as what I said in my previous post. First short and then long. In addition to the low point, the support below is 3020. The strong support is around 3011. You can go long if it is touched.
Operation suggestion: short at 3050-3040 above, and go long at yesterday's low or 3025-3015 below. It is still in line with expectations.
Friends must keep up with the rhythm. If you are interested, you can follow me. Welcome to experience, exchange real-time market conditions, follow real-time orders, read bottom signals, interpret daily market prices, share real-time strategies, and do not blindly follow the trend.
Gold 40-45 short, longs temporarily stopGold, after touching the 57 line, began to retrace and correct. Before the US session, it touched the lowest level near 25 and then stopped. However, the US session rebounded slightly, forming an interval shock, but did not form a second breakthrough. The high break is also likely to be the high point in the short term. After all, the European and US sessions are relatively weak, so the bulls in the short term may need to reorganize their energy and achieve a digestion correction effect. The support below is still maintained at the low point of 20 that has been generated many times in the recent period. This position is also likely to be the watershed line of the long and short positions in the recent period. Once this position continues to break down, it is likely to continue to form a retracement in the later period. The upper suppression port maintains the head and shoulders top pattern of 45 formed in the short term. The daily moving average system will continue to maintain an upward situation, but the retracement may also temporarily bring the bulls to an end. We will still operate around the short-term short position. If gold rebounds to short near 40-45 during the day, the target will be around 30-20. Friends must keep up with the rhythm. Control positions, and the specific points are mainly based on real-time intraday trading. If you are interested, you can follow us. Welcome to experience, exchange real-time market conditions, and pay attention to real-time orders. You can read bottom signals, interpret daily market conditions, and share real-time strategies. Don't blindly follow the trend.

Gold hovers at a key position, clever layoutGold fell from a high of 1 hour. If gold continues to fall, then if gold rebounds and does not break the new high, then gold may show the embryonic form of a head and shoulders top in 1 hour. Again, gold fell from a high, and now it is at a high level. Don't chase more easily. After the news, the gold bulls' volume has been digested, and the gold bulls need to regain support. Gold rebounded under pressure at the high point of 3045 in the US market, and continued to go short at highs. The market is changing rapidly, and gold has entered an overbought state, so gold needs to be cautious in chasing more. On the whole, today's short-term operation of gold is recommended to be short-selling on rebounds, supplemented by long-selling on callbacks. The short-term focus on the upper resistance of 3050-3060, and the short-term focus on the lower support of 3025-3010, friends must keep up with the rhythm. To control the position, the specific points are mainly based on the real-time intraday. If you are interested, please follow us. Welcome to experience, exchange real-time market conditions, and pay attention to real-time orders.
You can read bottom signals, interpret daily market trends, and share real-time strategies. Don't follow the trend blindly.
GOLD TRADING POINT UPDATE > READ THE CHAPTIAN Buddy'S dear friend
SMC Trading Signals Update 🗾🗺️ Gold Traders SMC-Trading Point update you on New technical analysis setup for Gold 🪙 list time post signals 💯 reached target point 3059. ). Analysis update on gold. Gold look 👀 patterns chart 📉 sellers recover and strong 💪. 30M time frame 🖼️ looking short trend 📉 target 🎯 point 3001 that entry buying said good luck 💯
Key Resistance level 3042 + 3046
Key Support level 3006 - 3001
Mr SMC Trading point
Palee support boost 🚀 analysis follow)

Gold/USD (XAU/USD)– Potential Bearish CorrectionKey Observations:
Uptrend & Resistance:
The price has been trending upwards within a parallel channel.
It reached a resistance level around $3,064 - $3,055, where selling pressure is evident.
Potential Pullback:
The price is showing signs of rejection at resistance and could move lower.
The first target for the pullback is around $3,013 - $2,964, which aligns with previous structure levels.
A deeper correction could test support near $2,880 - $2,878.
Trade Setup Idea:
Bearish scenario: If price fails to reclaim resistance, traders may look for short opportunities targeting lower support levels.
Bullish scenario: If price breaks above resistance, it could trigger further upside momentum.
Conclusion:
This chart suggests a possible short-term correction before determining the next move. Traders should watch price action near key levels for confirmation.

First empty then more to grasp the rhythmThe gold market is ever-changing. So far, the gold price has not fallen back to our pre-set long area as expected. At the same time, the resistance in the 3050-3060 area above is strong, and the price has failed to break through many times, showing the effectiveness and suppression of the resistance level.
Based on the current market, we adjusted our strategy to sell high and buy low, and adopted the operation idea of shorting first and then longing. It is recommended to arrange short orders in the 3040-3050 area, and pay close attention to the price trend after entering the market. Once the price falls back to the expected support range, do not hesitate to take profits in time, and go long in reverse, seize the subsequent possible rebound, flexibly respond to market changes, and lock in profits. If you want to accurately grasp opportunities and get signals, you can follow me.
You can read bottom signals, interpret daily market trends, and share real-time strategies. Don't follow the trend blindly.
Watch as the bears are about to dance!📍Bros, we must pay attention to the 3040-3050 area next. If gold cannot break through this area during the rebound, then the technical level may build a head and shoulders top structure, further stimulating the decline of gold. The market bullish factors for gold have all appeared. If there is no extra force to support the rise of gold, then the bears will fully wake up and may even go down to the 3020-3010 area.
📌So in terms of short-term trading, we can try to short gold in the 3040-3050 area.
🔎Xauusd:@3040-3050 Sell
📩Trading means that everything has results and everything has feedback. I have been committed to market trading and trading strategy sharing, striving to improve the winning rate of trading and maximize profits. If you want to copy trading signals to make a profit, or master independent trading skills and thinking, you can follow the channel at the bottom of the article to copy trading strategies and signals

Make your decision now! Go long on goldAt present, the CSI 3000-3005 area on the daily level constitutes a strong support zone, and the 4-hour chart 3020-3025 is the short-term long-short watershed. If the 3025 line is not effectively broken, it can be regarded as a signal of longs accumulating power, and the intraday rebound target is the 3080-3100 pressure range. It is necessary to pay attention to the change in volume. If the volume continues to shrink, it is necessary to be vigilant about the second test of the 3000-point integer mark. The operation strategy is mainly to go long on the retracement, and to arrange long orders on dips below 3020-3030, and maintain a volatile bullish pattern in the short term.
You can read bottom signals, interpret daily market trends, and share real-time strategies. Don't follow the trend blindly.

Gold fluctuates, focus on 3040 pressure levelGold is still fluctuating at a high level. Pay attention to the pressure near 3040, stop loss around 3047, and take profit around 3020. Be careful of risks.

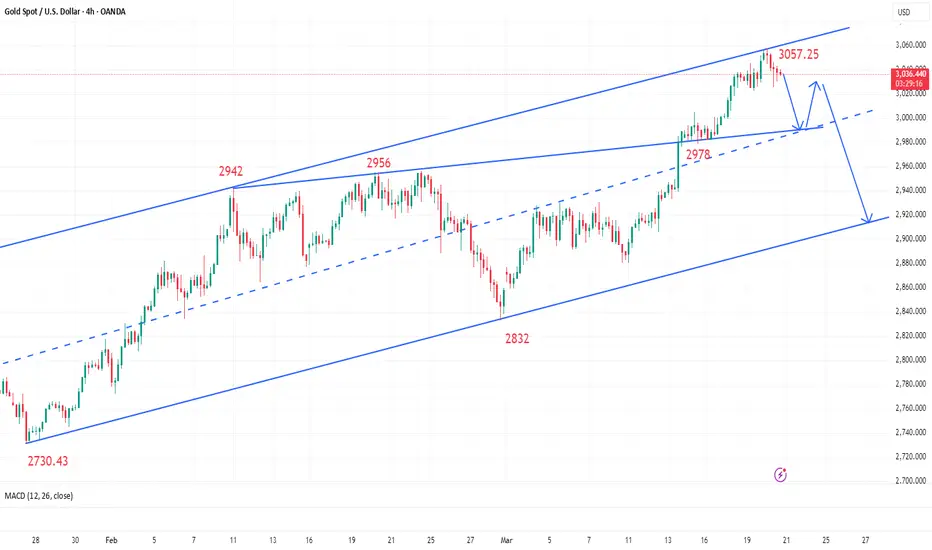
Gold (XAU/USD) Pullback – Key Support Levels to Watch"📈 Chart Pattern:
Gold has been trading inside an ascending channel, showing a strong uptrend. However, the price has started to decline from resistance, signaling a potential correction.
🔹 Key Levels:
Current Price: $3,036.77
Support Target: $2,980.48 - $2,978.25 (First key support level)
Stronger Support: $2,829.63 (Major trendline support)
📊 Trading Plan:
Short-term traders may look for a sell setup toward $2,980 if the price continues its pullback.
Buyers should wait for support confirmation before entering long trades.
If price breaks below $2,980, the next support to watch is around $2,829.63.
⚠️ Risk Management:
A return above $3,050 could invalidate the bearish pullback scenario.
If the price bounces from support, buyers could target new highs.
💡 Conclusion:
Gold is currently experiencing a pullback after a strong uptrend. Watch key support zones for potential trade opportunities. 📉📊

Gold operation strategyGold quickly rose in the morning today, so we remind gold to pay attention to the adjustment of stepping back, and don't chase high. Gold hit the highest point of 3057 near stagnation, and started the road of falling back and adjustment. We also gave a short position near 3045-3050, and the target was 3030-3020 to stop profit. The hourly line of gold fell back from the high position. Now our long order entry target near 3025-20 is 3035-40. The hourly line of gold may show the embryonic form of a head and shoulders top. Again, don't chase gold at high levels, look for opportunities to go long after stepping back, and the operation is mainly to go long after stepping back. If your current gold operation is not ideal, I hope I can help you avoid detours in your investment. Welcome to communicate with us!
From the 4-hour analysis, pay attention to the short-term support of 3020-3025 below, and focus on the important support of 3000-05. If it does not break after stepping back, continue to be bullish. Pay attention to the upper pressure of the upper target. Before the daily level falls below the support below, the main long rhythm of the trend remains unchanged. I will remind you of the specific operation strategy, and pay attention to it in time.
Gold operation strategy: Gold falls back to 3020-3025, and the target is 3035-3040.

Gold - Expecting Retraces and Further Continuation LowerH1 - Bearish divergence on the moving averages of the MACD indicator.
Followed by bearish trend pattern in the form of three lower highs, lower lows structure
Strong bearish momentum
Potential drop after retraces if the strong resistance zone will not be broken.
If you enjoy this idea, don’t forget to LIKE 👍, FOLLOW ✅, SHARE 🙌, and COMMENT ✍! Drop your thoughts and charts below to keep the discussion going. Your support helps keep this content free and reach more people! 🚀
----------------------------------------------------------------------------------------------------------------------
Disclosure: I am part of Trade Nation's Influencer program and receive a monthly fee for using their TradingView charts in my analysis.
