XAUUSD Rises Steadily After RetestXAUUSD Rises Steadily After Retest – Buy Zone Showing Strong Effectiveness
Technical Analysis – July 11, 2025 (H4 Timeframe)
Gold (XAUUSD) is currently trading around $3,345, continuing its steady upward move from the key confluence support at $3,309–$3,318. The bullish momentum has strengthened following a clean break and successful retest of the previous bearish structure.
1. Updated Technical Data:
Current Price: $3,345.10
Fibonacci Retracement:
0.618 at $3,309.69
0.5 at $3,318.91
Recent Swing High (1.0 Fibo): $3,345.69
RSI (H4 Estimate): Around 62 – nearing overbought territory, but still has room for further upside
EMA20/EMA50: EMA20 has crossed above EMA50 – short-term trend is bullish
Next Resistance: $3,357.97 (previous swing high)
Immediate Support: $3,318–$3,309 (Fibonacci confluence zone)
2. Price Action Insight:
Following the correction low at $3,287.02, gold has shown strong recovery with a clear impulsive wave formation. The previous Buy Zone between $3,309–$3,318 has proved highly effective, leading to the current bullish breakout.
A classic “break–retest–continuation” pattern is forming on the H4 chart, suggesting that bulls remain in control unless disrupted by macro events.
3. Suggested Trading Strategies:
Primary Scenario: Buy on Dip
Entry Zone (on retest): $3,330 – $3,318
Stop Loss: Below $3,308
Take Profit 1: $3,345 (already reached)
Take Profit 2: $3,357
Extended Target: $3,368 – $3,372 if $3,357 breaks decisively
Alternative Scenario: Short from $3,357 if Reversal Signal Appears
Stop Loss: Above $3,362
Take Profit: Toward $3,330 – $3,318 support
4. Conclusion for Today:
Short-Term Trend: Bullish
Medium-Term Outlook: Neutral to bullish – watch $3,357 breakout for confirmation
Main Bias: Buy the dip and hold toward resistance at $3,357–$3,372
Follow for more real-time trading strategies and insights. Save this post if you find it helpful!
Goldsell

Gold in Equilibrium, Possible Minor Pullback📊 Market Overview:
• Spot gold currently trades around 3,332–3,333 USD/oz
• A slightly weaker US dollar and declining Treasury yields are supporting gold
• Yet strong US jobs data and delayed Fed rate cuts are limiting gold’s upside
• Escalating trade tensions and new tariffs keep safe-haven demand intact
📉 Technical Analysis:
• Resistance: 3,345–3,350 USD, repeatedly tested zone
• Support: 3,316–3,322 USD, strong bottom near 3,310 USD
• EMA 9: Price hovering around it—no clear trend direction
• Momentum/RSI: RSI fading from overbought, momentum weakening
• Candle Patterns/Volume: Narrow consolidation, forming pennant structure
📌 Outlook:
Gold is likely to remain range-bound or dip slightly if USD strengthens. Conversely, renewed economic headwinds or Fed dovishness could push gold higher, especially on a break above 3,345 USD.
💡 Suggested Trade Strategy:
SELL XAU/USD : 3.347–3.350
🎯 TP: 40/80/200 pips
❌ SL: 3.355
BUY XAU/USD : 3.316–3.319
🎯 TP: 40/80/200 pips
❌ SL: 3.310

Gold fluctuates, consolidation in the 3330-3310 range📰 News information:
1. Waller meeting on interest rate cuts
2. Trump tariff issues
📈 Technical Analysis:
Waller will participate in the meeting in more than two hours and pay attention to whether there is any news of interest rate cut. The key is to operate around the 3330-3310 range. Continue to pay attention to the support of 3310-3305 at night. If gold falls below 3310,-3305 again, the downward trend will continue, and it is expected to touch 3280 again, or even 3250. If it rebounds above 3330, it is likely to continue to rise.
In addition to investment, life also includes poetry, distant places, and Allen. Facing the market is actually facing yourself, correcting your shortcomings, facing your mistakes, and exercising strict self-discipline. I share free trading strategies and analysis ideas every day for reference by brothers. I hope my analysis can help you.
TVC:GOLD FXOPEN:XAUUSD FX:XAUUSD FOREXCOM:XAUUSD PEPPERSTONE:XAUUSD OANDA:XAUUSD

Go long when the trend reverses, beware of black swansYesterday's pullback to 3313-3310 confirmed the upward trend of gold. As I expected, it broke through the resistance of 3330 and touched around 3345. Currently, the short-term strong resistance is at 3345. Only by breaking through this resistance can gold maintain its upward trend. If it is blocked near the 3345 line in the short term, there is a possibility of a pullback. If 3345 breaks, there will be 3365 and 3400 above. Once the direction is clear, it will be easier to act. If there is a pullback during the day, it will give us a trading opportunity to enter the long position.
OANDA:XAUUSD

Everybody loves Gold Part 7Great trading last week. Gold really pushing deep into blues.
This week takes a downturn with possibilities highlighted on the chart; all pointing towards LOS (Level of significance). This level is calculated based on previous week high-low values.
Trade parameters:
1. SL: 50-100pips
2. TP: 3-4x SL
3. double tops/bottom (around LOS) are direction changers.
As always price action determines trades

XAUUSD - 4H Bearish Rejection from Supply Zone | SMC AnalysisGold is showing signs of weakness after reacting strongly from a 4H Supply Zone around the 3331.72 level. Price tapped into the red supply zone, failed to break above, and is now forming lower highs — suggesting bearish momentum is building.
🔍 Key SMC Observations:
Supply Zone: Price rejected the 3331.72 level, which acted as a clear supply area based on past liquidity grabs and bearish institutional moves.
Change of Character (CHoCH): We saw a CHoCH around July 5th–6th, indicating a shift from bullish to bearish order flow.
Lower High Formation: Price failed to make a new high after tapping supply, showing signs of distribution.
Imbalance + Target Zone: Clean imbalance exists down to 3288.73 and potentially to the green demand zone around 3260–3270.
📍Trade Setup Idea:
Sell Opportunity: If price continues to reject the supply zone, look for bearish confirmation on the lower timeframes (e.g., 1H) to enter.
Target 1 (TP1): 3288.73 (near-term liquidity level)
Target 2 (TP2): 3260–3270 demand zone
Invalidation: A break and close above 3331.72 would invalidate the short-term bearish bias.
🔴 Watch for reaction around 3288.73 – if it holds, expect a possible bounce. If broken, further downside is likely.

Night range operation, technical outlook is still bearishGold fell as expected after repeated battles at 3330. Currently, gold has returned to around 3320. This shows that the rebound was mainly driven by short-term risk aversion. As market news calms down and sentiment stabilizes, the market will most likely return to the technical trend. If it unexpectedly breaks through 3330, it is expected to touch the 3345 line I mentioned this morning. The short-term 3310 line currently has certain support. From a technical point of view, I prefer to short. Once it falls below 3310, the subsequent support will move to 3295-3285. Therefore, I think it is a good choice to short again at 3320-3330.
OANDA:XAUUSD
Gold fluctuates, continue to short at 3345 during the dayTrump's trade policy continues to stimulate risk aversion. Although the Federal Reserve's meeting minutes are neutral, they can potentially provide support for gold. Yesterday we gave the short positions of 3321 and 3333, which have generated profits so far. At the same time, it should be noted that the 4H MACD indicator has the potential demand to form a golden cross. In the short term, there is a certain suppression force at 3330-3335. If the Asian and European sessions repeatedly test this position but fail to break through effectively, you can go short without hesitation. If you want to go short again during the day, you can consider 3340-3345 and defend 3350. The lower 3310-3305 is a relatively strong support area during the day. If the Asian session retreats to this point, you can consider going long, with the target looking at 3330-3335.
OANDA:XAUUSD
Perfect prediction, pay attention to the high short entry pointTrump extended the tariff agreement to August 1 and began to collect tariffs again. Although it eased market tensions, his remarks will not be extended after the expiration, and he issued a tariff threat, which increased global trade uncertainty and pushed up risk aversion. There was no clear direction coming out of the Fed's meeting minutes last night, but the potential bias was bullish.
At the beginning of the Asian session this morning, I also indicated that gold would rise and then fall. At present, it has reached the highest point near 3325 and then began to retreat, but the 4H golden cross has just been formed. There is still a certain pressure above 3333. If the gold price repeatedly competes for this position, we can continue to short without hesitation. The second short position today is near 3340-3345. There is potential momentum for the bulls in the short term. If the European session continues to fluctuate below 3333, then the entry of short positions will be slightly more stable. Yesterday, short orders were given at the key points of 3321 and 3333, and TP looked at 3310. If the bulls re-emerge below 3310-3305, you can consider short-term long positions and target 3330-3335.

Gold rebounds as expected, NY focuses on the Fed meeting📰 News information:
1. Federal Reserve meeting minutes
📈 Technical Analysis:
Gold fell into a narrow range of fluctuations during the European trading session. As I said this morning, gold is expected to rebound in the short term and the bullish momentum needs to be released. From a technical perspective, the overall market is still in a volatile pattern. The support at the 3280 level below is still a key point that needs attention in the short term. The European session has repeatedly tested this area. If it falls below this support, it is expected to touch the 3250 level as I said. While guarding against gold diving during the NY session, the upper resistance of 3315-3321 cannot be ignored to prevent bullish retaliation.
🎯 Trading Points:
SELL 3315-3321-3333
TP 3300-3290-3280-3250
In addition to investment, life also includes poetry, distant places, and Allen. Facing the market is actually facing yourself, correcting your shortcomings, facing your mistakes, and exercising strict self-discipline. I share free trading strategies and analysis ideas every day for reference by brothers. I hope my analysis can help you.
OANDA:XAUUSD PEPPERSTONE:XAUUSD FOREXCOM:XAUUSD FX:XAUUSD FXOPEN:XAUUSD TVC:GOLD
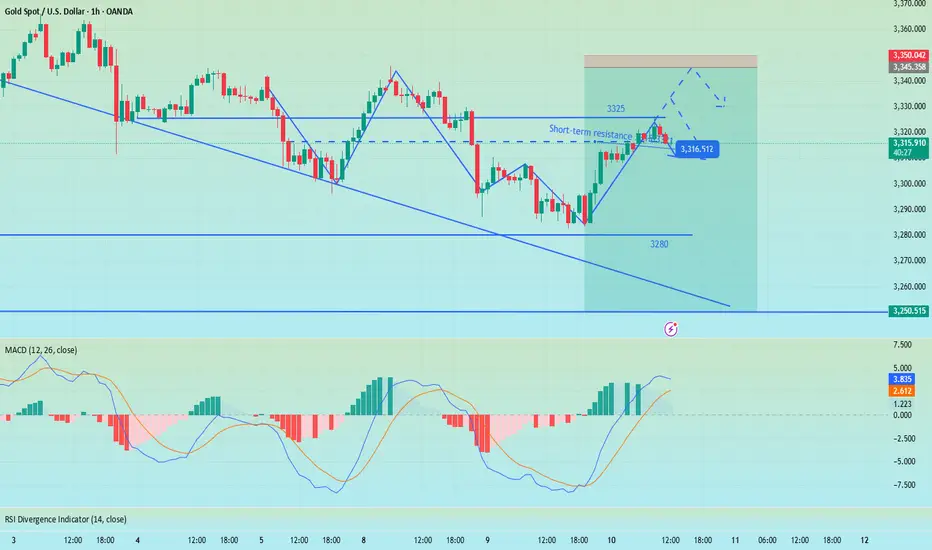
XAUUSD Idea: 4H Trendline First Breakout - Liquidity PlayFOREXCOM:XAUUSD
🔍 Analysis Overview:
Price has just broken above a 4H descending trendline for the first time. However, I remain cautious due to the following key observations:
📌 NOTES:
The broader market sentiment is still bearish due to recent tariff-related news, which often fuels risk-off behavior.
Historically, the first breakout of a strong trendline often fails, trapping early buyers.
This breakout is likely attracting buy-side liquidity, giving institutions an opportunity to hunt stops.
My observation shows buying interest started around the 3308–3313 range, suggesting smart money accumulation and a possible trap.
📉 I'm watching for a fake breakout and potential reversal targeting the liquidity zones marked below around 3307 and possibly lower.
The liquidity sweep below equal lows could offer a better risk-reward setup.
💡 Conclusion:
If price fails to hold above this breakout and shows signs of rejection, I will be anticipating a return towards the previous demand zone for a liquidity grab.
#XAUUSD #GoldAnalysis #SmartMoneyConcepts #LiquidityGrab #ForexTrading #TrendlineBreak #MarketPsychology #TradingSetup #SMC #PriceAction

XAUUSD Loses Short-Term Support – Deeper Decline May FollowAt the current moment, gold (XAUUSD) has made a significant breakout, surpassing the key resistance zone at 3,326 USD and is now trading around 3,328.94 USD. This breakout confirms that the short-term bullish trend remains strong.
1. Short-Term Trend: Bullish Momentum Expands
After holding the key support zone around 3,311 – 3,315 USD (aligned with the 0.618 Fibonacci retracement), XAUUSD bounced back and broke above the previous high at 3,326 USD. The current uptrend is confirmed by higher lows and a clear breakout candle from the recent consolidation.
2. Updated Support and Resistance Zones:
Immediate Support: 3,318 – 3,320 USD, near the rising yellow trendline and breakout retest zone.
Next Resistance Target: No clear barrier on the 15-min chart, but psychological levels and Fibonacci extensions suggest 3,332 – 3,335 USD could act as the next upside targets.
3. Price Action Highlights:
The breakout candle closed strongly above the 3.618 Fibonacci extension level (3,326.26 USD), showing solid buying pressure.
A bullish signal ("B") from LuxAlgo was triggered near the minor pullback at 3,318 USD, adding further confirmation.
4. Key Technical Signals:
Price has broken out of the purple rectangle consolidation zone, expanding its trading range.
The 0.618 Fibonacci level at 3,311.78 USD continues to act as firm support.
The ascending yellow trendline remains intact, providing dynamic support to the bullish trend.
5. Suggested Trading Strategy:
Buy on Pullback: Consider long positions around 3,318 – 3,320 USD if price retests this zone with bullish confirmation.
Breakout Continuation Buy: A firm close above 3,330 USD with high volume could signal a move toward 3,335 – 3,340 USD.
If price falls below 3,315 USD and closes weakly, the bullish momentum may begin to fade.
XAUUSD is in an extended bullish phase after breaching the 3,326 USD resistance. As long as price holds above the 3,318 – 3,320 USD zone, there is room for the uptrend to continue.
Do you think gold will break above 3,330 USD? Drop your thoughts in the comments and let’s discuss trading strategies together!

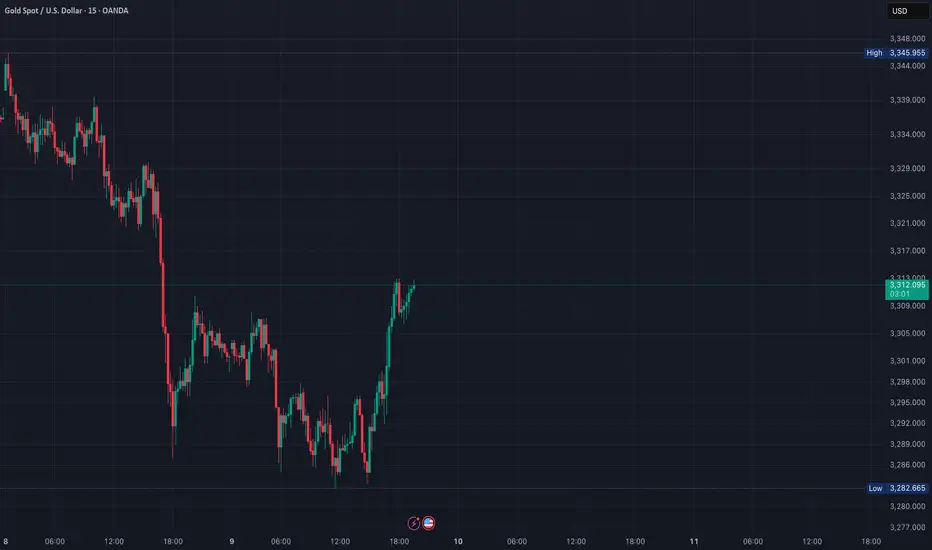
Gold Rebounds from 3283, Eyes 3315 Resistance📊 Market Overview:
• Gold dropped sharply to a low of $3283 earlier today before rebounding strongly back to around $3312, supported by renewed buying interest.
• The recovery is fueled by risk-off sentiment amid ongoing trade negotiation uncertainty and a mild pullback in the U.S. Dollar Index.
• Central bank buying continues to underpin gold’s base, despite mild pressure from rising U.S. bond yields.
________________________________________
📉 Technical Analysis:
• Key Resistance: $3315 – $3335
• Nearest Support: $3280
• EMA 09: Price is trading above the 9-period EMA, signaling a short-term bullish trend.
• Candle pattern / Momentum: A strong bullish engulfing candle formed after bouncing from $3283 on the H1 chart. MACD is crossing upward, and RSI is approaching the 60 level, suggesting bullish momentum.
________________________________________
📌 Outlook:
Gold may continue to recover in the short term if it holds above the $3300 level and successfully breaks through $3315 resistance. However, failure to break above this resistance could lead to a short-term pullback toward $3290–$3280.
________________________________________
💡 Suggested Trading Strategy:
🔻 SELL XAU/USD at: $3315–3325
🎯 TP: $3295
❌ SL: $3330
🔺 BUY XAU/USD at: $3285–3295
🎯 TP: $3315
❌ SL: $3280

GOLD Sell IdeaGold Trade Alert (XAU/USD): I’m entering a sell position in the 3324–3330 zone, targeting a drop to 3273 with a stop loss at 3340 to protect against unexpected spikes. Looking for the price to retrace toward the lower support area.
Always manage your risk and watch for momentum confirmation before entry.
Entry: 3324 - 3330
SL: 3340
TP: 3273

Elliot WaveOn the 4hr you could see that wave C is in progress. On the daily gold is currently busy with a Wave 5. Once Wave C is finish on 4hr we might get a movement up . Wave ABC on the 4hr is a pullback on the daily.

XAUUSD – Watching the 3318 Resistance for Potential Reversal
Currently monitoring Gold (XAUUSD) after a short-term bullish push toward the 3318 resistance zone. This area is significant due to:
Confluence with the upper Bollinger Band
Previous horizontal resistance level
Loss of momentum shown on MACD and other lower timeframes (15m–1h)
Price action is slowing as we approach the overbought territory. If price fails to break above 3318 and prints a clear reversal candlestick (e.g., pin bar or bearish engulfing) on the 1H chart, I’ll be looking for a short setup.
Disclaimer:This analysis reflects my personal view and is shared for educational purposes only. It does not constitute financial advice or a recommendation to enter any trade. Always do your own research and manage your risk accordingly. ⚠️
Gold Drops to 3,284 – Short-Term Support at Risk📊 Market Overview
Gold fell sharply this morning to $3,284/oz amid a modest USD rebound and profit-taking pressure following several range-bound sessions. The lack of fresh catalysts also contributed to weaker momentum.
📉 Technical Analysis
• Key Resistance: 3,315 – 3,330
• Nearest Support: 3,280 – 3,275
• EMA 09: Price is currently trading below the EMA 09 on both the H1 and H4 timeframes → short-term bearish signal
• Candle Patterns & Momentum:
– H1 candle shows a bearish engulfing pattern near the 3,305 area → confirms downward pressure
– RSI is below 45, MACD has crossed below its signal line → bearish momentum dominant
– If the 3,275 level is breached, gold could continue to fall toward 3,260
📌 Outlook
Gold is leaning toward further downside unless it can hold above the 3,280 support level during today’s session.
💡 Trade Strategy
🔻 SELL XAU/USD at: 3,295 – 3,398
🎯 TP: 40/80/200 PIPS
❌ SL: 3,305
🔺 BUY XAU/USD at: 3,275 – 3,278
🎯 TP: 40/80/200 PIPS
❌ SL: 3,269

7.9 Latest gold trend analysis and operation layout📰 News information:
1. Federal Reserve meeting minutes
📈 Technical Analysis:
Our decision to close our positions at 3305 yesterday was undoubtedly a very strategic one. After reaching a high of around 3310 last night, it began to fall. At the same time, I also gave VIP members the news that it might fall back to around 3300. Since the opening, the lowest point has reached around 3285. The overall trend is still under our control.
At present, gold will still usher in technical corrections in the short term. The current price of 3293-3290 support can be considered for long positions. If the European session continues to fall below the low, you can try to go short during the NY session. If the European session continues to maintain sideways consolidation, you can consider retreating and going long during the NY session. As long as the key support of 3250 below is held, gold will maintain its consolidation trend in short-term trading. On the contrary, once it falls below 3250, gold may directly touch the 3200 mark. Focus on the minutes of the Federal Reserve meeting, which may further influence the trend of gold.
🎯 Trading Points:
BUY 3293-3290-3285
TP 3305-3310-3320
In addition to investment, life also includes poetry, distant places, and Allen. Facing the market is actually facing yourself, correcting your shortcomings, facing your mistakes, and exercising strict self-discipline. I share free trading strategies and analysis ideas every day for reference by brothers. I hope my analysis can help you.

Gold rebound is powerless and waiting for catalyst! European sup
In the Asian session on Wednesday, spot gold suddenly fell rapidly in the short term, falling to the lowest level of 3284. At present, gold is firmly bearish in the near term, and the price of gold may fall to $3247/ounce. The Federal Open Market Committee (FOMC) is scheduled to release the minutes of the June monetary policy meeting on Wednesday. This document may reiterate what speculative interest already knows, that is, Fed officials are satisfied with their recent wait-and-see stance.
The Federal Open Market Committee (FOMC) will release the minutes of the June monetary policy meeting. The minutes of the Fed's June 17-18 meeting to be released will send a more dovish signal than expected, and the "wait-and-see period" for rate cuts may end in late summer.
Views on today's gold trend!
Looking back at the market, it fell first and then rose on Monday, and then retreated directly on Tuesday. The market turned so sharply, and after gold broke below 3300 again yesterday, the market tended to be weak. At present, the upward trend of gold is still in effect, but buyers seem to be losing momentum. It is worth noting that the relative strength index (RSI) triggered a "sell signal" as the index fell below 50, indicating that sellers outnumbered buyers.
From the perspective of price action, gold prices need to fall below the June 30 low of $3,246/oz to pave the way for further declines. From the 4-hour trend chart and the daily trend, the key node of opening pressure is around 3,321. This position is the low point of yesterday's sideways trading, and it is also the key suppression level of the trend line and the moving average. If you want to weaken again today, this position cannot stand firm, and the support below will first look at the double support of 3,376 and 3,247!
Gold: Short near 3,321, defend 3,331, and target 3,296-3,285! Enter long orders if it falls back to around 3,276 without breaking, defend 70, and target 3,310! If it continues to break, wait for the 3,347 first-line support to take more!

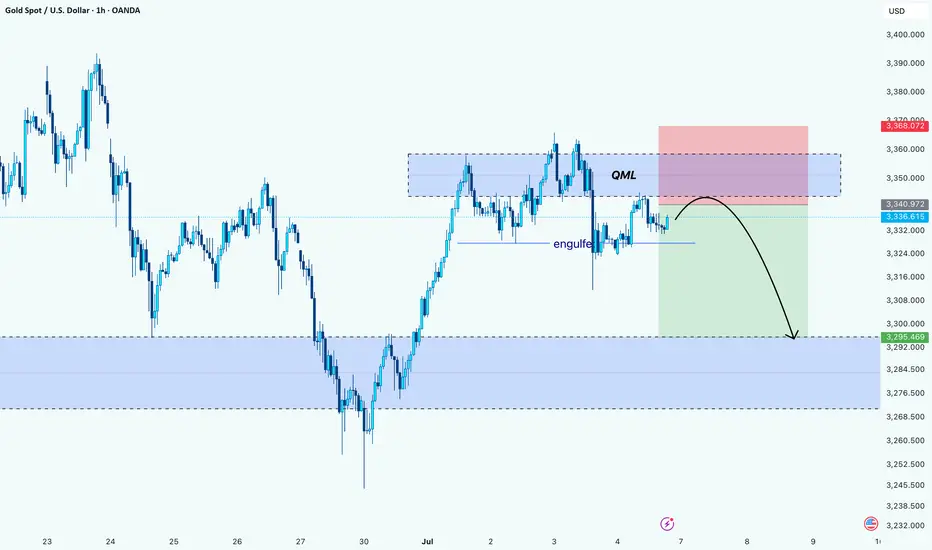
Gold’s Trap Above QML: Bearish Play UnfoldingHello Guys!
Gold appears to be forming a textbook Quasimodo reversal setup after printing a lower high into a key supply zone. Price aggressively tapped into the QML area (around 3,350–3,360), where sellers previously stepped in, and we’re now seeing signs of rejection.
The engulf zone marked earlier confirms bearish intent. It broke structure and flipped momentum. Price is currently retesting below that engulf level, likely as a last attempt to grab liquidity before heading down.
The projected move suggests a drop toward the next significant demand zone around 3,295–3,285, where the price previously found a strong bullish reaction.
Bias: Bearish below QML
Target: 3,295 zone
Invalidation: Above 3,368 (high of supply zone)
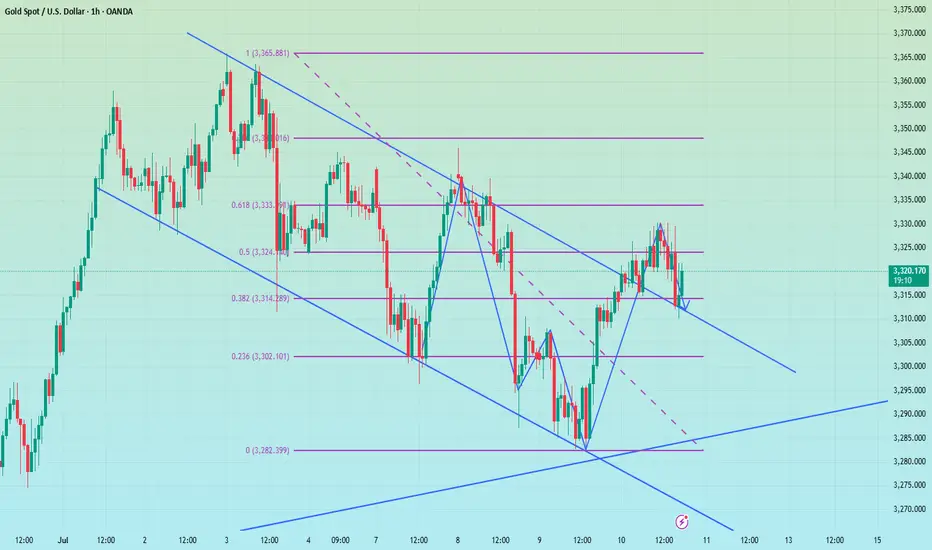
Gold (XAU/USD): Playbook in ActionHello guys!
We’ve seen a textbook QML (Quasimodo Level) setup play out beautifully on gold. Price pushed into a key supply zone and formed a QML structure, followed by a clean engulfing of the previous demand. confirming smart money involvement. As expected, the target of that QML has now been hit, tapping into the major demand zone below.
After the deep sweep and reaction from demand, price retraced upward into a potential lower high area. Based on structure and liquidity dynamics, two potential scenarios are in play:
We’re executing a two-step plan here:
Step 1: Short position from the QML + supply area, aiming for the next blue demand zone. Liquidity has been taken above the high, confirming the setup.
If we get a clean reaction near the blue area, that’s our signal to flip long. We expect a pullback toward $3310 area.

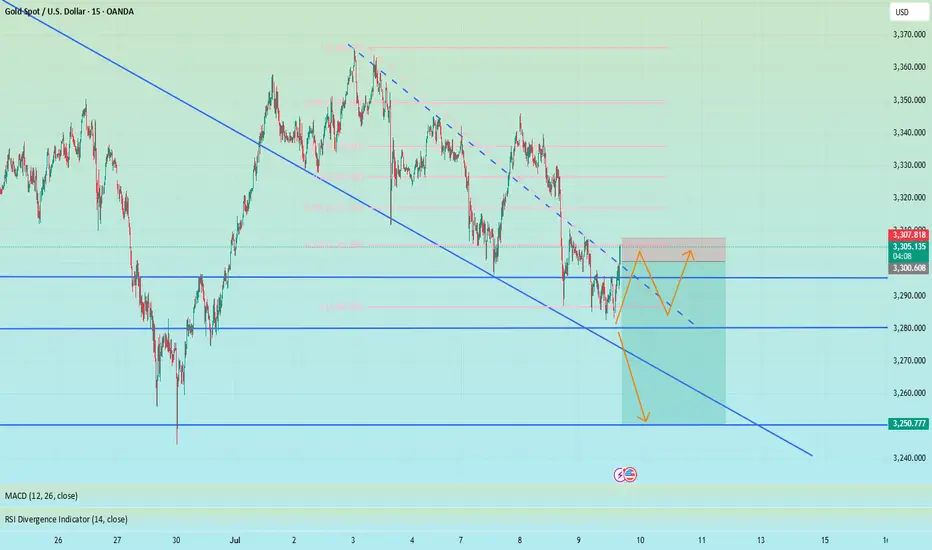
XAUUSD Loses Short-Term Support – Deeper Decline May FollowGold (XAUUSD) is showing clear signs of short-term weakness after losing a key support zone around 3,287 USD – which previously aligned with the rising trendline and the 61.8% Fibonacci retracement level (3,295.20 USD) of the prior downward move.
1. Price Structure and Current Pattern:
Price has formed a descending triangle and just broke below its lower boundary with strong bearish candles.
Consecutive bearish candles with short lower wicks indicate strong selling pressure with little buying interest.
After being rejected at 3,304.25 USD – the most recent swing high – price has dropped toward the 0.0% Fibonacci level at 3,280.57 USD.
2. Fibonacci and Key Price Zones:
The 3,295.20 area (Fibo 0.618) has now become a strong resistance after a failed recovery attempt.
The 3,280 – 3,275 zone is the next target for bears if no strong reversal appears in upcoming sessions.
A break below 3,275.73 may open the path for further downside toward 3,268 – 3,260.
3. Trendlines and Candle Behavior:
The short-term rising trendline (in red) has been broken alongside increasing sell volume.
The upper descending trendline (in light blue) remains intact, confirming that the overall structure is still bearish.
Suggested Trading Strategy:
Sell on rallies: Prefer short entries around 3,290 – 3,293, with a stop loss above 3,296.
Short-term target: Look for potential take-profit zones at 3,275 – 3,268.
Avoid bottom fishing unless there’s a strong bullish reversal signal such as an engulfing or hammer candle backed by volume.
Conclusion:
Gold is under visible downside pressure below key technical resistance. If the price fails to hold above 3,280, the downtrend could extend further. Traders should remain cautious of weak pullbacks and look to enter in line with the dominant bearish trend.

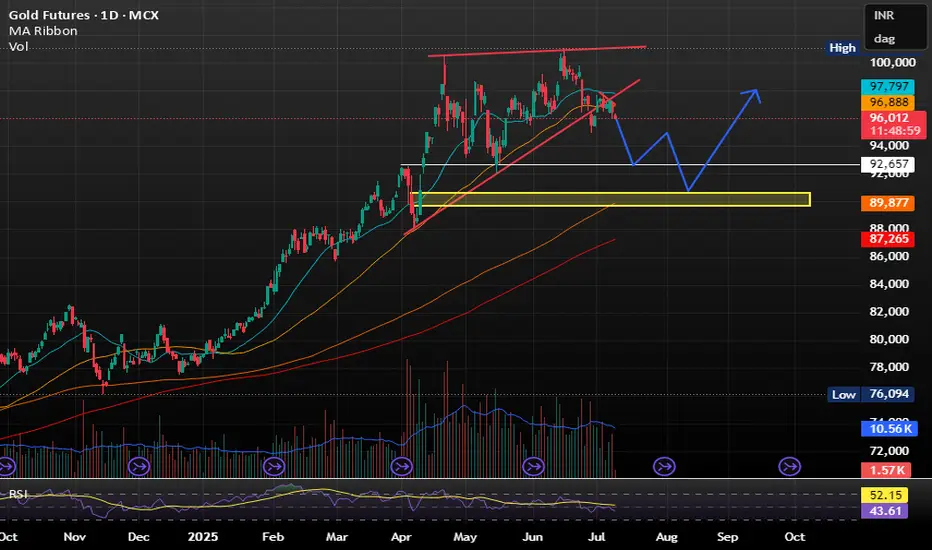
GOLD IS MELTING LIKE A ICEGOLD IS MELTING LIKE A ICE -
Trading below 20SMA and 50SMA making it less attractive at current price level.
ALSO RELATIVE STRENGH IS WEAKNING .
As per my view Sell on rise will be profitable for short term .
DOWNSIDE TARGET SHOULD BE WITHIN 92000 TO 90000 .