Gold Short Term OutlookYesterday, we saw gold reclaim the 200MA and push into the $3,352 resistance. Price remains supported above the $3,327 level, keeping the bullish structure intact for now.
As long as price holds above $3,327, bulls remain in control, and a breakout above $3,352 could open the path toward $3,364 and $3,383.
However, failure to hold above $3,327 may lead to another retest of $3,298, with deeper downside toward $3,270-$3,41 support zone if that level gives out.
📌 Key Levels to Watch:
Resistance:
$3,352 • $3,364 • $3,383 • $3,400
Support:
$3,327 • $3,298 • $3,270 • $3,241
Goldsetups

Gold Market Update - XAUUSD May 5th after PMI news🧠💣 “This Chart Might Offend Your Favorite Indicator – We Trade Pure Structure Only.” 💥⚡
⏳ Market Context:
Gold exploded from 3210 to 3328 after PMI release, trapping late sellers and punishing anyone short below 3260. After a sharp rejection at the 3327–3333 premium zone, price dropped fast to 3306 before recovering — confirming both a valid sell reaction and strong demand.
Now price is climbing again, sweeping equal highs and pressing into a weak high zone. But guess what? No valid H1–H4 supply break yet = no strong bearish confirmation. Smart Money is lurking — we’re watching the next trap unfold.
🧠 Structural Key Zones (What Price Is "Eyeing"):
Above:
• 🔥 3360 = weak high reaction level
• 🔥 3380–3395 = unmitigated FVG zone and final high supply pre-sell-off
Below:
• 🧊 3305–3310 = recent liquidity grab zone
• 🧊 3272–3284 = daily FVG + EMA confluence
• 🧊 3220–3235 = HTF unmitigated bullish OB + H4/D1 EMA200 = possible swing reentry
🔥 “Gold’s Not Done — The Liquidity War Isn’t Over Yet”
Smart traders aren’t guessing. They’re stalking zones. Let’s lock in the plan.
🧭 Bias & Flow
Macro: No more high-impact USD news today. Market digesting ISM PMI.
HTF (H4–D1): Bullish continuation unless 3272 breaks
LTF (M15–H1): Bullish pressure — currently front-running premium sell zones
👁🗨 Real-Time Price Context
📍 Price now at 3332
🔸 Approaching Sell Zone #1: 3360–3368
➡ Wait for reaction or internal CHoCH to validate
➡ No aggressive short here unless 3344 starts rejecting hard
📌 Key Level Zones
Type Price Zone Confluence
🔺 Resistance 3360–3368 Weak High + OB + FVG + Liquidity
🔺 Resistance 3380–3395 Final premium trap zone (HTF sell block)
🟩 Support 3272–3284 H1 Demand + FVG + EMA stack
🟩 Support 3220–3235 HTF OB + EMA200 D1 + Deep liquidity
🎯 Sniper Entry Plan
🔻 Sell Zone #1: 3360–3368
• SL: 3376
• TP1: 3344
• TP2: 3310
• TP3: 3285
Price is close — wait for confirmation wick / M15 structure shift
🔻 Sell Zone #2: 3380–3395
• SL: 3405
• TP1: 3360
• TP2: 3325
• TP3: 3275
High-risk sell if bulls overextend; final stop before reversal
🟢 Buy Zone #1:3300–3306 → Previous reaction zone
‣ SL: 3290
‣ TP1: 3320
‣ TP2: 3340
‣ TP3: 3360
Clean demand left unmitigated, supported by fair value gap on M15.
🟢 Buy Zone #2: 3272–3284
• SL: 3262
• TP1: 3305
• TP2: 3333
• TP3: 3360
Still valid if we see clean sweep and reentry from FVG
🟢 Buy Zone #2: 3220–3235
• SL: 3200
• TP1: 3260
• TP2: 3300
• TP3: 3340
Only if market nukes deep — last solid demand floor
🔍 Eyes On Zones
🔹 3344: micro resistance = potential front-run fade
🔸 3360: must-watch — premium trap candidate
⚠ Below 3272 = bearish sweep risk into 3220
💬 Final Word — GoldMindsFX Style
Don’t be fooled by the speed. Gold’s strength is real — but so is its manipulation. Snipers don’t chase, they prepare. Stay cold, stay calculated.
🔥 Drop a ⚔ if you’re stalking 3360 with surgical intent.
🙏 Like this breakdown? Boost and follow us for sniper setups all week.
📌 Important Notice!!!
The above analysis is for educational purposes only and does not constitute financial advice. Always compare with your plan and wait for confirmation before taking action.

XAUUSD (GOLD) SELL ANALYSISHere on gold price has made a rebound around psychological level of 2,360.000
and is like to fall after the trendline breakout. So going for SHORT is needed the targeting profits should be around psychological level of of 2,335.000

XAUUSD (GOLD) SELL ANALYSISHere on gold price has made a rebound around psychological level of 2,360.000
and is like to fall after the trendline breakout. So going for SHORT is needed the targeting profits should be around psychological level of of 2,335.000

XAU blueprint (BULLS TO BEAR)Just as the analysis implies, xau overview is a bearish momentum right now and any bullish movement is merely a retracement for a continued bearish swing.
Eyes on 2006 for a bullish retracement and then a follow-up bearish movement till the 1980's where another bullish retracement is expected.
BOOST🚀 , COMMENT🗒 AND FOLLOW🏷 FOR MORE HELPFUL ANALYSIS 👍 ......

XAUUSD breaking out of falling wedge - XAUUSD breaking out of falling wedge on 2hr. It's consists LH LLs.
- XAUUSD also tapped previous lows range and rejected it
- creating HH and HLs on ltf = Basically Gold's market structure is flipping to bullish
Entry when it confirms breakout of wedge
TP1 0.618 fib level
TP2 0.702 fib level
TP3 Top of the wedge


GOLD SHORT TERM BULLISH...
Hello Traders, here is the full analysis for this pair,
let me know in the comment section below if you have any questions,
the entry will be taken only if all rules of the strategies will be
satisfied. I suggest you keep this pair on your watch list and see if
the rules of your strategy are satisfied.
Dear Traders,
If you like this idea, do not forget to support with a like and follow.
PLZ! LIKE COMMAND AND SUBSCRIBE.

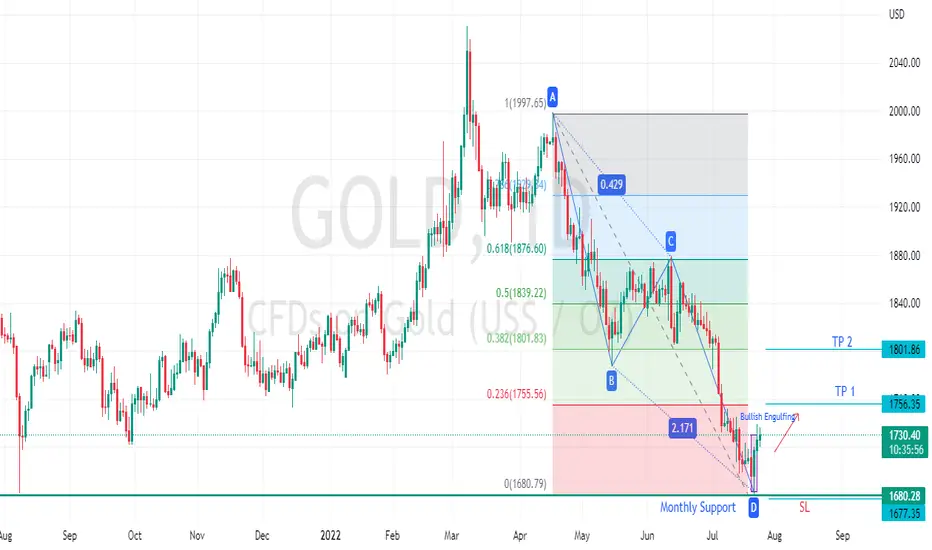
Gold Bullish PotentialABCD Bullish Reversal Pattern
Price reacts on Monthly support and makes Bullish Engulfing Candle
Q3(3RD QUARTER) ANALYSIS FOR GOLD, BULLISH BEFORE BEARISH Hey guys.
I'm Martin Sylvester😅😅😅😅
Everything Charts.
I want to engage you a little.
If your chart is open.
You could use horizontal lines on the higher Timeframe like D1.
Something is really really nice there and I spotted it. I may be wrong but it's so sweet and I'll like to share it.
$2000 price
$1900 price
$1800 price
$1700 price
Each with 1000pips separation but really aligns to price movements on Gold.
I'm more of a round up number person when it comes to dissecting a chart.
So Gold found itself at $1800 and just spiked to $1790.
When Gold got to $2000, it spiked to a midpoint $2050 but $2000 is the main main part, it went down to $1900, patterned it's movement back to $2000, dragged down to $1800
From all indications, history repeats itself😅😅😅😅😅
We are likely to see a move to $1900 or $1950 cos for Gold to spike to $2050 but main price point is $2000, history will repeat itself from past data that it will get to $1900 and may possibly spike to $1950/$1960.
Then drop down as before...
When it spiked to $2050/$2060, what happened???
It dropped to $1900, made a Retracement to $2000 and dropped to $1800.
So let's see it this way..
Rally to $1900, spike to $1950/$1960, then a drop to $1700.
That's like 2000pips plus repeated on historical data of the charts..
Cos $2050/$2000 to $1800 is 2500pips move...
So if there's a Retracement to $1950/$1900, it will be another 2500pips move if we were to look at how data collides with algorithm and repeats itself.
2500pips decline from $1950/$1900 would be at exactly $1700 as predicted earlier.
Trade with caution but these are just speculations, I may be wrong (as I'll always say).
I'm open to corrections(as I'll always say).
If you can take your time to mark these price points, it will help with trades for Gold(XAUUSD).
Lest I forget, there are in-between reaction price points too that I know of that moves in 200pips difference.
Lemme list them starting from top to bottom
$2070
$2050(midpoint for $2000 and $3000)
$2030
$2010
$1990
$1970
$1950(midpoint for $1900 and $2000)
$1930
$1910
$1890
$1870
$1850(midpoint $1800 and $1900)
$1830
$1810
$1790
$1770
$1750(midpoint for $1700 and $1800)
$1730
$1710
$1690
$1670
$1650 (midpoint for $1600 or $1700)
Yours Truly,
Martin I. Sylvester
Financial Market Analyst

Goldilocks Frustrates Bears AgainIn this update we review the recent price action Gold and identify the next high probability trading opportunity and price objectives to target.

Gold On The EdgeIn this update we review the recent price action in Gold and identify the next high probability trading opportunity and price objectives to target.

Gold Triangle TradeIn this update we review the price action in Gold and identify the next high probability trading opportunity

Gold Sell Setup (Short-term).This count is based on my assumptions so anything can happen not a trading or financial advice just for educational purposes only kindly do your own ta thanks trade with care good luck.


GOLD New Trade And Analysis To Catch More Than 300 Pips This is an educational + analytic content that will teach why and how to enter a trade
Make sure you watch the price action closely in each analysis as this is a very important part of our method
Disclaimer : this analysis can change at anytime without notice and it is only for the purpose of assisting traders to make independent investments decisions

Gold +600 Pips And 2New Entries Here This is an educational + analytic content that will teach why and how to enter a trade
Make sure you watch the price action closely in each analysis as this is a very important part of our method
Disclaimer : this analysis can change at anytime without notice and it is only for the purpose of assisting traders to make independent investments decisions

Gold Analysis And What Will Happened With The Elections !This is an educational + analytic content that will teach why and how to enter a trade
Make sure you watch the price action closely in each analysis as this is a very important part of our method
Disclaimer : this analysis can change at anytime without notice and it is only for the purpose of assisting traders to make independent investments decisions


BUTTERFLY BULL ON H1, H2 & H4 |HARMONIC + FUNDAMENTALS + TECHThis butterfly pattern seats in a pretty comfortable support and resistance zone with a somewhat visible ascending head and shoulder formation. So I have picked my entry points as you can see but remember to watch the fundamentals.
Here are the fundamental factors to keep in mind on Gold:
-Australian ANZ Job Advertisements
-Australian TD Securities Inflation
-Australian Inventories and Company Operating Profits
-Japanese Consumer Confidence
-US Factory Orders
-UK Markit/CIPS Construction PMI
-Eurozone Sentix Investor Confidence
-Eurozone PPI
Good Luck
