Gold explosion will be short livedThe price explosion in gold is solely due to the tariffs.
I don’t even want to go into detail about what impact this will have on the USA. I’ll just say this much: I feel sorry for the American people, and it’s not their fault.
And here, once again, we see the universal law of physics inherent in Median Lines/Forks at work. Right at the center line, the price will pull back and may drift toward the lower median line parallel, should the close occur below the center line.
It seems as though the basic rules of arithmetic are a foreign concept to those in leadership. There is a belief that billions of dollars will now suddenly flow into the U.S. Treasury overnight — which is, of course, complete nonsense. If that were truly the case, the price of gold in London would have risen in step with the U.S. gold price.
Instead, this madness will unfold as yet another act of monumental miscalculation, spreading across the U.S. economy and cementing the debt ledger as if it were the stone tablet of the Ten Commandments.
Let us see what our Median Line/Fork framework will reveal over the coming days.
…and I keep the world in my prayers, that peace may find its way into our thoughts.
Goldshort

XAUUSD Gold Intraday 07 Aug (Short) XAUUSD Intraday Setup
Short Setup in between 3382–3392 Resistance
Price is approaching a key supply zone between 3382 and 3392, where previous equal highs were swept. This area may act as a reversal zone.
Looking for bearish confirmation within this range to initiate short positions.
Stop Loss: 3397
Target: Previous swing lows around 3352–3355
Bearish bias remains valid as long as price stays below 3397.

Gold Technical Analysis - Bearish Bias Below $3,384Gold is currently trading near $3,373 within an ascending channel but showing signs of weakness. A rejection near the $3,384–$3,390 resistance zone could trigger a downside move toward key supports at $3,350, $3,338, and $3,326. If price breaks below the channel midline, bearish momentum may strengthen. However, a bounce from support could push gold back toward the upper range. Keep an eye on breakout zones for the next move.
🔑 Key Levels to Watch
- Resistance: $3,384 → $3,390: Strong resistance zone
- Support: $3,350 → $3,338 → $3,326
- Breakout Zones: Below $3,338: Opens room to $3,310 and below. Above $3,390: May lead to fresh highs toward $3,410+
🧭 Trend Outlook
- Short-Term: Bearish bias within the ascending channel, especially if price breaks below mid-channel.
- Medium-Term: Neutral to bullish as long as the lower channel trendline holds.
- Momentum: Losing bullish momentum; potential for downside correction.
Price is at a decision point within the ascending channel. A clean break below the mid-channel and $3,365 area can accelerate downside correction. Stay alert to key support zones and any reversal signals.
Note
Please risk management in trading is a Key so use your money accordingly. If you like the idea then please like and boost. Thank you and Good Luck!

The bullish outlook remains unchanged, go long with the trend!Yesterday, the gold bulls refreshed the high point, and the daily line closed in the form of a medium-sized Yang line with a long lower shadow. The idea of continuing to be bullish in the short term remains unchanged, and what needs to be paid attention to is the strength of the retracement, which is similar to yesterday. The current support below is maintained at the 3355-3350 line of yesterday's rise. This position is also today's key support level, and the key suppression point above is maintained at the integer level of 3390-3400. This position may not be the end point. It was also mentioned yesterday that under the range of the previous large range of fluctuations, if either side does not break through, it will likely continue to fall into fluctuations. The current bullish trend is still relatively obvious, so we still maintain the idea of low-long operations. If your current operation is not ideal, I hope I can help your investment avoid detours. Welcome to communicate!
From the 4-hour analysis, the important support below is the 3355-3350 line. If the daily level stabilizes above this position, the bullish rhythm of falling back to lows and buying on the trend will remain unchanged. Before the daily level falls below the 3350 mark, you need to be cautious about shorting against the trend. I will provide you with the specific operation strategies at the bottom, please pay attention to them in time.
Gold operation strategy: Go long on gold when it retraces to around 3360-3350, target 3375-3385 area, and continue to hold if it breaks through.

Gold XAUUSD Analysis 06.08.2025Entry: 3373–3378 (on retracement into 1H supply zone)
Stop Loss: 3385 (above recent swing high)
Take Profit: 3352 (targeting previous low / 1H demand)
Bias: BearishRRR: ~2.5:1
Analysis:
Price showed strong rejection from the 3373–3378 supply zone. Expecting a pullback into this area before continuation lower. Bearish structure remains intact with clean lower highs. Plan is to sell the retracement, with SL above 3385. Targeting 3352, which aligns with prior demand and liquidity.
Kindly show support by following liking and commenting your favourite pair for analysis.

The shot at the critical moment is the real trading opportunityGold bottomed out and rebounded yesterday, breaking the high slightly to touch 3390 before falling back. The daily line closed with a small bullish cross overnight, and the upward momentum has slowed down. Today it tends to fluctuate at a high level. In the 4H cycle, the Bollinger band is closing, and the overall bulls continue to run upward. The big positive line directly pulls up, which is relatively strong. The overall market is resistant to declines. Therefore, the big cycle does not expect a big drop for the time being, but the short-term trend fails to continue further. It is safe to maintain a pullback and go long. Pay attention to the support below 3365-3350. Go long after it stabilizes. First look at yesterday's high of 3390. If it breaks, there is a probability of going to 3400 or even around 3415, but be careful of a high rush and fall.

What does it matter if every step is just right?Today's gold fluctuation rhythm is basically consistent with our prediction. The rhythm from entry to profit-taking is clear, and the strategy is executed decisively. First, we decisively arranged long orders at the 3365-3370 line, and successfully took profit at the target line 3375, earning 150pips of profit. Then we decisively reversed and arranged short orders at 3375. The market fell back to around 3360 as expected, and realized 150pips of profit again. In the third round of operations, long orders were entered again near 3352, and the price rose smoothly to 3370 to take profit again. The overall rhythm was tight and profits were steadily pocketed. At present, gold has rebounded to around 3380-3385. We have deployed a new round of short orders in advance and will wait for the price to drop before arranging long orders. Overall, gold is in a volatile rhythm. Even if there is still room for upward movement in the future, it is likely to undergo a round of technical retracement adjustments first.
In gold trading, timing is key!Gold has currently reached a high of around 3385. The technical retracement and correction is also an affirmation of the bulls, and the current support below will continue to move up. From the perspective of the large range of the daily line, there is no large unilateral trend, and the overall box consolidation pattern has been formed. It once rose to 3385 yesterday, but failed to stand firm, indicating that the pressure from above is still quite large. If it can break through 3400, the next target may be 3430; otherwise, it may start a round of deep adjustment. There is a need for technical adjustment, so it is not advisable to chase the rise too much. If your current operation is not ideal, I hope I can help you avoid detours in your investment. Welcome to communicate with us!
Judging from the structure of the 4-hour gold chart, the key support area below is around 3350-3340. If it falls back to this area and stabilizes during the day, you can continue to rely on this area to arrange long orders. The overall bullish thinking remains unchanged. The short-term resistance above is around 3375-3385. If it breaks through, it will further test the key suppression zone of 3390-3400. I will prompt the specific operation strategy at the bottom. I suggest you keep paying attention and follow up in time.
Gold operation strategy: Go long when gold falls back to around 3350-3340, with the target at 3370-3380.
How to seize the best entry point for gold?Gold continued its bullish trend from last Friday, rising to a high of 3385 yesterday. However, the upward momentum failed to sustain, and new highs were not reached during today's Asian and European trading sessions. The short-term bullish trend has ended, and the market is showing signs of correction. Currently, gold is facing downward pressure in the short term, and the short-term trend is volatile. Strategically, we can watch for a rebound to the 3375-3385 area during the European trading session and try to participate in short-term short selling. The target is below 3365-3355. The long-term structure remains bullish. Therefore, if the price falls back to the 3355-3340 area and stabilizes, we can still consider entering long positions to continue the medium-term uptrend. In terms of trading, we should pay attention to the rhythm of the market, betting on rebound resistance with short-term short positions and then going long on dips, maintaining flexibility.

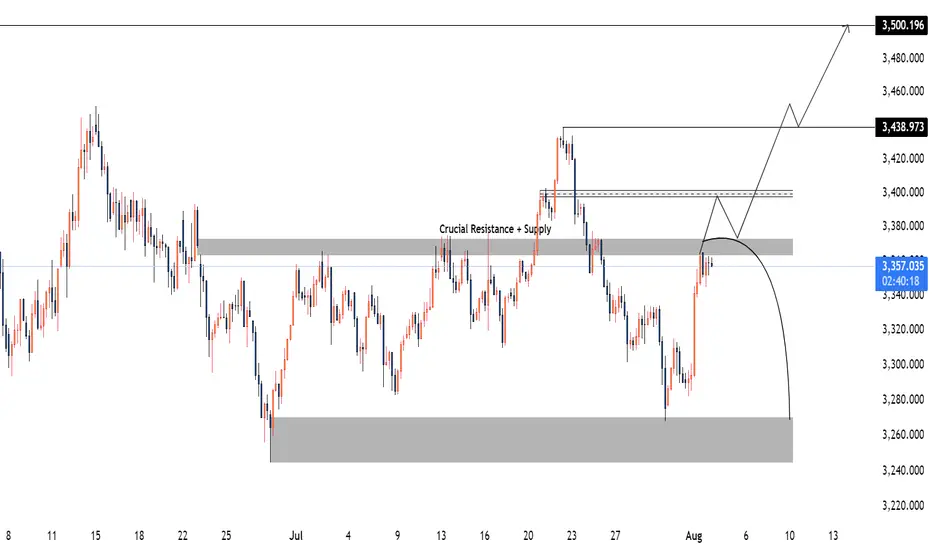
Gold XAUUSD Weekly Analysis 4-8 August 2025XAUUSD Weekly Outlook (SWING)
Price is currently approaching a crucial resistance and supply zone between 3363 – 3373. This area has historically acted as a strong rejection point and remains a significant decision level for upcoming market direction.
Bullish Scenario:
If price breaks and closes above the 3363–3373 zone and later retests it successfully—potentially around the 3400 level—this would indicate a bullish market structure shift. A strong reaction from the retest could open the path toward 3438, with a possible extension to 3500.
Bearish Scenario:
Alternatively, a rejection from the 3363–3373 supply zone without a confirmed breakout would likely trigger a downside move, targeting the lower demand area near 3250.
This 3363–3373 zone remains the key pivot. Watch for price action confirmation to validate either scenario.
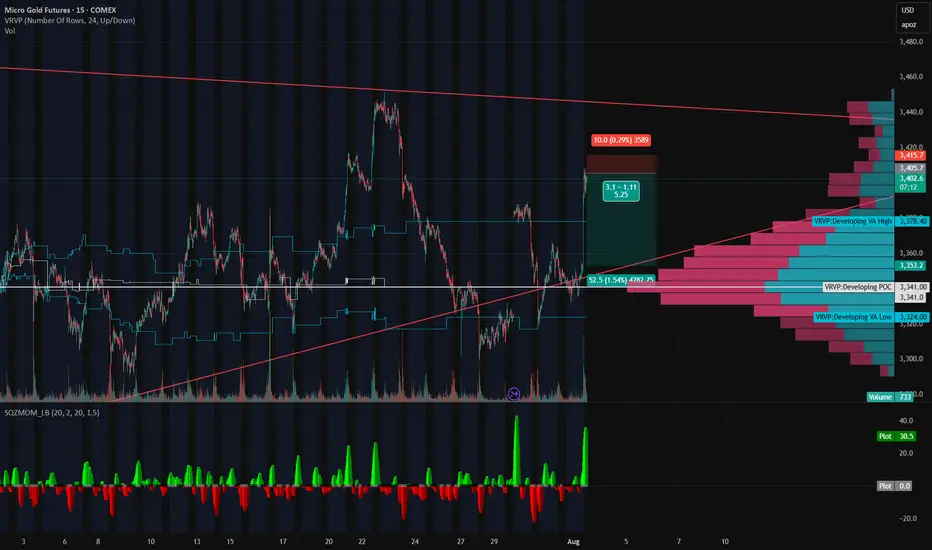
Gold’s on a Roller Coaster — and We’re Riding It Down🎢 Gold’s on a Roller Coaster — and We’re Riding It Down 🎢
Gold just snapped up like it saw Trump tweet “TARIFFS ARE BACK” — but the move smells like a knee-jerk algo pump, not real conviction. We just rejected right into a thin-volume imbalance zone and tagged the underside of a long-standing trendline.
📉 Short Setup Locked In:
💥 Entry: 3405
🛑 Stop: 3415
🎯 Target: 3353
💰 R:R ≈ 5:1
🔍 Why I'm In This Trade:
That rip? Total headline panic, not structural strength.
Low volume shelf above, with a massive POC magnet below at 3353.
We tapped the Developing VAH (3414) and got rejected — classic trap setup.
SQZMOM showing the energy is already fizzling. Green flash, no follow-through.
🧠 The Narrative:
Gold’s trying to price in volatility from every angle — Trump talk, tariffs, macro chaos — but under the hood, this pop looks unsustainable. If this is just a liquidity grab, we could see a flush back into the meat of value fast.
Grab your helmets — this roller coaster might just be heading downhill 🎢📉
Gold Showing Signs of Reversal After Hitting Key ResistanceHello Guys.
Gold has reached a major resistance zone around 3439–3425, which has already acted as a strong ceiling in the past. The price tapped into this area again, forming a clear divergence, and failed to break higher.
Here’s what stands out:
Divergence signals a weakening bullish momentum at the top.
The price rejected the resistance and is now breaking structure to the downside.
A minor pullback may occur before continuation, as shown in the projected moves.
First target: 3259.792
Second target (if support breaks): 3136.869, a deeper zone for potential bounce or further drop.
This setup hints at a bearish trend building up. Stay cautious on longs unless the price structure changes again.

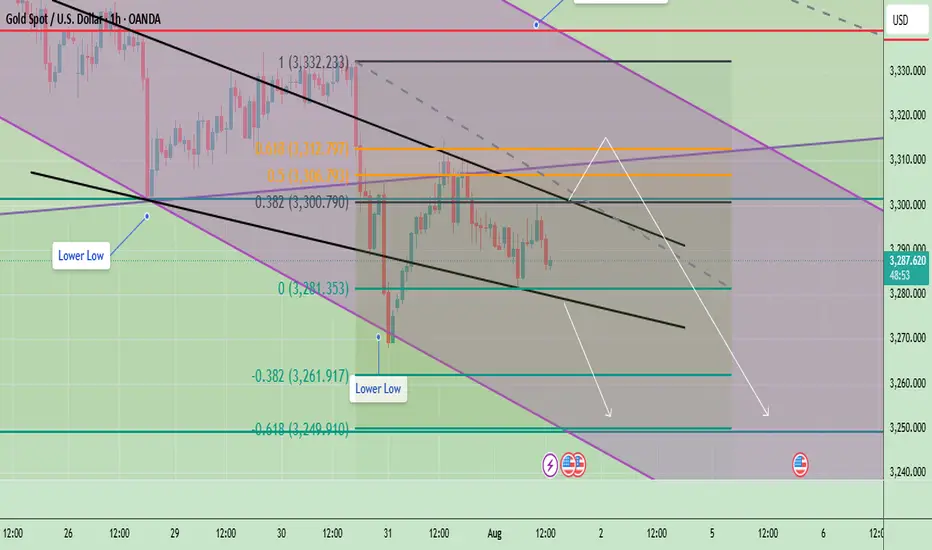
Gold Price Consolidates in Symmetrical Triangle, Breakout Ahead?Gold shows a clear bearish trend within a well-defined downward channel. Price action continues to form lower highs and lower lows, reinforcing the ongoing downtrend. The recent rejection from $3,312 suggests that bulls are struggling to regain control, and the market remains pressured by selling momentum. The price is currently hovering near $3,287 just above horizontal support zone.
📉 Potential Scenarios
- Bearish Continuation (Most Likely)
- If price continues to stay below $3,300 and breaks below $3,281, it may aim for $3,261 and $3,249.
- A close below $3,281 would confirm further bearish pressure and signal downside continuation toward the $3,240s range.
- Short-Term Bullish Retracement
- If price holds above $3,281 and breaks above $3,300–$3,312, a relief rally may occur at first resistance: $3,306 and second resistance: $3,312.
- However, unless gold breaks above $3,332 (previous swing high), this would still be considered a bear market rally.
- Range-bound Movement
- A third scenario is sideways price action between $3,281 and $3,312, where neither bulls nor bears take control immediately. This would represent market indecision or awaiting external catalysts (e.g., economic data, Fed policy).
🔍 Trend Outlook
- Short-Term Trend: Bearish
- Medium-Term Trend: Bearish, unless price breaks and sustains above $3,312
- Long-Term Trend: Neutral-to-bullish, as long as price holds above the macro support zone near $3,240
1D Chart Long Term Possible Scenario
The price is currently trading around $3,285, sitting just above the triangle’s ascending trendline support and within a key horizontal demand zone around $3,250–$3,300, which has held multiple times in the past.
If bulls manage to push the price above $3,360–$3,400, it could confirm a breakout and open the door toward the next major resistance at $3,450. However, if price fails to hold above the current ascending trendline, a breakdown could retest the base support near $3,248 or even lower toward $3,150
Gold is currently in a neutral consolidation phase within a symmetrical triangle, with both bullish and bearish breakout scenarios possible. The breakout direction from this pattern—expected in the coming weeks, will likely set the tone for gold's medium-term trend.
Note
Please risk management in trading is a Key so use your money accordingly. If you like the idea then please like and boost. Thank you and Good Luck!
GOLD REMAINS UNDER PRESSURE AFTER U.S. INFLATION DATA📊 Market Overview:
Gold is trading around $3294, down from $3311 earlier after U.S. Core PCE and Employment Cost Index came in as expected — reinforcing the Fed's hawkish stance. A stronger dollar and rising Treasury yields continue to weigh on gold.
📉 Technical Analysis:
• Key resistance: $3302 – $3305
• Nearest support: $3285 – $3275
• EMA09 (H1): Price is below the 9-period EMA → short-term trend remains bearish
• Candlestick / volume / momentum: After the sharp drop, price is consolidating between $3293–$3298 with low volume. Failure to break above $3302 may trigger further downside. RSI near 45 suggests room for more selling.
📌 Outlook:
Gold may continue to decline in the short term if it fails to reclaim $3302 and the dollar remains strong through the Asian and European sessions.
💡 Suggested Trade Setup:
🔻 SELL XAU/USD: $3296 – $3298
🎯 TP: $3280 / $3275
❌ SL: $3305
🔺 BUY XAU/USD: $3275 – $3278 (if reversal candle appears)
🎯 TP: $3295
❌ SL: $3270

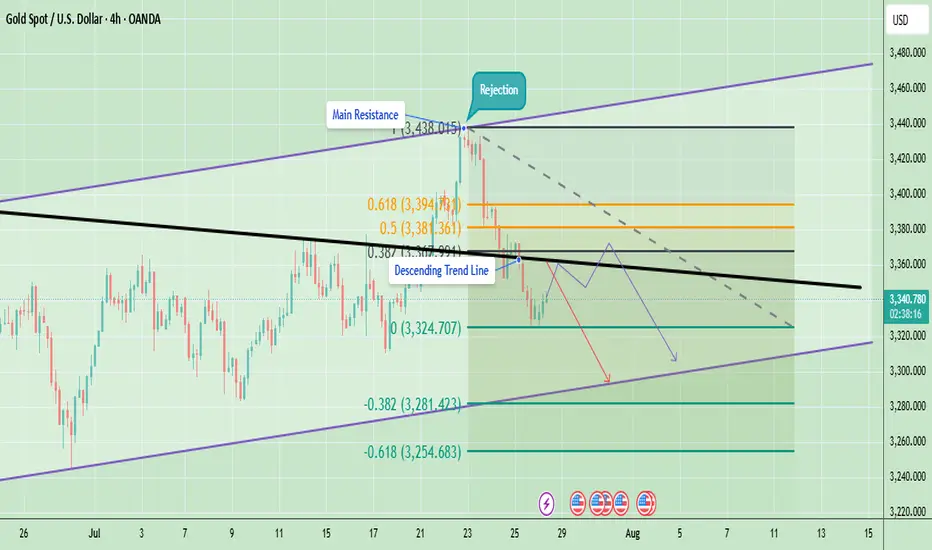
Gold Struggles at Resistance – Indicates Lower Lows AheadGold has been in a clear downtrend after facing a strong rejection around the 3,438 level (main resistance zone). Price is currently moving within a descending channel, confirming the formation of lower highs and lower lows – a classic bearish market structure.
Currently, Gold is trading near 3,306, facing resistance at 3,339 (marked as a possible lower high). If price fails to break above this level and sustain, there is a strong probability of continuation towards 3,249 and even 3,216.
Key Technical Highlights
- Immediate Resistance: 3,339 – 3,353
- Support Levels: 3,301 (short-term), 3,249, and 3,216
A rejection near 3,339 can lead to another leg down targeting 3,249 and 3,216. However, a strong breakout above 3,339–3,353 could temporarily shift momentum towards 3,394.
Note
Please risk management in trading is a Key so use your money accordingly. If you like the idea then please like and boost. Thank you and Good Luck!

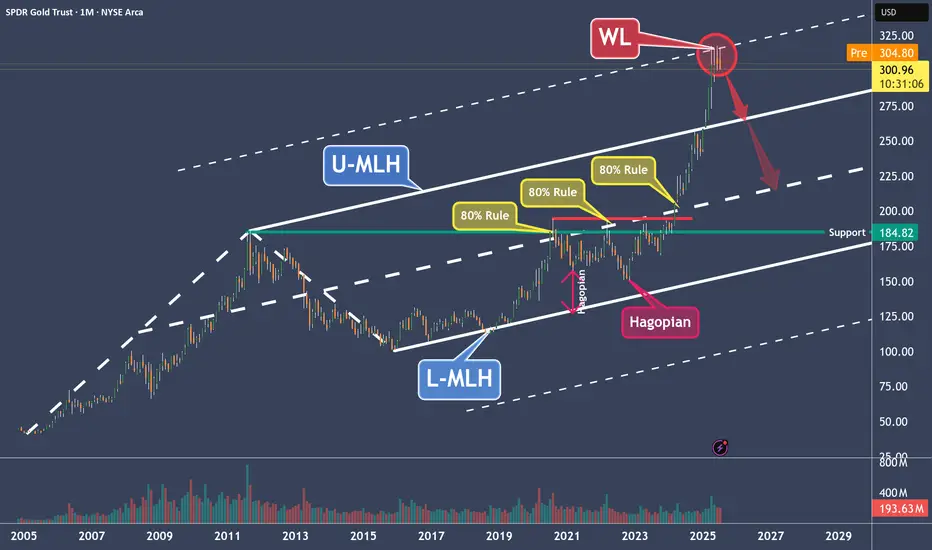
GLD – Why Gold Is a Clear Short to MePrice moved from the Lower Median Line (L-MLH) up to the Centerline, fulfilling the 80% rule.
Then we had two Hagopians, which sent price right back to the Centerline.
After the breakout above the Centerline, the next target was the Upper Median Line Parallel (U-MLH), which was reached rather quickly.
Finally, price broke above the U-MLH and was pulled up toward the Warning Line (WL).
Is this the end of the happy story?
I think so—because Gold has now reached its 2nd standard deviation, and there’s probably no more gas left in the tank.
The Trade:
- A logical target is the U-MLH.
- A secondary target is the Centerline.
At the very least, if you're long, this might be a good time to take some profits—because no tree grows to the moon.
For further details, I will follow-up with a Video explanation - See my Signature.
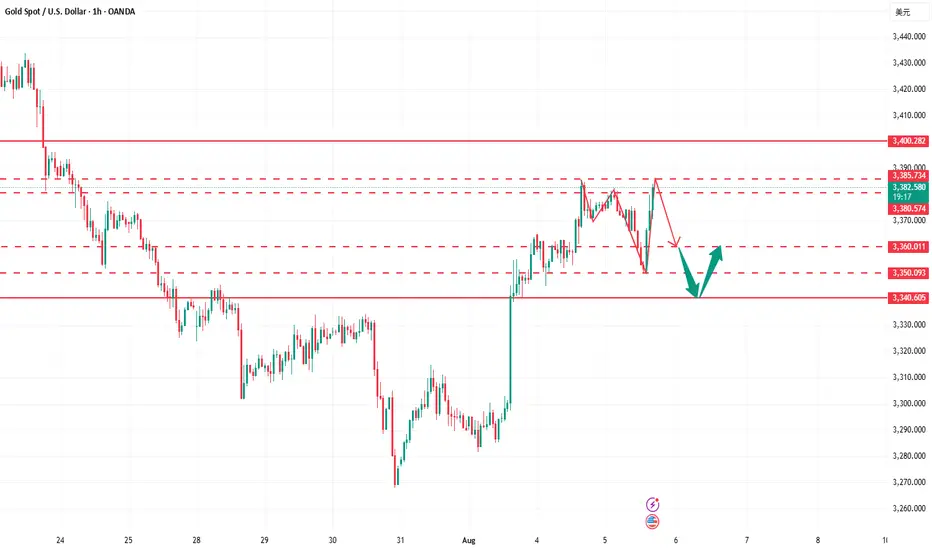
Gold Faces Strong Rejection Below $3,365 – Bearish Wave Ahead?Gold is currently trading around $3,359, showing signs of exhaustion after climbing from the $3,248 low. The chart illustrates a textbook scenario of channel rejection after testing the upper boundary of the descending wedge and failing to break above the $3,365–$3,392 resistance zone. Price is now hovering just below the diagonal black trendline, indicating a potential lower high formation and setting up for another bearish wave.
📌 Key Technical Highlights
Resistance Zone: $3,365–$3,392
This area marks the confluence of the black long-term trendline, the top of the descending purple channel, and the previous high at $3,392.
Price attempted a "Possible Retest" as annotated on the chart and is now starting to pull back—showing signs of bearish rejection.
Bearish Scenario (Blue Arrows):
Multiple downward arrows show likely bearish paths if the current resistance holds.
Key short-term targets:
$3,337, $3,320, $3,303, Strong support at $3,293–$3,248
Further downside may test extension levels toward $3,220–$3,200 by early August if momentum builds.
⚠️ Bearish Confirmation Criteria
Failure to close above $3,365 (black trendline)
Breakdown below $3,337 followed by $3,320
Strong selling pressure supported by fundamentals (e.g. USD strength, Fed hawkish stance)
✅ Invalidation / Bullish Outlook
A decisive breakout and close above $3,392.73 would invalidate the bearish structure.
In that case, targets would shift toward:
$3,412, $3,434, $3,490 (long-term trendline intersection)
However, today's U.S. CPI (Consumer Price Index) release adds a layer of volatility and potential trend disruption, making this a high-risk trading day.
📊 CPI News Impact – What to Watch
High CPI (Stronger than forecast):
- Increases expectations of further Fed tightening → strengthens USD → bearish for gold
- Likely scenario: sharp drop toward $3,337 → $3,320 → $3,293
Low CPI (Weaker than forecast):
- Signals disinflation → weakens USD → bullish for gold
- Possible breakout above $3,365 → retest of $3,392 → if broken, target $3,412 and $3,434
Neutral or as expected CPI:
- Likely leads to whipsaw — fakeout on both sides
- Caution advised — wait for candle close confirmations post-news
Note
Please risk management in trading is a Key so use your money accordingly. If you like the idea then please like and boost. Thank you and Good Luck!

Technical Analysis - Gold Rejected at ResistanceGold is currently trading around $3,341 after facing a strong rejection from the $3,438 resistance area. This rejection coincided with the upper boundary of the trend channel and the main resistance zone, which also aligns with the Fibonacci 0.5–0.618 retracement levels. After the rejection, price fell below the descending trendline, indicating that short-term sellers have taken control.
On the downside, the immediate support sits at $3,324, which has acted as a short-term bounce level. A break below this could push gold lower toward $3,281 and potentially $3,254, which are key Fibonacci extension support levels. On the upside, the immediate hurdle is at $3,355–$3,360 (descending trendline). A breakout above this area will be critical for any bullish recovery attempt toward $3,381–$3,394 and eventually $3,420–$3,438.
At the moment, the short-term trend remains bearish because gold is trading below the descending resistance and showing lower highs. However, as long as gold holds above the $3,254 support zone, the medium-term structure remains neutral to bullish, giving bulls a chance if momentum shifts again.
Last week candle is pin bar bearish candle which is showing bearish momentum at the moment. The candle shows rejection near $3,400–$3,450, aligning with the triangle’s upper resistance trendline. If gold cannot reclaim and hold above last week’s high, price may drift lower to retest support zones around $3,248–$3,150 before another breakout attempt.
Note
Please risk management in trading is a Key so use your money accordingly. If you like the idea then please like and boost. Thank you and Good Luck!
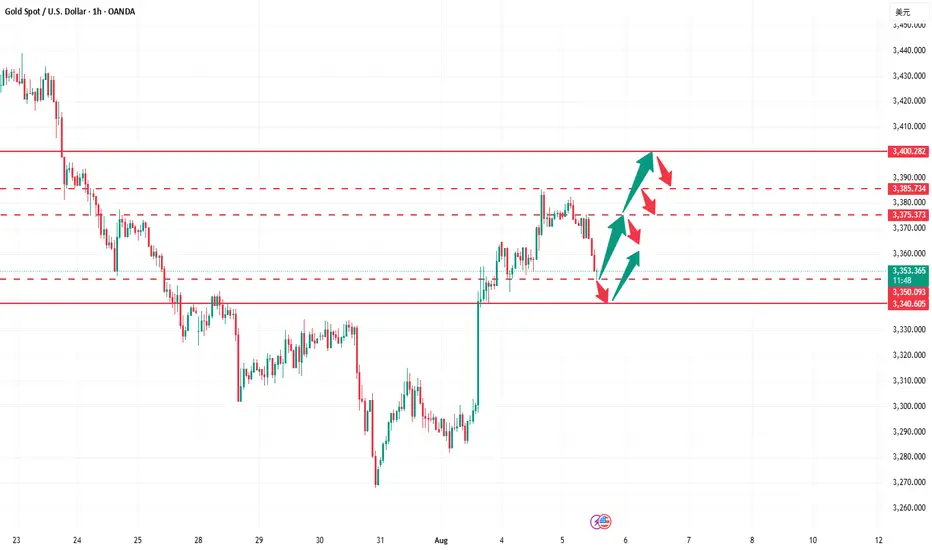
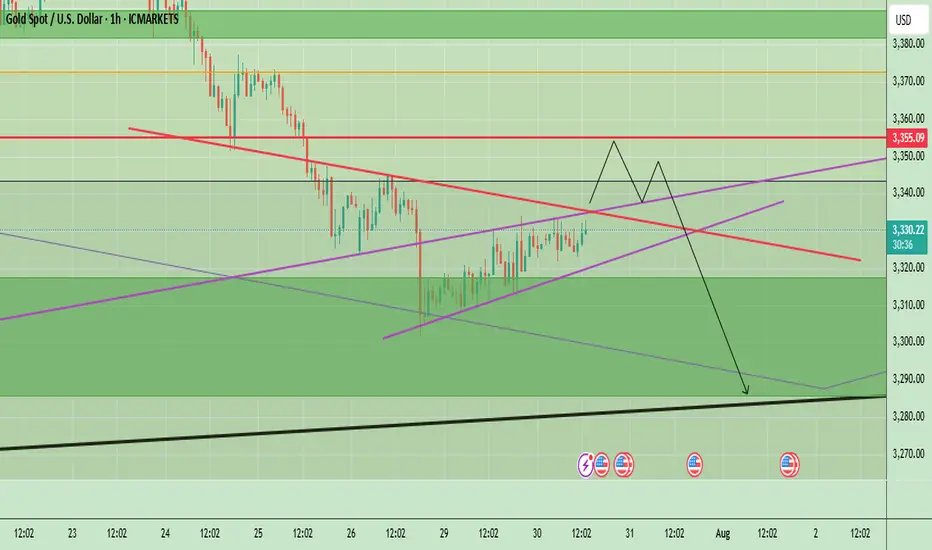
Gold Awaits Fed Rate Decision – Key Levels & Volatility AheadGold is currently trading near $3,332, showing a minor recovery after recent downward momentum. The price action on the 1-hour chart highlights a short-term ascending structure, which often acts as a corrective move rather than a strong bullish trend. The market previously saw significant selling pressure from above $3,355–$3,360, creating a short-term supply zone. Unless the price breaks and holds above this zone, the overall momentum remains bearish.
The chart also shows a projected price path where gold could push slightly higher toward $3,355, meet resistance, and potentially reverse downward again. Key support lies at $3,320, and if this breaks, we could see gold testing $3,290–$3,280 levels, aligning with the black trend line support. However, if bulls manage to break above $3,360, it would signal potential upside continuation toward $3,380–$3,400.
Key Points
- Key Resistance Levels: $3,355 and $3,360 (critical supply zone).
- Key Support Levels: $3,320 (short-term), followed by $3,290–$3,280 (major trendline support).
- Expected Short-Term Move: Possible push toward $3,355 → rejection → decline back toward $3,320 and possibly $3,290.
Bullish Breakout Scenario: A strong close above $3,360 could push price toward $3,380–$3,400.
Overall Bias: Bearish while trading below $3,360.
4hr Chart
Price remains under pressure below the descending trendline. A small pullback toward $3,345–$3,350 is possible, but as long as price stays under this resistance, the bias remains bearish with potential downside targets around $3,300–$3,280.
Key Levels:
- Resistance: $3,350 → $3,381 → $3,394
- Support: $3,324 → $3,281 → $3,254
Today’s FOMC interest rate decision is a key driver for Gold. Here’s the quick analysis:
- If Fed Hikes Rates or Maintains Hawkish Tone:
- Strong USD likely → Gold could face more selling pressure.
- Key support zones: $3,324 – $3,300, then $3,281 and $3,254.
- If Fed Pauses or Turns Dovish:
- Dollar weakens → Gold may bounce toward resistance zones.
- Upside levels: $3,355 – $3,360 and higher toward $3,381 – $3,394 (Fib levels).
Expect high volatility; $3,300 is a critical support to watch. A dovish Fed may give Gold short-term relief, but a hawkish stance could accelerate the downtrend.
Note
Please risk management in trading is a Key so use your money accordingly. If you like the idea then please like and boost. Thank you and Good Luck!
Gold Price Update – Bearish Flag Signals Possible Drop AheadGold is currently trading around $3,324, showing consolidation after a recent decline from the $3,345 region. The chart shows a bearish flag pattern forming after the sharp drop, indicating potential continuation of the downtrend. If gold fails to break above this region, sellers may push the price lower towards $3,301 and possibly $3,275.
The descending trend line adds further bearish pressure, limiting upside momentum unless gold decisively breaks and holds above $3,345. Overall, gold remains under short-term bearish sentiment, with the focus on support retests. Any bullish momentum will only be confirmed if the price closes above the flag and trendline resistance.
Key Points
Resistance Zones: $3,328 (0.618 Fib), $3,345 (flag top).
Support Zones: $3,301 (Fib base), $3,284, and $3,275 (bearish extension).
Trend Outlook: Short-term bearish unless price breaks above $3,345 with volume.
Bearish Targets: $3,301 → $3,284 → $3,275.
Bullish Invalidations: Break and close above $3,345 may shift bias to bullish.
Note
Please risk management in trading is a Key so use your money accordingly. If you like the idea then please like and boost. Thank you and Good Luck!

Bearish Gold Outlook — Potential Flash Crash Imminent🔻 Technical Structure – Bearish Breakdown Brewing
Lower highs and lower lows forming on the daily and 4H timeframes — classic downtrend mechanics.
Price has rejected multiple times near $3,400–3,430, forming a strong resistance ceiling.
Support at $3,280–3,300 has been tested too many times— and each bounce is weaker. When support holds with less conviction, it's often about to break.
Volume spikes on red candles show smart money is exiting on down moves — signs of institutional distribution.
The **tightening consolidation range** looks like a **descending triangle** — usually resolves downward.
If $3,280 breaks, expect a **liquidity event**. Stops get swept, leading to a **sudden acceleration — possibly a flash crash** to $3,200 or lower.
🌍 **Fundamental Drivers – Macro Picture Is Turning Hostile for Gold**
1. Real Yields Are Climbing
U.S. real yields are up as inflation fades and the Fed stays hawkish.
Gold, being yieldless, suffers when investors can get positive returns from bonds.
2.The Dollar Is Gaining Strength
DXY is pushing higher, fueled by strong U.S. data and weak peers (euro, yen).
Gold priced in USD becomes more expensive globally — this suppresses demand.
3. **Rate Cuts Are Off the Table — or Delayed**
Market is pricing fewer and later rate cuts from the Fed.
This removes one of gold’s biggest bullish catalysts from earlier in the year.
4. Geopolitical Fear Is Cooling
No major escalation in Ukraine, Middle East, or Taiwan.
Without fear, gold loses its safe-haven premium.
5. Central Bank Buying May Have Peaked
Recent data from WGC shows some slowing in central bank accumulation.
If this institutional bid softens, gold could drop hard — few natural buyers remain above $3,300.
⚠️Conclusion: Gold Is Walking a Tightrope
The chart is a staircase down.
Macro fundamentals are no longer supportive.
A clean breakdown below $3,280 could trigger a **chain reaction** of automated selling and margin calls — **a flash crash is on the table**.
This isn’t just a correction — this feels like the calm before the storm.

XAUUSD. MINOR UPWARDS CONSOLIDATION BEFORE THE NEXT MOVE.XAUUSD. MINOR UPWARDS CONSOLIDATION BEFORE THE NEXT MOVE.
XAUUSD rebounded from local support level of 3,300.00 and attempted to develop some bullish momentum here yesterday. However, the price went into consolidation, showing us the weakness of this short-term bullish rebound. RSI shows the bearish divergence, the price is ready to drop. Of course, fundamentals of last couple of days don't favor this asset either. The decline towards support level of 3,300.00 is expected.

XAUUSD SEEMS BEARISHAs we can see gold has created Descending triangle pattern which lead the gold in more bearish momentum.
