XAUUSD Analysis (11th April 2024)
Market Analysis PT2/2 (11th April 2024)
XAUUSD Analysis
On the 1 hour timeframe, price has created a bearish Change of Character with a body candle close, caused by the movement from CPI.
This means that the 1 hour timeframe has shifted bearish and shorts are more favoured.
On the 15 minute timeframe, price has created an unmitigated orderblock that hasnt been tested. Ideally i want to see price come up into the 15 minute bearish orderblock before looking for potential sells all the way down to the 1 hour Bullish orderblock at 2312.
Should price fall towards the 1 hour Bullish Orderblock without testing the 15 minute bearish orderblock, we can look for potential BUYS once a bullish Change of Character has occurred minimally on the 5 minute or the 15 minute timeframe.
Goldshort

CPI signal Gold has been considered a highly valuable commodity for millennia and the gold price is widely followed in financial markets around the world. Mostly quoted in US Dollars (XAU/USD), gold price tends to increase as stocks and bonds decline. The metal holds its value well, making it a reliable safe-haven. It's traded constantly based on the intra-day spot rate. Improve your technical analysis of live gold prices with the real-time XAU/USD chart, and read our latest gold news, expert analysis and gold price forecast
Gold price trades close to all-time highs with eyes on US inflation data for March. The US monthly headline and core CPI are projected to have increased at a slower pace of 0.3% in March.
Gold price trades inside Wednesday’s trading range as the US inflation data comes under the spotlight. The precious metal hovers near fresh lifetime highs around $2,360. The near-term demand remains intact as all short-to-long-term Exponential Moving Averages (EMAs) are sloping higher.
Gold now buy 2348
Target 2352
Target 2356
Target 2360
Target 2364
Target 2368
Target 2372
Target 2376
Target 2480
Target 2400
SL 2320

Xauusd Gold News: Read the Latest Analysis on XAU/USD
Gold Price: Current Pricing, Prices Chart & Rate Graph
Gold has been considered a highly valuable commodity for millennia and the gold price is widely followed in financial markets around the world. Mostly quoted in US Dollars (XAU/USD), gold price tends to increase as stocks and bonds decline. The metal holds its value well, making it a reliable safe-haven. It's traded constantly based on the intra-day spot rate. Improve your technical analysis of live gold prices with the real-time XAU/USD chart, and read our latest gold news, expert analysis and gold price forecast.
Gold now buy 2348
Target 2370
SL 2332

Gold chartGold has been considered a highly valuable commodity for millennia and the gold price is widely followed in financial markets around the world. Mostly quoted in US Dollars (XAU/USD), gold price tends to increase as stocks and bonds decline. The metal holds its value well, making it a reliable safe-haven. It's traded constantly based on the intra-day spot rate. Improve your technical analysis of live gold prices with the real-time XAU/USD chart, and read our latest gold news, expert analysis and gold price forecast.
Gold corrected from the record-high it set above $2,360 but found support near $2,350. The benchmark 10-year US Treasury bond yield is down more than 1% on the day, allowing XAU/USD to stay in the green.
Gold price (XAU/USD) attracts some buyers for the third straight day on Tuesday – also marking the tenth day of a positive move in the previous eleven – and climbs to a fresh all-time peak during the first half of the European session. The optimism over a possible ceasefire between Israel and Hamas fades rather quickly, which is evident from the cautious market mood. This, in turn, is seen as a key factor acting as a tailwind for the safe-haven precious metal.
gold now buy 2345
tp 2355
tp 2360
tp 2370
tp 2380
sl 2320

Gold buy confirm signal Gold Price: Current Pricing, Prices Chart & Rate Graph
Gold has been considered a highly valuable commodity for millennia and the gold price is widely followed in financial markets around the world. Mostly quoted in US Dollars (XAU/USD), gold price tends to increase as stocks and bonds decline. The metal holds its value well, making it a reliable safe-haven. It's traded constantly based on the intra-day spot rate. Improve your technical analysis of live gold prices with the real-time XAU/USD chart, and read our latest gold news, expert analysis and gold price forecast.
Gold price (XAU/USD) attracts some dip-buying in the vicinity of the $2,300 mark and sticks to its intraday gains near the all-time peak during the early part of the European session on Monday. Expectations that the Federal Reserve (Fed) will start cutting rates in 2024, along with buying from the Chinese central bank, have been significant drivers of the precious metal's blowout rally over the past two weeks or so. That said, extremely overstretched conditions on the daily chart hold back traders from placing fresh bullish bets amid easing geopolitical tensions and a positive risk tone, which tends to undermine the safe-haven precious metal.
Gold now buy 2337
Target 2341
Target 2345
Target 2349
Target 2353
Target 2357
Target 2400
SL 2310

THE KOG REPORT - Update (what a day on Gold)End of day update from us here at KOG:
Following on from the KOG Report published yesterday, what a move on Gold, point to point, level to level, as we like it here at KOG. Early session straight into support giving the short, then the RIP which was expected straight into the order region, and to top it off, the RIP from the order region for the short. Pip capture, unbelievable! We've been using the red box strategy for the rest of the move which has given us opportunities to capture the scalps 50-60pips a go in between.
To be honest, that should be the week all done and dusted in terms of trading.
So, what now?
We have immediate support below 2315-10 which will need a forceful break to go lower, otherwise, any attempt on support could result in another RIP to take away the liquidity now sitting above 2350! For that reason, unless you're already short from the region given and protected, caution on shorting low in this range unless we confirm the break. Resistance now stands at 2330-35 with a break taking us higher before we then attempt to target lower pricing again. They're not going to make it easy, so stay disciplined and control lot sizes, the trade will come!
Please do support us by hitting the like button, leaving a comment, and giving us a follow. We’ve been doing this for a long time now providing traders with in-depth free analysis on Gold, so your likes and comments are very much appreciated.
As always, trade safe.
KOG

Gold is long overdue for a much needed pullback In the past few weeks, gold has been soaring due to the geopolitical tensions in the middle east. In the last week's NFP, the strong numbers failed to take any advantage to most USD pairs.
So what now?
In the coming weeks, we might see a major pullback from the overbought zone which I tried to draw on the chart but having said that, it looks to me that gold has more room for upside considering we have CPI numbers coming this week.
good luck to everyone!
Carpe diem!

Chart Idea on Gold XAUUSD - 3/27/2024 - Short SetupOn Daily TF - XAUUSD looks bearish
Confirmations:
- Low Volume
- Bearish Divergence
- MACD crossing downwards
Swing short setup:
Entry - 2178.50
SL - 2202
TP - 2088

GC1! ! Chart Idea - Short SetupSwing short setup on GC1!
Confirmations:
- Bearish Divergence
- Rising Wedge
If rising wedge breaks to the downside, TP should be around 2266 - 2260

Gold NFP signal Gold has been considered a highly valuable commodity for millennia and the gold price is widely followed in financial markets around the world. Mostly quoted in US Dollars (XAU/USD), gold price tends to increase as stocks and bonds decline. The metal holds its value well, making it a reliable safe-haven. It's traded constantly based on the intra-day spot rate. Improve your technical analysis of live gold prices with the real-time XAU/USD chart, and read our latest gold news, expert analysis and gold price forecast.
Gold now Sell 2293
Target 2289
Target 2285
Target 2280
Target 2270
Target 2250
SL 2318

NFPGold price pares intraday losses, keeps the red amid modest USD strength ahead of NFP
Gold price corrects further from the all-time high amid hawkish remarks by Fed officials. Some follow-through USD buying exerts some pressure ahead of the crucial US NFP data.
From a technical perspective, weakness below the $2,265 area could expose the weekly swing low, around the $2,229-2,228 region, with the $2,250 level acting as an intermediate support. Some follow-through selling has the potential to drag the Gold price toward the $2,200 psychological mark, which is likely to act as a strong base. That said, a convincing breakdown through the said handle should pave the way for some meaningful corrective decline.
The popularly known Nonfarm Payrolls (NFP) report will be looked upon for fresh cues about the Fed's rate-cut path, which, in turn, will drive the USD demand and provide a fresh directional impetus to the non-yielding Gold price. In the meantime, persistent geopolitical tensions stemming from the Russia-Ukraine war and the risk of a further escalation of conflicts in the Middle East should act as a tailwind for the safe-haven XAU/USD. This should limit any meaningful corrective slide from the all-time peak.
Gold has been considered a highly valuable commodity for millennia and the gold price is widely followed in financial markets around the world. Mostly quoted in US Dollars (XAU/USD), gold price tends to increase as stocks and bonds decline. The metal holds its value well, making it a reliable safe-haven. It's traded constantly based on the intra-day spot rate. Improve your technical analysis of live gold prices with the real-time XAU/USD chart, and read our latest gold news, expert analysis and gold price forecast.
gold now sell 2292
TP1 2285
TP2 2280
TP3 2270
TP4 2250
SL 2316

xauusd buy chartGold stays in a consolidation phase below $2,300 after reaching a new record-high above this level earlier in the day. The benchmark 10-year US Treasury bond yield holds steady above 4.3% ahead of Fedspeak, limiting XAU/USD's upside.
Gold price (XAU/USD) retreats after hitting a fresh record high earlier this Thursday and extends its steady intraday descent through the first half of the European session. Bulls opt to take some profits off the table amid overbought conditions on short-term charts and a positive risk tone, which tends to undermine the safe-haven precious metal. Any meaningful corrective decline, however, still seems elusive in the wake of persistent geopolitical tensions stemming from the protracted Russia-Ukraine war and conflicts in the Middle East.
Gold has been considered a highly valuable commodity for millennia and the gold price is widely followed in financial markets around the world. Mostly quoted in US Dollars (XAU/USD), gold price tends to increase as stocks and bonds decline. The metal holds its value well, making it a reliable safe-haven. It's traded constantly based on the intra-day spot rate. Improve your technical analysis of live gold prices with the real-time XAU/USD chart, and read our latest gold news, expert analysis and gold price forecast.
gold now buy 2291
TP1 2295
TP2 2299
TP3 2304
TP4 2340
SL 2270

Gold buy confirm signal Gold has been considered a highly valuable commodity for millennia and the gold price is widely followed in financial markets around the world. Mostly quoted in US Dollars (XAU/USD), gold price tends to increase as stocks and bonds decline. The metal holds its value well, making it a reliable safe-haven. It's traded constantly based on the intra-day spot rate. Improve your technical analysis of live gold prices with the real-time XAU/USD chart, and read our latest gold news, expert analysis and gold price forecast.
Gold buy now 2291
Target 2295
Target 2300
Target 2305
Target 2310
SL 2280

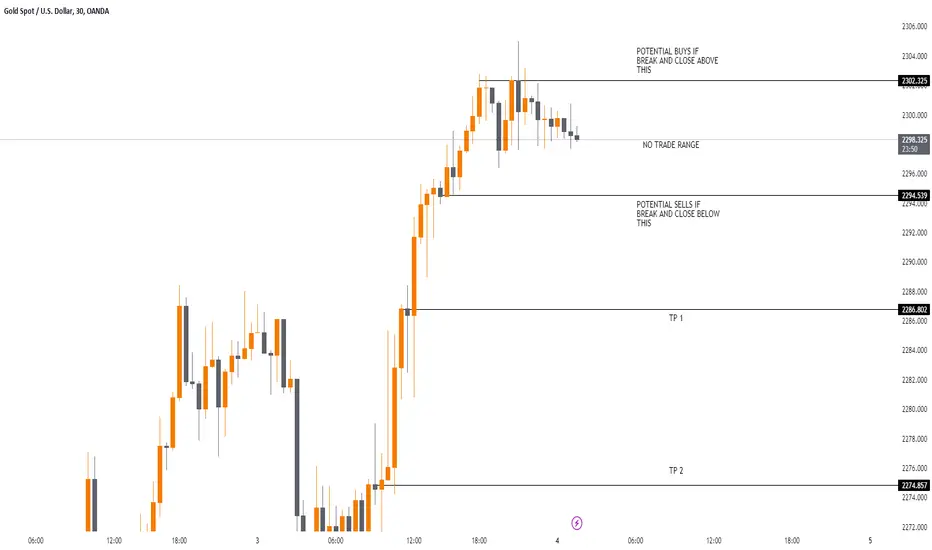
WILL XAUUSD REBOUND FROM 2300 ? 💼✨Embark on a Golden Odyssey! 💫💎✨
🔥 Attention, savvy traders! Prepare to plunge into the radiant realm of GOLD! 💫 With XAUUSD taking center stage, let's navigate the twists and turns of this captivating market. 💰📈
🌐 As the golden bull charges ahead, shattering records like never before, it's crucial to remain alert amidst the whirlwind of opportunities. 📊💥 But fret not! Within the narrow confines of 2302.50 to 2294.50 lies both caution and potential. 🚀🔒
🔮 Peer into the crystal ball, and you'll catch a glimpse of the potential for an exhilarating downward correction. Yet, in this dance of fortunes, lies the essence of trading wizardry! 🌈✨
📈 Envision this: A daring breach above the range could ignite a frenzy of buying, propelling us to the lofty peaks of 2310.50 . Conversely, if we descend below, seize the opportunity to sell and gracefully ride the waves down to 2287 and 2275. 📉🚀
🤓 Your journey through this analysis isn't just informative; it's actionable! 🚀 Let your support amplify these vibes, and remember, trade smart, trade safe. 💡✅
✌️ Until we meet again, may your trades be bountiful and your path adorned with triumph! 🌍💫💰
Xauusd confirm buy signal Gold Price: Current Pricing, Prices Chart & Rate Graph
Gold has been considered a highly valuable commodity for millennia and the gold price is widely followed in financial markets around the world. Mostly quoted in US Dollars (XAU/USD), gold price tends to increase as stocks and bonds decline. The metal holds its value well, making it a reliable safe-haven. It's traded constantly based on the intra-day spot rate. Improve your technical analysis of live gold prices with the real-time XAU/USD chart, and read our latest gold news, expert analysis and gold price forecast.
Gold price (XAU/USD) pulls back after hitting a fresh record high earlier this Wednesday and remains on the defensive through the first half of the European session.
From a technical perspective, the Gold price has been scaling higher in uncharted territory, and the recent momentum seems strong enough to allow bulls to conquer the $2,300 mark. That said, the Relative Strength Index (RSI) on the daily chart is flashing extremely overbought conditions and warrants some caution. Hence, it will be prudent to wait for some near-term consolidation or a modest pullback before positioning for any further gains.
Gold now buy 2271
Target 2280
Target 2290
Target 2303
SL 2255

xauusd chartGold has been considered a highly valuable commodity for millennia and the gold price is widely followed in financial markets around the world. Mostly quoted in US Dollars (XAU/USD), gold price tends to increase as stocks and bonds decline. The metal holds its value well, making it a reliable safe-haven. It's traded constantly based on the intra-day spot rate. Improve your technical analysis of live gold prices with the real-time XAU/USD chart, and read our latest gold news, expert analysis and gold price forecast.
confirm gold buy signal
gold now buy 2296
TP1 2305
TP2 2323
TP3 2335
SL 2275

gold buy Gold has been considered a highly valuable commodity for millennia and the gold price is widely followed in financial markets around the world. Mostly quoted in US Dollars (XAU/USD), gold price tends to increase as stocks and bonds decline. The metal holds its value well, making it a reliable safe-haven. It's traded constantly based on the intra-day spot rate. Improve your technical analysis of live gold prices with the real-time XAU/USD chart, and read our latest gold news, expert analysis and gold price forecast.
Gold price is consolidating the previous rally to all-time highs of $2,266 in Asian hours on Tuesday. Gold price looks to the US jobs data for fresh hints on a potential Fed rate outlook, especially after strong US PMI data dialed down expectations of a June Fed rate cut.
gold buy 2254
TP1 2260
TP2 2270
TP3 2280
TP4 2300
SL 2230

Gold price approaches $2,300 price expectation⭐️ Smart investment, Strong finance
⭐️ GOLDEN INFORMATION:
The price of gold (XAU/USD) has surged to record highs of nearly $2,250 per troy ounce in the early Asian session on Monday. This increase is driven by several factors, including the anticipation of a shift in monetary policy by the Federal Reserve (Fed) in the second half of 2024, ongoing geopolitical tensions in the Middle East, and hopes for China's economic recovery.
The possibility of central banks implementing looser monetary policies could further drive up the price of gold. Currently, financial markets have factored in a 68.5% chance of a quarter-point interest rate cut by the US Fed before June, according to the CME Fedwatch Tool. Fed Chairman Jerome Powell affirmed on Friday that the recent inflation data in the US aligns with their expectations, maintaining their stance on potential interest rate cuts this year. It is important to note that lower interest rates could make gold a more attractive investment since it doesn't generate interest.
⭐️ Personal comments NOVA:
The FOMO from the market is huge, the new peak of Gold is gradually reaching $2300 according to experts.
⭐️ SET UP GOLD PRICE:
🔥BUY GOLD zone: $2236 - $2234 SL $2230
TP1: $2242
TP2: $2255
TP3: $2267
🔥SELL GOLD zone: $2265 - $2267 SL $2272
TP1: $2260
TP2: $2250
TP3: $2236
⭐️ Technical analysis:
Based on technical indicators EMA 34, EMA89 and support resistance areas to set up a reasonable SELL order.
⭐️ NOTE:
Note: Nova wishes traders to manage their capital well
- take the number of lots that match your capital
- Takeprofit equal to 4-6% of capital account
- Stoplose equal to 2-3% of capital account
- The winner is the one who sticks with the market the longest

Short again in HLAfter the rise of gold and the fall below the trend line that we expected to fall, we can enter sell positions again and place the Stop loss at the bottom of the chart at the 2270
So, this analysis is a continuation and confirmation of the previous analysis so that we can have more reliable sales with the updated idea.

Next Gold Target 2090 or 2350? Check Analysis📣Hello Mates!
We have seen that gold is continuously bullish and its momentum is not going down, so now we think that gold has gone as high as it was supposed to go, maybe it can go up a little more to 2280 or 2300.
May then continue to go down and meet our targets of 2150 and 2090.
🔑 Remember, money management is crucial. Before employing our analysis, please conduct your own research and refrain from investing more than 2% of your portfolio.
📈 Our resistance levels are spotted at:
- 2266.00
📉 And our support levels are set at:
- 2150.00
- 2090.00
Stay tuned for further updates and trade smartly! 📊

Short Idea on Gold NOWHELLO GUYS THIS MY IDEA 💡ABOUT XAUSD nice to see strong volume area....
Where is lot of contract accumulated..
I thing that the sellers from this area will be defend this SHORT position..
and when the price come back to this area, strong sellers will be push down the market again..
DOWNTREND + SUPPORT from the past + Strong volume area is my mainly reason for this short trade..
IF you like my work please like and follow Thanks

GOLD TRADE IDEA / POTENTIAL BEARISH BREAKOUNT Hello Traders!
I'm looking for a short trade on GOLD. I see the price in a key resistance level where I expect a bearish momentum until the PWL. In case of confirmation, i will execute this trade.
Please LIKE 👍, FOLLOW ✅, SHARE 🙌, and COMMENT ✍ if you enjoy this idea! Also, share your ideas and charts in the comments section below! This is the best way to keep it relevant, support us, keep the content here free, and allow the idea to reach as many people as possible.
____________________________________
www.tradingview.com

What you see?!Gold can face the resistance of the ascending channel at the current price and it will be pushed back. Therefore, the best offer can be to enter short position at the upper Dynamic Resistance after the collision and confirmation of the candle.
