Golden opportunity comes again!Gold fluctuated all day yesterday, and finally did not break the range we gave. Today we continue to focus on the strong support range of 3365-3360, because this position is also the important key support we gave yesterday. Today we continue to look for opportunities to go long when we step back. As long as the strong support position below is not broken, there will be hope for the bulls to make a comeback.
From the current analysis of gold trends, gold continues to focus on the short-term support near 3375-3370 below, and the important support is around 3365-3360. The short-term focus is on the short-term suppression near 3400-3415 above. The operation is temporarily based on the range. There is a high probability that the short-term fluctuations will continue. Wait patiently for the key points to enter the market.
Gold operation strategy: Go long when gold steps back to 3375-3370, and cover long positions when it steps back to 3365-3360. The target is around 3380-3390-3400.
If you still lack direction in gold trading, you might as well try to follow my pace. The strategy is open and transparent, and the execution logic is clear and definite, which may bring new breakthroughs to your trading. The real value does not rely on verbal promises, but is verified by the market and time.
Goldshort
Have you caught up with this golden opportunity?The 4-hour K-line pattern of gold shows that the upward trend remains intact, focusing on the strong support range of 3360-3365 (technical resonance with the 5-week moving average). Before the price effectively breaks below the support band, the bulls still have upward momentum, otherwise the trend may reverse. The 3365-3400 range is maintained for intraday fluctuations. The gold operation strategy recommends arranging long orders in the 3370-3375 area when the price falls back, and adding positions to long positions if the support of 3360-3365 is broken.
Operation strategy: Gold recommends going long near 3370-3375 now, and adding positions to long positions in the support area of 3360-3365 when the price breaks, with the target of 3380-3390.
If you still lack direction in gold trading, you might as well try to follow my pace. The strategy is open and transparent, and the execution logic is clear and definite, which may bring new breakthroughs to your trading. The real value does not rely on verbal promises, but is verified by the market and time.

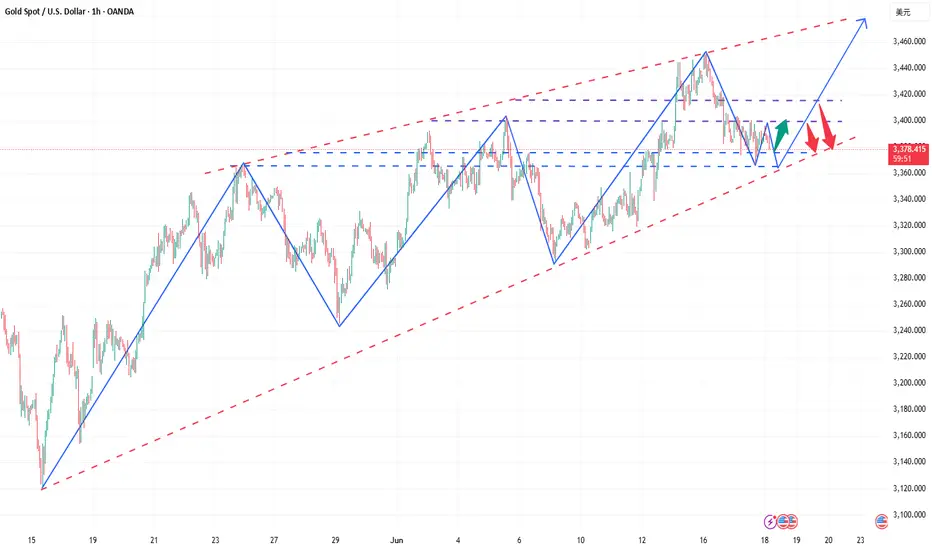
Continue to try to short gold,It's expected to touch 3355-3345 Gold has broken through 3380 twice, but recovered quickly, indicating that the bulls still have some defensive power. At present, gold has touched 3400 again; it can be seen that the bulls' potential defense is still good, but it is not enough to support the continued rebound of gold in the short term. Obviously, gold is still under pressure in the 3410-3420 area in the short term. If gold cannot break through this resistance area in the short term, gold may continue to maintain a volatile state and continue to seek strong support downward. Only after gold breaks through the 3410-3420 area, it is expected to continue to rise and touch the area near 3450 again.
When gold tested the support near 3380 several times during the day and tried to break through this area, after gold failed to break through the 3410-3420 area in the short term, I think gold will be more likely to choose a downward direction, or even continue to test the 3355-3345 area. Therefore, for short-term trading, before breaking through the 3410-3420 area, we should not chase gold too much, and we can try to short gold in this area appropriately.

Have you seized the golden opportunity again and again?Today, the strength of gold is very weak. It only rushed up at the opening, and quickly fell below the 3400 mark. Keeping above the key point of 3400, gold continues to be bullish. Now that it has fallen below 3400, the short-term has gone out of the small-level top, and the market is no longer so strong. For our short-term operations, the short-term correction of gold prices focuses on the daily cycle MA5 support, and the weekly MA5 support is long. The rebound focuses on the 3403-3408 resistance card. The rebound can be followed by the short-term! Although gold has fallen below 3400, the short-term direction has changed, but the general direction has not changed. It is still bullish. In the future, we still have the opportunity to look at the high point of 3500, but we have to wait for the bottom to stabilize. Now we can only follow the trend. We will do what the market does.
From a technical point of view, the current macd high dead cross in 4 hours has a large volume, and the smart indicator sto is oversold, which represents the 4-hour shock trend. The current bollinger band three-track shrinkage in 4 hours also represents the range compression. At present, the upper pressure of 4 hours is located at the adhesion point of the middle rail and the moving average MA10 at 3404-3409, while the support corresponds to the moving average MA30 and MA10 near the 3380-3363 line. From the current 4 hours, if the price is to fall directly, the rebound will not exceed the 3420-3422.5 line. The current macd dead cross of the gold 1-hour line is shrinking and sticking, and the smart indicator sto is running downward, indicating that the hourly line continues to fluctuate weakly. What we need to pay attention to now is the adhesion pressure of the upper moving average MA60 and MA30 corresponding to the 3412 line. Pay attention to the resistance of 3403 in the short term. Today's short-term operation of gold recommends rebound shorting as the main, and callback long as the auxiliary, and pay attention to the support of 3380-3370 in the short term.

Continue to be bullish after successful adjustment of low longToday, gold opened high at 3448, and fell under pressure after touching 3452. It fell after repeatedly confirming resistance at high levels. We arranged short orders in the 3445-3450 area, successfully touched the target of 3330, and realized profit-taking. Then the market fell back to around 3409 and stabilized and rebounded. We arranged long orders and stopped profit at around 3420. Then we fell back and arranged long orders of 3385 and 3395 to take profits at 3405.
Overall, gold fell slowly after opening high, and maintained sideways consolidation in the European session. The US session continued to fall due to the easing of the geopolitical situation. At present, the focus of the evening is on the support of 3390. If it does not break after the retracement, it can still go long. Pay attention to the key pressure levels of 3410 and 3422 above. The current market is still in the adjustment stage of the upward trend. After the adjustment, it is expected to continue the upward rhythm.
Operation suggestion: Go long on gold when it falls back to around 3390-3392, with the target at 3410 and 3435.
If you still lack direction in gold trading, you might as well try to follow my pace. The strategy is open and transparent, and the execution logic is clear and definite, which may bring new breakthroughs to your trading. The real value does not rely on verbal promises, but is verified by the market and time.

GC - Gold digging for a possible ShortAfter reaching WL2, we saw a sharp pullback followed by an immediate double top. Price failed to reach the centerline of the yellow fork, instead stalling at the 1/4 line.
Then came the break of the lower median line (L-MLH), a pullback to the white WL1—then the drop began.
If this market can’t push to new highs, we’ll likely fall back into the median line set. A pullback to the upper median line (U-MLH), as indicated by the red arrows, is a probable scenario.
Next stop: the white centerline.
I trade tiny. I trade with extremely high risk-reward setups. I’m fine getting stopped out all the time —because I’m hunting huge moves.
I don’t chase. No FOMO.
It’s how I sleep well, make money from trading and keep my stress level very low.

Insist on shorting gold on ralliesToday we made a total profit of 350 pips in 2 short trades. First, we shorted gold near 3345, and when gold fell to around 3330, we manually closed the order to lock in profits; the second time, gold rebounded sharply with the help of CPI data, and we seized the opportunity to short gold again near 3360, and ended the transaction by hitting TP: 3340. We accurately grasped the profit of gold shorting.
At present, gold is in a narrow range of fluctuations near the 3330 mark. Relatively speaking, gold is still in a weak position. Although gold has rebounded sharply with the help of the positive CPI data, it has shown a long upper shadow in the candle chart due to the rapid retracement, which has strengthened the resistance above and limited the rebound space of gold in the short term. In addition, the morphological structure shows signs of building a head and shoulders top structure. The resistance area in the short term is 3345-3355; followed by 3360-3370. Although gold is currently in a narrow range of fluctuations near the 3330 mark, it does not show obvious signs of support. It is easy to fall below the area near 3330 in a weak situation. The relatively strong support is in the 3320-3310 area, followed by the area near 3300-3290.
So for short-term trading, I still advocate taking the 3345-3355 area as resistance first and continue to short gold!

Gold/XAUUSD Move 9th June 2025🔍 XAUUSD Analysis – June 10, 2025
Market Structure:
Market remains in a bearish sequence, with lower highs and lower lows intact on the HTF.
The current bullish leg is corrective, retracing into a well-defined supply zone at 3333–3338.
This zone previously triggered strong selling pressure, marking institutional activity.
Key Supply Zone:
3333–3338: Strong supply zone aligning with previous bearish OB and unmitigated FVG.
Expecting a liquidity grab above intra-day highs, followed by rejection from this zone.
Invalidation Level:
If price closes above 3340 with strength (especially on M15/H1), the bearish bias is invalidated, and we may shift toward the upper supply zone around 3375–3380.
Target Zone:
3295–3305: Strong demand area from which the last impulsive move originated.
Also a logical draw for liquidity resting below prior lows.
💼 Trade Idea:
Type: Sell Limit
Entry Zone: 3333–3338
Stop Loss: Above 3344 (structure break buffer)
Take Profit 1: 3310
Take Profit 2: 3300
Risk-to-Reward: ~1:2+
🧠 Execution Plan:
Wait for price to enter the 3333–3338 supply zone.
Look for LTF confirmations: bearish engulfing, BOS, or CHoCH (M1/M5).
Enter short on confirmation with SL above zone and scale out at each TP level.
GOLD - XAUUSD Long term analysisHello Traders,
Gold is again in a range creating upside wedge. I will be looking for sells to buy from 3280.
On lower time frames (1h) Looks bearish
15m Short term bullish
Let's see how it plays out.
Good luck!

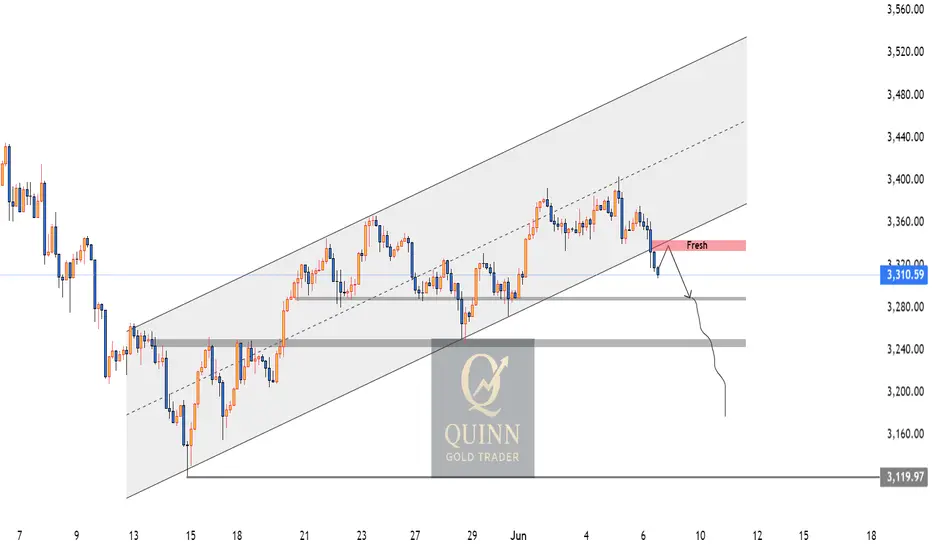
Weekly IDEA on Gold/XAUUSD 9-13 June 2025Technical Confluences:
Bearish FVG:
Fresh Fair Value Gap formed due to aggressive sell-off.
FVG = supply zone, acting as magnet for liquidity + rejection
Broken Channel Retest:
Price fell below the ascending channel
Now retesting the channel, a classic structure behavior before continuation.
Liquidity Below:
Clear clean lows visible around $3,290 → $3,250 → $3,120.
These levels could serve as liquidity targets for institutional movement
Rejection Candlestick Anticipated:
If a strong rejection candle (e.g., bearish engulfing / wick trap) forms inside FVG, entry confidence increases.
📌 Trade Idea (Signal)
Sell Limit Idea
Entry Zone: $3,332 – $3,344
SL: $3,355 (above FVG and channel invalidation)
TP1: $3,290
TP2: $3,250
TP3: $3,120
RR: Approx. 3R+
❗ Alternate Bullish Scenario:
If price reclaims and closes back inside the channel (above $3,355):
The current bearish setup is invalidated.
Bullish momentum could resume with possible push toward $3,400 → $3,445.
🧠 Final Thoughts:
This is a classic SMC + market structure confluence.
Wait for rejection confirmation inside the FVG for higher probability.
Avoid chasing the move — precision entry at supply is key.
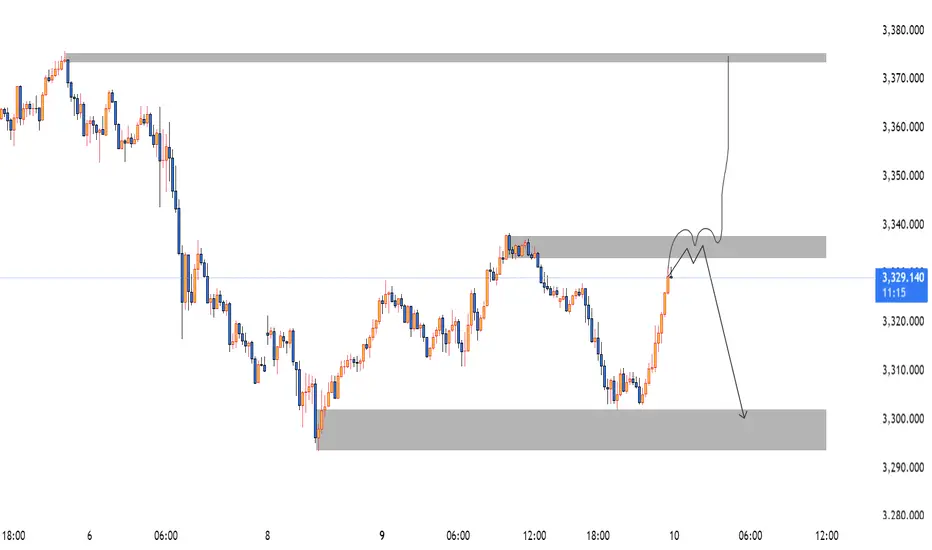
Gold XAUUSD Possible Move 9th June 2025Market Structure:
The overall trend remains bearish, with a series of lower highs and lower lows.
Recent bullish retracement is corrective and approaching a key supply zone (3340 region).
Zones of Interest:
Supply Zone (Sell Area): 3335–3340
This area acted as a previous area of institutional selling. Price is expected to tap into this zone before resuming the downward move.
Demand Zone (Target): 3295–3305
This level served as a previous strong demand zone and aligns with previous reaction zones.
Liquidity & Structure:
Liquidity grab expected above minor highs around 3330–3335 before a potential reversal.
Structure shows a liquidity sweep, followed by a market shift confirming the bearish move.
Key Confluences:
Bearish market structure
Return to supply
Clear risk-to-reward setup
Anticipated lower high formation
Clean FVG + OB alignment in supply zone
📉 Trade Idea / Signal
Type: Sell Limit
Entry: 3335–3340
Stop Loss: 3355 (above supply zone highs)
Take Profit: 3320
Take Profit: 3300
Risk–Reward: ~1:3
🧠 Trade Plan
Wait for price to enter 3335–3340 zone.
Look for confirmation (e.g., bearish engulfing, BOS, CHoCH on LTF).
Execute short with SL above the zone.
Target the 3300 handle which aligns with the HTF demand zone and price imbalance fill.

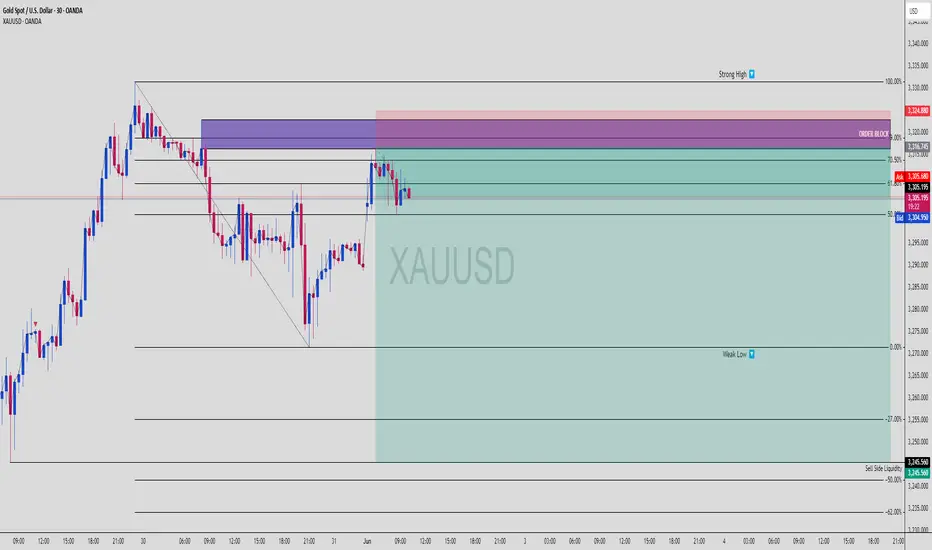
XAUUSD Gold Short: Premium Tap Into OB + Reversal Loading XAUUSD (30-Min) | Premium Rejection + Order Block + Fib Stack for Intraday Short
This GOLD setup is a surgical-grade short play — combining institutional Order Block, Fibonacci Premium Levels, and liquidity rejection for a high RRR sniper entry.
🔍 Smart Money Setup Breakdown:
🔴 Bearish Order Block Zone (OB)
Strong bearish engulfing forms OB between 3,312.949 and 3,319.292
Price is currently reacting off 70.5% – 79% Fib zone — a premium region
Bears defending aggressively as price fails to break above
📐 Fibonacci Confluence
Fib drawn from recent swing high to swing low
Price retraced cleanly into 70.5% – 100% range
Current rejection forming just under 79% Fib at 3,312.949
OB + Fib = sniper confluence
📉 Bearish Reversal Behavior
Candle structure shows bullish exhaustion
Wicks into premium followed by strong rejections
Upcoming bearish candle could confirm shift in momentum
🎯 Target Zones Based on Fib Extensions
50%: 3,306.000
0% (Full move): 3,293.500
Extended TP: 3,288.000 for deeper draw
🧠 Chart Ninja Entry Plan:
🔹 Entry Zone 3,311.510 – 3,312.949 (OB + Premium zone)
🔻 SL Above 3,319.292 (above 100% + OB high)
📉 TP 1 3,306.000 (mid move)
📉 TP 2 3,293.500 (measured move)
⚖️ RRR Estimated 1:4+ depending on execution precision
🧠 Chart Ninja Wisdom:
"Gold respects the money, not the noise. If you know where Smart Money hides,
you’ll always catch the move before the herd even blinks." 🥷✨
🔁 Bonus Insight:
You can clearly see the liquidity engineered below 3,308 and resting near 3,293.5. Price may wick these areas fast, so set alerts or stagger TPs if you’re managing this intraday.
🚨 Chart this setup and watch for the breakdown confirmation
💬 What’s your SL placement for this? Drop it in the comments

Gold XAUUSD Short 5th May 2025Price is approaching a strong supply zone at 3384–3386, where we’ve previously seen aggressive selling. If we get clear signs of rejection from this level (e.g., wicks, bearish engulfing, or failure to break above), I’ll be looking to enter short positions.
The structure shows a potential lower high forming, and if confirmed, we could see continuation to the downside toward recent support levels.
📉 Trade Signal
Bias: Sell
Entry Zone: 3384–3386 (on rejection)
Stop Loss: Above 3395
Take Profit Levels:
– TP1: 3370
– TP2: 3360
– TP3: 3345
⚠️ Note: Trade only if rejection is confirmed in the zone (e.g., bearish PA or failed breakout on 5m–15m).

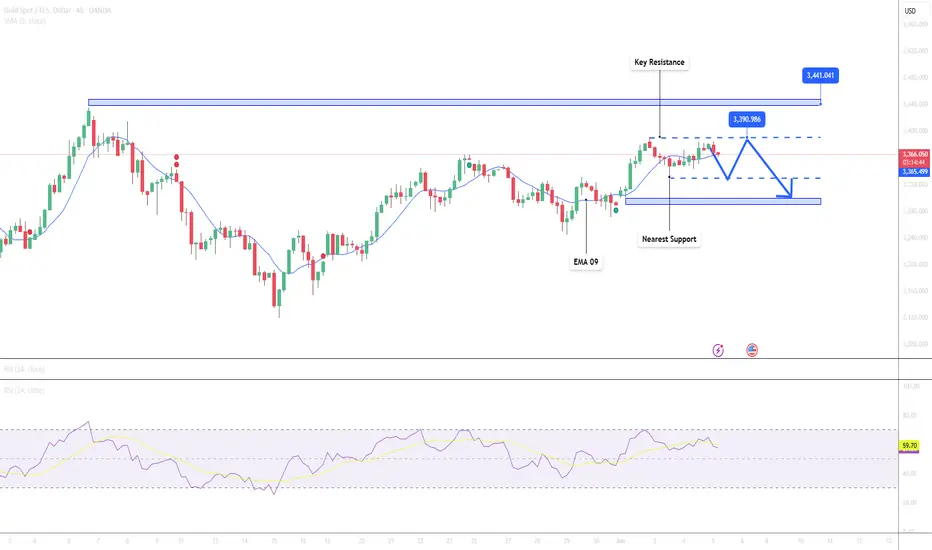
Gold Approaches Key Resistance – Minor Pullback Possible📊 Market Overview:
Gold prices continue their upward momentum and have now reached $3,367/oz, as markets await the upcoming U.S. Nonfarm Payrolls (NFP) report later this week. The U.S. dollar is slightly weaker and Treasury yields are stable, helping gold maintain its strength. However, mixed forecasts from major financial institutions are creating psychological pressure on investors.
📉 Technical Analysis:
• Key Resistance: $3,390 – $3,440
• Nearest Support: $3,330 – $3,300
• EMA: Price remains above both EMA 50 and EMA 9 → indicating a sustained uptrend.
• RSI (H4): Near 66 → not overbought yet, but limited room for further upside.
• Candle pattern: Recent H1 candles show long upper wicks → signaling profit-taking at higher levels.
📌 Outlook:
Gold may face a minor short-term correction if it fails to break above the $3,390 resistance area, especially as the upcoming U.S. jobs report could potentially strengthen the U.S. dollar.
💡 Suggested Trading Strategy:
SELL XAU/USD at: $3,375 – $3,390
🎯 TP: $3,355
❌ SL: $3,405
BUY XAU/USD at: $3,345 – $3,330
🎯 TP: $3,365
❌ SL: $3,315
XAUUSD | Premium Zone Hit – Is Gold Ready to Nuke?XAUUSD | 30-Min Bearish Setup – OB Tap + Liquidity Engineering
Let’s break this down ninja-style ⚔️
📌 1. Market Context:
Gold has retraced into a premium pricing zone after a significant sell-off and is now:
Respecting a refined bearish Order Block
Sitting at 61.8–70.5% Fibonacci retracement (textbook premium)
Below a strong high (liquidity magnet)
This is classic smart money engineering:
➡️ Pull back
➡️ Lure in breakout buyers
➡️ Raid the high
➡️ Dump toward liquidity
🧠 2. Key Levels:
📈 Strong High: 3,324.880
🟪 Order Block Zone: ~3,316.745 to 3,324.880
🔻 Current Price: ~3,307.000
🔵 Weak Low: 3,270.000
🩸 Sell Side Liquidity: 3,245.560
We’re watching for a possible rejection from the OB and a drive down into the Sell Side Liquidity zone.
📊 3. Entry Plan (Confirmation-Based):
Wait for a bearish M5–M15 BOS from OB
Look for FVG entry or last mitigation
Target weak low & SSL
Maintain 1:2 to 1:4 RRR depending on entry precision
Ideal RR Target:
🎯 TP: 3,245.560
🛑 SL: Just above 3,324.880
🔁 RR ~ 1:3+
📉 4. SMC Story:
🧩 Price swept internal liquidity and tapped into premium zone
🔍 OB + Fib confluence = high-probability reaction area
🧲 Weak low is unprotected = juicy target for sell-off
🤖 This move could create displacement and fuel next bearish leg
Smart Money is looking to trap late longs before hitting the liquidity pool.
🎯 5. Bonus Tip:
If you’re on M1 or M5, scale into partials as the move confirms via:
Bearish engulfing
BOS + FVG combo
Lower timeframe mitigation plays
Stay reactive, not predictive. Let the market confirm the trap. ⚠️
💬 Drop “Gold Trap Setup 👑” in the comments if you see the same thing
🔁 Save this to track the next move
🎯 Follow @ChartNinjas88 for daily sniper setups!
XAU/USD) Bearish trand analysis Read The ChaptianSMC trading point update
Technical analysis of XAU/USD (Gold Spot) on the 1-hour timeframe, based on Smart Money Concepts (SMC). Here's a breakdown of the idea and trading scenario:
---
Overall Idea: Bearish Continuation
---
Market Context
Current Price: $3,291.99
EMA 200: $3,297.69 (acting as dynamic resistance)
Trend: Price is within a descending channel, respecting both downtrend and uptrend lines
Directional Bias: Bearish unless a breakout occurs
---
Key Zones
1. Resistance Level (Sell Zone)
Around $3,320–$3,340
Price rejected this level multiple times → strong supply zone
2. FVG Level (Fair Value Gap)
Around $3,305–$3,315
Price tapped this area and showed rejection
Identified as a "seller zone" – price likely filled imbalance and now resuming trend
---
Projected Move
Price is expected to:
1. Reject EMA and FVG zone
2. Continue downward movement
3. Target support around $3,244.95
---
Indicators
EMA 200: Above price → bearish pressure
RSI (14): ~46.78 → no extreme reading, but leans bearish; room for further downside
---
Trade Idea Summary
Bias: Bearish
Sell Entry: ~$3,300–$3,310 (already triggered)
Stop Loss: Above $3,320
Target: $3,244.95 (demand zone / previous low)
Risk/Reward: Favorable (~1:2+)
Mr SMC Trading point
---
Warnings
Multiple economic event icons are marked (bottom of chart) → potential high volatility, especially around NFP/FOMC-related news
---
pales support boost 🚀 analysis follow)

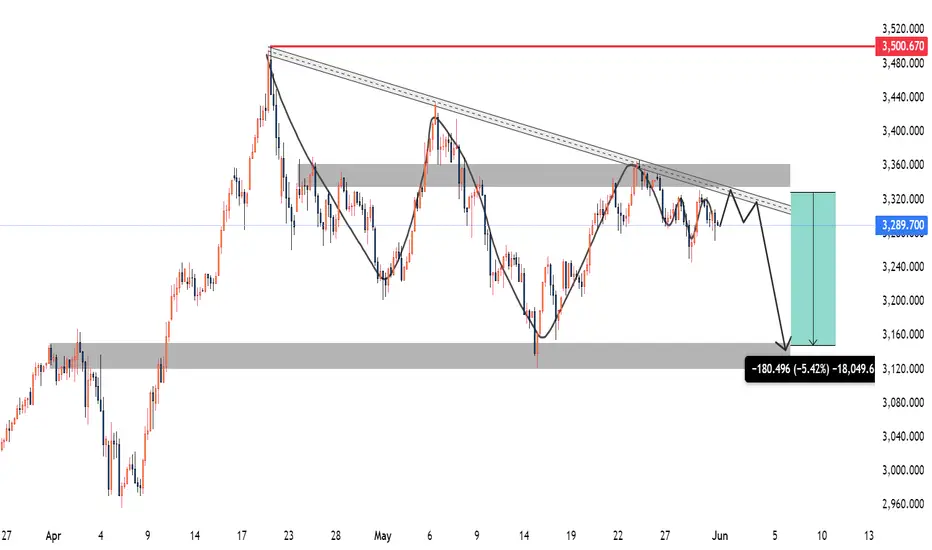
Gold XAUUSD Weekly forecast 2-6 June 2025Observations:
Price has been respecting a clear descending trendline since late April, with multiple touches and rejections.
A significant supply zone around the 3,330 level aligns with the trendline resistance, increasing confluence for a potential reversal.
The market has formed lower highs consistently, suggesting bearish pressure is building up.
A horizontal demand/support level around 3,125 (previous swing low) is the primary target in case of a bearish breakout.
Volume and structure suggest distribution, further supporting bearish continuation.
Bearish Scenario:
If the price retests and rejects the 3,330 resistance level again next week, especially with a wick rejection or bearish engulfing candle:
Expect downside continuation toward 3,125, aligning with a ~1500 pip target.
This move would represent a ~5% drop from current levels.
Trading Plan / Signal:
Sell Setup:
Entry Zone: Between 3,320 – 3,330 (upon bearish confirmation e.g., bearish engulfing or shooting star)
Stop Loss: Above 3,350 (just above trendline and invalidation zone)
Take Profit 1 (TP1): 3,250
Take Profit 2 (TP2): 3,200
Take Profit 3 (TP3): 3,150/25
Risk–Reward Ratio: Approximately 1:3+
Invalidation:
Clean breakout and retest above 3,350 would invalidate the setup and may suggest a reversal toward 3,500.
Fundamental Consideration:
No major geopolitical or macroeconomic shocks should occur to maintain this bearish bias. Any high-impact news could cause volatility, so monitor the economic calendar closely.
Please follow, like, comment and share.
Gold Declines as PCE Inflation Data Cools📊 Market Overview:
Gold is currently trading around $3,289/oz, down from the day's high of $3,322. This decline follows the U.S. PCE inflation data showing a 2.1% annual increase in April, below the forecast of 2.2% and March's 2.3%. Core PCE also rose 0.1% monthly and 2.5% annually, the lowest since early 2021.
📉 Technical Analysis:
• Key Resistance: $3,310 – $3,330
• Nearest Support: $3,270
• EMA: Price is currently below the 09 EMA, indicating a short-term downtrend.
• RSI Indicator: The RSI is declining, signaling increasing selling pressure.
• Candlestick Pattern: A bearish candlestick pattern has formed after failing to break above the $3,330 resistance zone.
📌 Outlook:
If gold fails to hold the $3,270 support level, it may continue to decline towards $3,250. However, maintaining above $3,270 could see a rebound towards the $3,300 – $3,310 range.
💡Suggested Trade Strategy:
SELL XAU/USD at: $3,310 – $3,315
🎯 TP: $3,290
❌ SL: $3,320
BUY XAU/USD at: $3,270
🎯 TP: $3,290
❌ SL: $3,260

Trade Idea:XAUUSD SHORT ( SELL STOP )🔍 Multi-Timeframe Analysis
📉 H4:
• Price is compressing below the 20 and 50 SMAs.
• Recent attempts to break higher failed to sustain; MACD is slightly bearish, hinting momentum is fading.
• Consolidation after the big push suggests potential for another leg down if support breaks.
🕒 M15:
• Strong bounce into resistance, now stalling at the underside of the previous structure (~3315–3320).
• 20 SMA is curling down and converging with the 50 SMA, signaling a potential momentum shift.
🕒 M3:
• Price just lost short-term bullish structure after failing to break 3318.
• Flattening and slight downward curl in the 20 SMA.
• Volume shows a slowdown on the bounce and heavier selling earlier in the day — signs of weakness.
⸻
✅ Trade Idea
Type: Sell Stop
Entry: 3308
Stop Loss: 3322
Take Profit: 3273
———
🧠 Why This Setup Works
• This is a momentum breakdown trade: placing a sell stop just below short-term support (3308) to catch the shift in momentum if price breaks lower.
• Price already rejected the high around 3318; if it pushes below 3308, it confirms that sellers have taken back control.
• There’s clean room down to 3273 — a previous reaction zone and recent demand level — offering a good risk-to-reward.
⸻
🛡️ Risk Management & Execution
• SL to BE Rule: Move stop loss to break-even once price reaches 3293 (15 points in your favor, 1R). That’s the halfway point to target and right above a small reaction zone that could cause a pullback.
• Invalidation Window: If price moves above 3325 before activating entry, cancel the trade idea. That would invalidate the lower-high structure and suggest momentum has shifted bullish again.
⸻
⏱️ Session Timing & Considerations
• NY session opens at 6:30 AM Pacific (PT).
• Ideally, this trade should activate and move by pre-New York to early NY session. If price stalls or consolidates near the entry level for too long into the session (after 9:30–10:00 AM PT), consider canceling or reassessing.
FUSIONMARKETS:XAUUSD

XAUUSD Bearish Signal | Technical + Custom AlgoSmart Trend Signal | Technical Analysis + Custom Algorithm
This signal is the result of a combination of classic technical trend analysis and a proprietary software I personally developed.

XAUUSD Bearish Signal | Technical + Custom AlgoSmart Trend Signal | Technical Analysis + Custom Algorithm
This signal is the result of a combination of classic technical trend analysis and a proprietary software I personally developed.

XAUUSD SHORTThis chart appears to be a technical analysis setup for **Gold (XAU/USD)** on the **15-minute timeframe**, using **Heikin Ashi candles**.
Here's a breakdown of what’s visible:
### **1. Price Action:**
* The chart is trading within a **descending channel** (highlighted by the dotted white trendlines).
* **Resistance levels** are marked at:
* 3366.015
* 3331.470
* **Support zone** around: 3245.560
* The price is currently around **3291.690**, testing the lower region of a recent consolidation zone or distribution area.
### **2. Indicators:**
#### a. **RSI (Middle Panel):**
* RSI is around **41.552**, suggesting mild bearish momentum but not yet oversold.
* RSI is not giving a strong divergence signal at this moment.
#### b. **MACD or Custom Oscillator (Bottom Panel):**
* Appears to be a custom oscillator with histogram + signal cross system.
* Red and green dots possibly indicate buy/sell signals.
* Currently showing **bearish pressure** as histogram and signal lines are below zero with red dots (sell signal confirmation).
### **3. Trade Setup:**
* The red and green box overlay suggests an **active short trade** setup:
* Entry near **3291.690**
* Stop-loss zone near **3331–3335**
* Take-profit zone extending well below **3245**, likely near **3188.498–3189.980**
### **4. Signal Arrows (Blue Up / Red Down):**
* These are likely part of an indicator marking **swing highs/lows or reversal points**.
* More red arrows recently suggest bearish short-term sentiment.
---
### 🧠 **Interpretation:**
* The chart shows a **bearish bias** with a short position in play.
* Price is within a downward channel and rejected the resistance area.
* Oscillators and RSI support further downside unless a strong reversal occurs.

XAU/USD on the 45-minute timeframeSupport Zone Rejection (around 3,250 USD):
Price sharply reversed after testing a key support area (highlighted with a circle).
Volume increased at the reversal point, signaling strong buyer interest.
Break Above Minor Resistance (~3,280 USD):
Price has broken above the immediate resistance level with strong bullish momentum.
A bullish candle has closed above this zone, indicating a potential continuation.
Next Target Resistance Zones:
First Target: Around 3,320 USD, which aligns with a previous structural high and supply zone.
Final Target: Around 3,345–3,350 USD, representing a major resistance zone and previous swing high.
Trade Plan:
Entry: Above 3,280 (already in motion).
Target 1: 3,320
Target 2: 3,345–3,350
Stop Loss: Below 3,260 (below recent low and support zone)
Bullish Structure:
Higher low has been established.
Momentum is supported by volume confirmation
