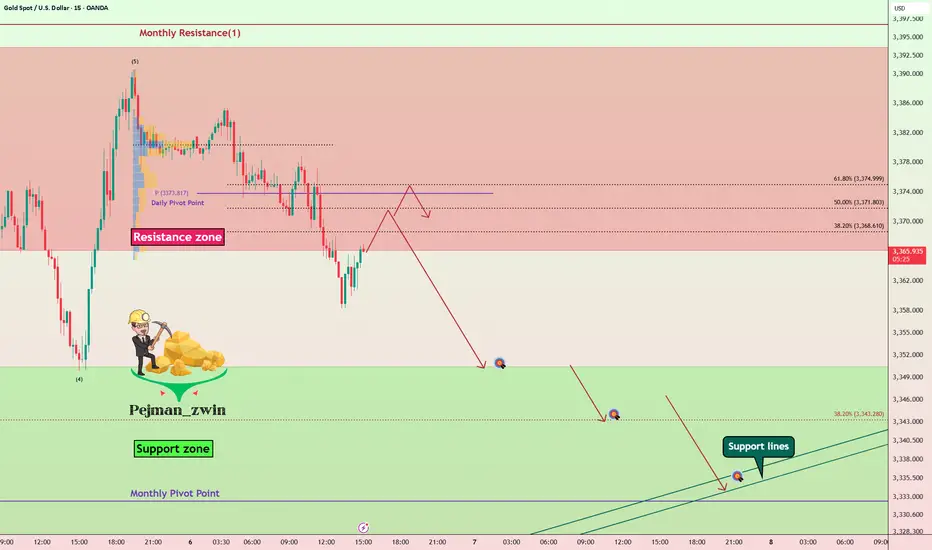
Gold Roadmap — Short termGold ( OANDA:XAUUSD ) rose to $3,383 as I expected in yesterday's idea .
Gold is currently moving in the Resistance zone($3,393-$3,366) .
In terms of Elliott Wave theory , it seems that Gold has completed 5 impulse waves , and we should wait for corrective waves on the 15-minute time frame .
I expect Gold to start declining from one of the Fibonacci levels and fall to at least $3,351 .
Second Target: $3,344
Third Target: Monthly Pivot Point/Support lines
Note: Stop Loss (SL) = $3,392
Gold Analyze (XAUUSD), 15-minute time frame.
Be sure to follow the updated ideas.
Do not forget to put a Stop loss for your positions (For every position you want to open).
Please follow your strategy; this is just my idea, and I will gladly see your ideas in this post.
Please do not forget the ✅ ' like ' ✅ button 🙏😊 & Share it with your friends; thanks, and Trade safe.
Goldsignal
DeGRAM | GOLD around the lower boundary of the channel📊 Technical Analysis
● XAUUSD bounced off the rising channel base at 3,280 and reclaimed the mid-range of the 3,294–3,435 consolidation zone, carving out a higher low pattern.
● The price is compressing into the descending resistance, with a break above 3,400 confirming upside extension toward 3,435 and 3,500.
💡 Fundamental Analysis
● Gold demand stays firm as investors hedge against US fiscal concerns after Fitch’s downgrade, while real yields ease on softer employment revisions.
✨ Summary
Buy above 3,310; break >3,400 targets 3,435 → 3,500. Setup invalid below 3,280.
-------------------
Share your opinion in the comments and support the idea with a like. Thanks for your support!

Opportunities only come to those who are preparedThe market expects the probability of the Federal Reserve cutting interest rates in September to be over 70%, with some institutions even predicting as high as 93.6%. Fed officials have recently released dovish remarks. If the rate cut is implemented, it will reduce the opportunity cost of holding gold, which is good for gold prices. The US has imposed tariffs on India and Switzerland, exacerbating global trade tensions and boosting demand for gold as a safe haven. The deadlock in the Iran nuclear talks and the shipping risks in the Red Sea have increased market risk aversion. Focus is on US initial jobless claims data and speeches by Fed officials. If the data is stronger than expected, it may suppress expectations of a rate cut and be bearish for gold. If the US dollar strengthens or geopolitical risks ease, gold prices may come under pressure and fall. Today, gold mainly showed a high-level fluctuation trend, hitting a high of $3397.25/oz in European trading before falling sharply. It is currently trading around $3382. Although gold prices are still in an upward channel, they have recently shown a high sideways trend. The market lacks unilateral driving factors. Gold can be shorted at high levels. It is recommended to short gold in batches around the highs of 3390-3405.

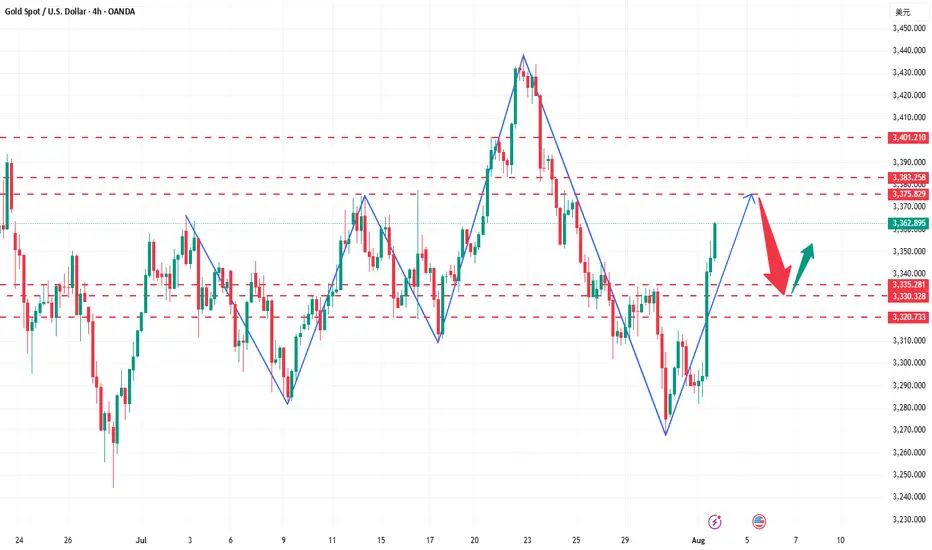
Gold Bounces from PRZ — Is a Short-Term Rally Underway?Gold ( OANDA:XAUUSD ) started to rise from the Support zone($3,307-$3,275) as I expected in the previous idea .
Gold is currently moving near the Support zone($3,350-$3,326) , Potential Reversal Zone(PRZ) , and $3,334 (Important price) .
From the Elliott wave theory , it seems that Gold has completed its 5 impulsive waves and now we should wait for corrective waves . Corrective waves can complete at the Potential Reversal Zone(PRZ) .
I expect Gold to rise to $3,383(at least) in the coming hours .
Second Target: $3,396
Note: Stop Loss (SL) = $3,321
Gold Analyze (XAUUSD), 1-hour time frame.
Be sure to follow the updated ideas.
Do not forget to put a Stop loss for your positions (For every position you want to open).
Please follow your strategy; this is just my idea, and I will gladly see your ideas in this post.
Please do not forget the ✅ ' like ' ✅ button 🙏😊 & Share it with your friends; thanks, and Trade safe.

DeGRAM | GOLD above the descending channel📊 Technical Analysis
● XAUUSD broke above the descending channel and confirmed a breakout from a narrowing wedge near 3,382, signaling bullish continuation.
● The price structure now targets the 3,435 resistance, with pullbacks likely to retest the breakout zone before the next leg higher.
💡 Fundamental Analysis
● Gold is supported by renewed safe-haven demand after geopolitical tensions in the Middle East and weaker-than-expected US ISM services data, which pressured the USD.
✨ Summary
Buy above 3,382; target 3,435. Setup remains valid while holding above 3,360.
-------------------
Share your opinion in the comments and support the idea with a like. Thanks for your support!

What does it matter if every step is just right?Today's gold fluctuation rhythm is basically consistent with our prediction. The rhythm from entry to profit-taking is clear, and the strategy is executed decisively. First, we decisively arranged long orders at the 3365-3370 line, and successfully took profit at the target line 3375, earning 150pips of profit. Then we decisively reversed and arranged short orders at 3375. The market fell back to around 3360 as expected, and realized 150pips of profit again. In the third round of operations, long orders were entered again near 3352, and the price rose smoothly to 3370 to take profit again. The overall rhythm was tight and profits were steadily pocketed. At present, gold has rebounded to around 3380-3385. We have deployed a new round of short orders in advance and will wait for the price to drop before arranging long orders. Overall, gold is in a volatile rhythm. Even if there is still room for upward movement in the future, it is likely to undergo a round of technical retracement adjustments first.
Gold Traders Pay Attention! Major Moves Incoming ? XAU/USD is setting up for a monster move — and all the signs are lining up! 👇
This is a perfect storm of technical confluence you don’t want to miss:
📊 After weeks of consolidation, gold has just broken out of a downtrend, retested the zone, and is now sitting on a major decision point. This zone is packed with:
✅ A dynamic trendline flip (was resistance, now acting as support)
✅ 200 EMA cushioning the retest
✅ 50% Fibonacci retracement aligning perfectly
✅ High-volume node from the volume profile = big player interest
✅ Mid-Bollinger Band offering bounce potential
✅ Strong bullish market structure forming
All eyes are on this green circle zone— a critical battle between bulls and bears. If bulls win here, we could see a powerful move straight into the upper resistance zone, possibly breaking previous June highs! 🦍💥
This is what smart money setups look like — multiple confirmations, clean structure, and asymmetric reward potential. 🔑📈
Tag a gold trader who needs to see this, and drop a ⚡️ if you're locked in on this breakout setup!
VANTAGE:XAUUSD FOREXCOM:XAUUSD EIGHTCAP:XAUUSD
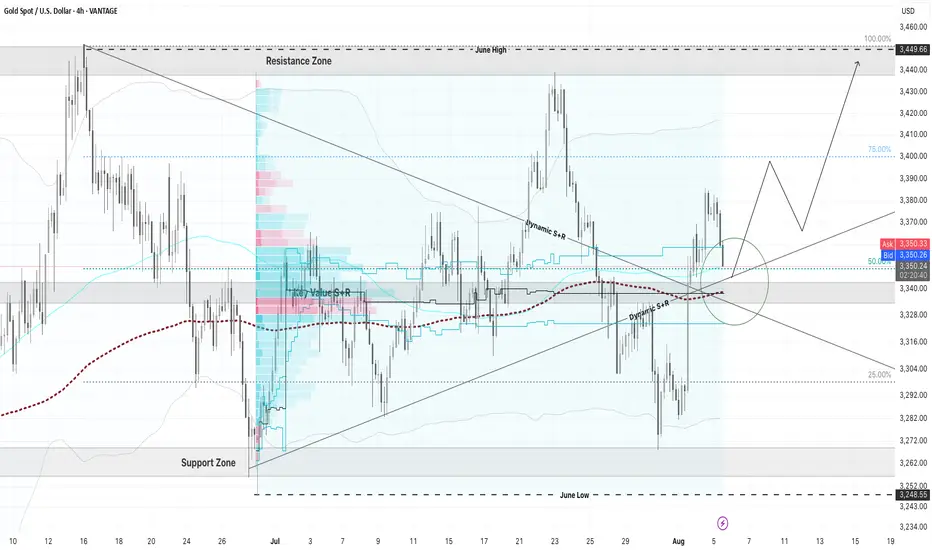
XAUUSD Analysis todayHello traders, this is a complete multiple timeframe analysis of this pair. We see could find significant trading opportunities as per analysis upon price action confirmation we may take this trade. Smash the like button if you find value in this analysis and drop a comment if you have any questions or let me know which pair to cover in my next analysis.

DeGRAM | GOLD reached the resistance level📊 Technical Analysis
● XAUUSD rebounded from the lower channel boundary near 3,294 and reclaimed resistance at 3,357.8, confirming bullish continuation inside the rising structure.
● Breakout above the triangle’s descending resistance line opens upside toward 3,435 and possibly 3,487 on strong momentum continuation.
💡 Fundamental Analysis
● Gold found renewed support as US NFP and ISM data showed softness, weakening the dollar and lowering real yields.
● Rising geopolitical risk and increased central bank gold buying in July continue to support bullish sentiment.
✨ Summary
Long above 3,357. Target 3,435 ➜ 3,487. Setup holds while price stays above 3,294 channel base.
-------------------
Share your opinion in the comments and support the idea with a like. Thanks for your support!

The trend is clear, why do I choose to be firmly bullish on goldGold Trend Analysis: Yesterday, the gold market demonstrated strong upward momentum, opening near 3290 before falling slightly to a low of 3281 before fluctuating upward. Boosted by the non-farm payroll data, the gold market surged during the US trading session, reaching a single-day gain of 2.02%, reaching a high of 3363 and closing there. The daily chart formed a long bullish candlestick with a long lower shadow, forming a Morning Star pattern, reinforcing the bullish trend. From the perspective of the cycle structure, the daily level is clearly in the 5-wave upward stage, and the upward trend of the large cycle has not changed. At the indicator level, the daily MACD momentum column (the column below the zero axis) represents the short-selling momentum. Its "gradual shortening" means that the short-selling force is weakening and the downward momentum is gradually fading. It is a potential signal of stopping the decline or rebounding. KDJ is about to form a golden cross between 20-50, which is a signal that short-term bullish power is beginning to increase, and the overall trend is bullish.
The 4-hour level shows typical bullish characteristics: the moving average system is arranged in a bullish pattern, but there is a certain deviation between the short-term price and the moving average. The technical side needs to correct the deviation rate through a callback before continuing to rise. The short-term support below is focused on the line near 3330-3335. This position is both the relay support level in the previous rise and the intersection of the 4-hour moving averages MA10 and MA20, which has strong support strength; the short-term resistance above is focused on the line near 3370-3383. This area is a pressure-intensive area near the previous high point. If it can be effectively broken through, it will further open up upward space. A successful breakout would open up further upside potential. A breakout would further open up the 3400 mark.
For gold trading, the short-term strategy is to buy on dips. If the price pulls back to the 3330-3335 support level, consider entering a long position with a target of 3355-3365. If it reaches 3370-3380, consider a short-term short position with a target of 3350-3340.
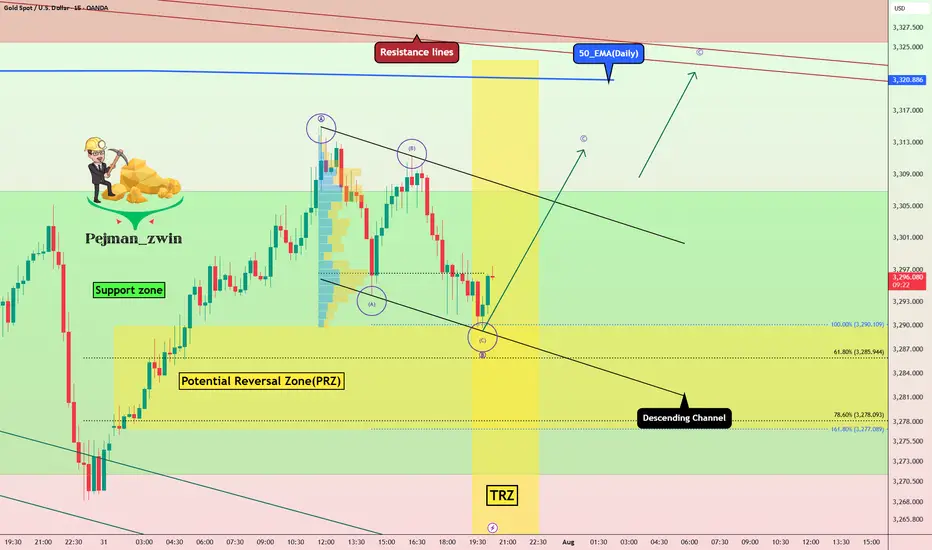
Gold in PRZ + TRZ: Is a Bullish Reversal Brewing(Short-term)?Gold , as I expected in yesterday's idea , fell to the Potential Reversal Zone(PRZ) and started to rise again .
Today's Gold analysis is on the 15-minute time frame and is considered short-term , so please pay attention .
Gold is currently trading in the Support zone($3,307-$3,275) and near the Potential Reversal Zone(PRZ) and Time Reversal Zone(TRZ) .
In terms of Elliott Wave theory , it seems that Gold can complete the microwave C of wave B at the lower line of the descending channel.
I expect Gold to trend higher in the coming hours and rise to at least $3,311 .
Note: Stop Loss (SL) = $3,267
Gold Analyze (XAUUSD), 15-minute time frame.
Be sure to follow the updated ideas.
Do not forget to put a Stop loss for your positions (For every position you want to open).
Please follow your strategy; this is just my idea, and I will gladly see your ideas in this post.
Please do not forget the ✅ ' like ' ✅ button 🙏😊 & Share it with your friends; thanks, and Trade safe.
DeGRAM | GOLD fixed below the triangle📊 Technical Analysis
● XAUUSD is forming a bearish descending wedge within a broader symmetrical triangle, facing rejection at 3,310 near prior support-turned-resistance.
● Repeated failure to hold above trendlines and continued lower highs favor a drop toward the 3,246.56 level, with possible overshoot if support breaks.
💡 Fundamental Analysis
● Rising real yields and hawkish Fed tone continue to pressure gold; ISM Manufacturing Prices and NFP loom as next volatility catalysts.
● Reduced ETF inflows and strong dollar on resilient US macro data weigh on demand for non-yielding assets.
✨ Summary
Short bias below 3,310. Breakdown eyes 3,246 → 3,200 zone. Resistance holds while trendline caps recovery.
-------------------
Share your opinion in the comments and support the idea with a like. Thanks for your support!
Gold Crashing After Hot U.S. Data – More Pain Ahead?Minutes ago, important indices were released from the US , which catalyzed the continuation of gold's downward trend .
Key U.S. Economic Data Just Dropped!
ADP Employment: 104K
GDP q/q: 3.0%
Both came in stronger than expected , signaling that the U.S. economy is holding up better than many thought!
Strong job growth
Solid economic expansion
The result? A stronger U.S. dollar ( TVC:DXY ) and potential downward pressure on Gold .
All eyes are now on FOMC meeting .
Will the Fed still hint at future rate cuts despite the solid data? Or is the easing cycle officially on hold? What is your idea!?
----------------------
Gold ( OANDA:XAUUSD ) has already managed to break the Support zone($3,350-$3,326) , Monthly Pivot Point , 50_EMA(Daily) , Support lines , and the lower line of the ascending channel . Also, Gold trading below $3,333 plays an important role for me, which can increase the possibility of a continuation of the downtrend .
I expect Gold to drop to at least the Potential Reversal Zone(PRZ) before the FOMO meeting and if the Support zone($3,307-$3,272) is broken, we can expect further declines to $3,253(Second Target) .
--------------------------------
Information we need to know:
How should the Federal Funds Rate be announced to cause a deeper drop in Gold ?
The Fed needs to take a hawkish stance — meaning:
They keep rates unchanged, but make it clear they intend to keep them elevated for a prolonged period.
They emphasize strong economic data like today's solid ADP and GDP numbers .
They express concern that inflationary risks remain, and cutting rates isn’t on the table anytime soon.
In this case, markets get disappointed, rate cut hopes fade, and gold drops as real yields( TVC:US10Y ) rise and the U.S. dollar strengthens.
--------------------------------
Note: Stop Loss (SL) = $3,340
Gold Analyze (XAUUSD), 4-hour time frame.
Be sure to follow the updated ideas.
Do not forget to put a Stop loss for your positions (For every position you want to open).
Please follow your strategy; this is just my idea, and I will gladly see your ideas in this post.
Please do not forget the ✅ ' like ' ✅ button 🙏😊 & Share it with your friends; thanks, and Trade safe.

DeGRAM | GOLD reached the $3300 level📊 Technical Analysis
● XAUUSD remains capped below a broken trendline retest near 3,355, while price forms a lower-high inside a descending channel.
● The repeated rejection of the 3,357.83 resistance level, coupled with failed bullish continuation, points to renewed downside toward 3,300 and 3,262.
💡 Fundamental Analysis
● A rebound in the DXY after strong US consumer sentiment and pending home sales adds pressure to gold, reaffirming real-yield strength.
● Traders are reducing long exposure ahead of upcoming NFP data and Powell’s next statement, shifting bias away from risk hedges.
✨ Summary
Short bias below 3,355. Break under 3,320 eyes 3,300 → 3,262. Key breakdown risk if lower trendline fails.
-------------------
Share your opinion in the comments and support the idea with a like. Thanks for your support!

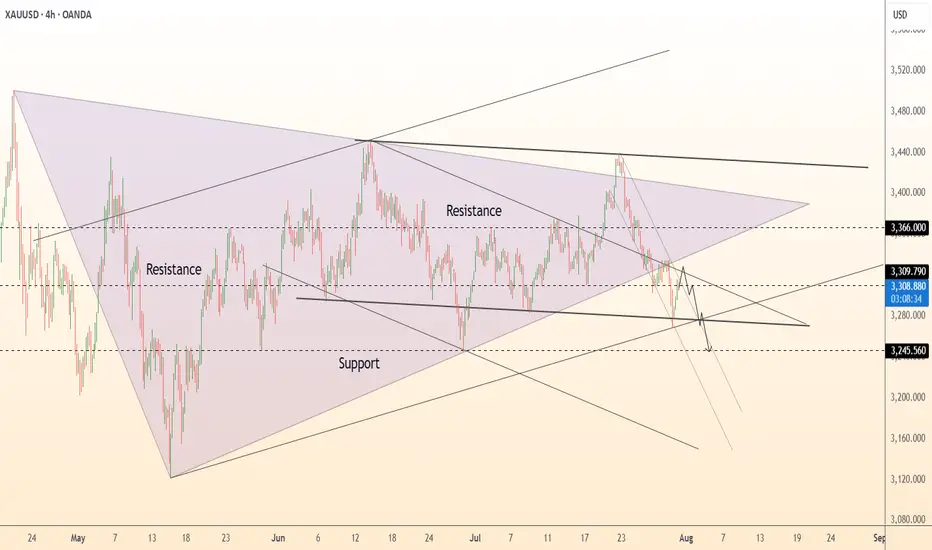
GoldXau usd daily analysis
Time frame 4 hours
Maybe Earthquake in the east of Russia 🇷🇺 makes a revolution in the markets .
I never open a short or long position in this times.
I'm waiting and watching the markets.
I think the grey lines are the reverse point
So I must wait now

XAUUSD idea 29/07/25We are waiting for our asset to reach our action zone, and based on the reaction, we’ll decide on our next moves.ALWAYS WAIT FOR A CONFIRMATION TO SEE IF THE PRICE VALIDATES THE ZONE.and you what is your vision of the EURUSD its interests me! i wait you in the commentary

DeGRAM | GOLD broke the rising channel📊 Technical Analysis
● XAU printed a false break above the 3 400 wedge roof, then sliced back through the rising mid-channel, closing under the wedge base at 3 309 - a classic bull-trap that flips that band into resistance.
● Momentum has rolled over, and the break of July’s micro up-trend opens room to the broad triangle floor/May trend-pivot near 3 246; successive lower-highs since 24 Jul confirm bearish control.
💡 Fundamental Analysis
● Hot US Q2-GDP and sticky core-PCE lifted 2-yr yields to one-month highs, reviving the dollar bid, while cautious ECB guidance tempers euro gold demand.
✨ Summary
Sell 3 309-3 335; hold below 3 309 targets 3 246 ▶ 3 200. Invalidate on an H4 close above 3 366.
-------------------
Share your opinion in the comments and support the idea with a like. Thanks for your support!

Gold Recovery Setup = Divergence + Support ClusterGold ( OANDA:XAUUSD ) fell to the lower line of the ascending channel and the Support zone($3,350-$3,326) , as I expected in my previous idea .
Gold is currently near a set of Supports .
Supports:
Support zone: $3,350-$3,326
Monthly Pivot Point: $3,333
Potential Reversal Zone(PRZ): $3,339-$3,329
Lower line of the ascending Channel
50_EMA(Daily)
Support lines
In terms of Elliott Wave theory , Gold appears to be completing a bearish wave 5 .
Also, we can see the Regular Divergence(RD+) between Consecutive Valleys .
I expect Gold to rise to at least $3,359 .
Second target: $3,367
Note: Stop Loss (SL) = $3,319
Do you think Gold can break the Support cluster by the end of trading hours?
Gold Analyze (XAUUSD), 1-hour time frame.
Be sure to follow the updated ideas.
Do not forget to put a Stop loss for your positions (For every position you want to open).
Please follow your strategy; this is just my idea, and I will gladly see your ideas in this post.
Please do not forget the ✅ ' like ' ✅ button 🙏😊 & Share it with your friends; thanks, and Trade safe.

Gold: $3,348.0 Resistance in Focus for BullsFenzoFx—Gold's decline reached the ascending trendline near $3,314.0. The bullish trend remains intact while price holds above the trendline.
Immediate resistance is $3,348.0, and a close above this level could lift the market toward $3,389.0 and potentially $3,451.0, aligning with recent higher-lows.

DeGRAM | GOLD will retest the channel boundary📊 Technical Analysis
● Fresh rejection at the blue resistance line (~3 435) pushed XAU back to the 3 355 mid-band, yet successive higher-lows (green arrows) keep price inside the May-origin rising channel.
● The pullback is probing 3 328-3 355 — confluence of the former flag roof and triangle top; holding this zone should launch another test of 3 400/3 435, with the channel crest targeting 3 500.
💡 Fundamental Analysis
● U-S S&P-Global PMIs softened, nudging 2-yr real yields to three-week lows, while cautious ECB rhetoric limits dollar gains — both supportive for gold.
✨ Summary
Long 3 328-3 355; above that aims 3 400 ➜ 3 435, stretch 3 500. Invalidate on an H4 close below 3 293.
-------------------
Share your opinion in the comments and support the idea with a like. Thanks for your support!

Gold Fails at Resistance, Elliott Wave Signals Deeper CorrectionGold ( OANDA:XAUUSD ) started to rise after the Richmond Manufacturing Index(Actual:-20/Forecast:-2/Previous-7) index was announced, but failed to break the upper line of the ascending channel and the Resistance zone($3,451-$3,406) .
Gold has now broken through the Support lines and is attempting to break through the next Support lines and Support zone($3,394-$3,366) .
In terms of Elliott Wave theory , it appears that the main wave Y has completed above the ascending channel.
I expect that given the momentum of gold's decline , gold will be able to break the Support zone($3,394-$3,366) and Support lines and fall to at least $3,356 . The next target could be the lower line of the ascending channel .
Note: Stop Loss (SL) = $3,423
Gold Analyze (XAUUSD), 1-hour time frame.
Be sure to follow the updated ideas.
Do not forget to put a Stop loss for your positions (For every position you want to open).
Please follow your strategy; this is just my idea, and I will gladly see your ideas in this post.
Please do not forget the ✅ ' like ' ✅ button 🙏😊 & Share it with your friends; thanks, and Trade safe.

DeGRAM | GOLD above the resistance📊 Technical Analysis
● Five successive rebounds (green arrows) from the 4-month rising‐channel base at 3 293 keep the primary up-trend intact while turning the former wedge roof into support.
● Price is compressing inside a 4-day ascending triangle whose ceiling sits at 3 366; a break projects 1 : 1 to the March top/outer channel rail at 3 435.
💡 Fundamental Analysis
● FXStreet notes bullion ETF holdings rose for a second week as softer US PMI prices dragged 2-yr real yields back to early-July lows, trimming the dollar bid.
✨ Summary
Buy 3 345-3 355; triangle breakout >3 366 opens 3 389 then 3 435. Long bias void on an H4 close below 3 293.
-------------------
Share your opinion in the comments and support the idea with a like. Thanks for your support!

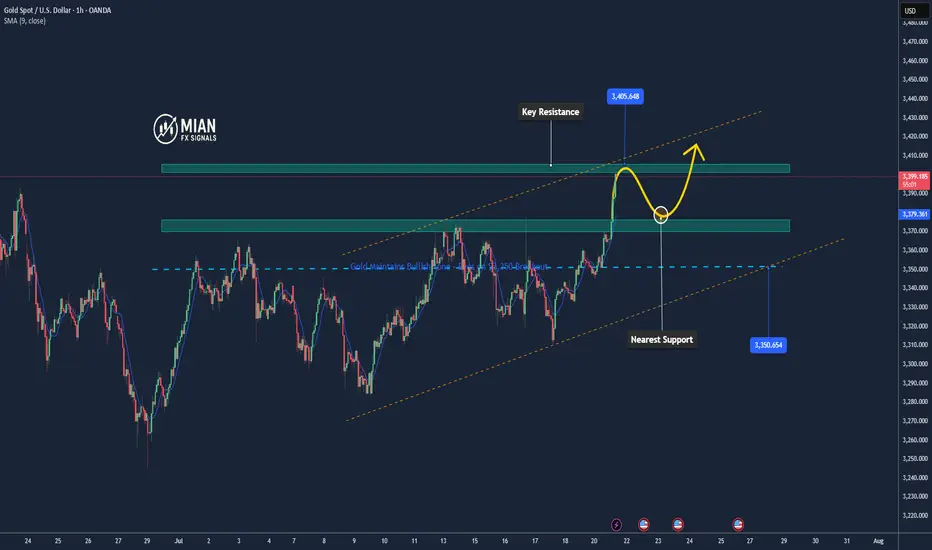
Gold Could Extend Rally if Breaks 3,400📊 Market Overview
Gold is currently trading around 3,400 USD/oz, up approximately +1.41% over the past 24 hours.
The upward momentum is supported by a weakening US Dollar following dovish-leaning remarks from the Fed, along with growing demand for safe-haven assets amid trade uncertainties.
📉 Technical Analysis
• Key Resistance: ~3,400–3,405 USD (psychological zone; a break above could open the path for further gains).
• Nearest Support: ~3,370–3,375 USD, followed by 3,345–3,350 USD, which marks today’s low.
• EMA 09/20: Price is currently trading above both EMA 9 and EMA 20, confirming a short-term uptrend.
• Momentum / Oscillators: RSI is in the overbought zone; MACD and ADX still show a “buy” signal → bullish trend continues, but watch for possible technical pullbacks.
📌 Opinion
The price may continue to rise if it breaks above the 3,400 USD/oz level, especially if the USD remains weak and safe-haven flows continue to support gold. However, if there’s short-term selling pressure or a USD rebound, gold may pull back toward the 3,370–3,375 USD support zone.
💡 Trade Setup
SELL XAU/USD at: 3,400–3,405 USD
🎯 TP: 3,380 USD
❌ SL: 3,410 USD
BUY XAU/USD at: 3,370–3,375 USD
🎯 TP: 3,390–3,395 USD
❌ SL: 3,360 USD