DeGRAM | GOLD under the resistance area📊 Technical Analysis
● Price broke the long-standing rising-channel floor, then formed a clean bear flag inside a fresh down-sloping channel; the flag’s ceiling coincides with the 3 300-3 310 supply band.
● Lower-high sequence and confluence of flag top with former support turned resistance favour continuation toward the mid-channel / fib pivot at 3 246, next 3 180.
💡 Fundamental Analysis
● Friday’s hotter US core-PCE and Fed governor Bowman’s “no cuts in 2025” comment lifted 2-yr yields above 4.80 %, firming the DXY and draining flows from non-yielding gold.
✨ Summary
Sell 3 290-3 305; hold below 3 310 targets 3 246 → 3 180. Short bias void on an H4 close above 3 310.
-------------------
Share your opinion in the comments and support the idea with a like. Thanks for your support!
Goldsignal

DeGRAM | GOLD broke the demand zone📊 Technical Analysis
● Price sliced beneath the long-term rising‐channel base and the triangle apex, turning 3 300-3 310 into fresh supply; the current pull-back is a textbook bearish retest of the break zone.
● Hourly structure now tracks a new descending trend-line; failure to reclaim 3 300 keeps momentum pointed to the next fib / horizontal shelf at 3 280, with the channel width projecting 3 245 support.
💡 Fundamental Analysis
● Rebound in US 2-yr yields after hawkish Fed speakers and a stronger-than-expected durable-goods print lifted the DXY, reducing short-term bullion appeal.
-------------------
Share your opinion in the comments and support the idea with a like. Thanks for your support!

Gold Breakdown Confirmed — Bearish Pennant Targets UnfoldingGold ( OANDA:XAUUSD ) started to decline as I expected in my previous idea after the lower lines of the Ending Diagonal broke .
Gold is moving near the Resistance zone ($3,349-$3,325) . And Gold seems to be crossing the 50_SMA(Daily) .
From a Classical Technical Analysis perspective , the Bearish Pennant Pattern seems to indicate a continuation of the downtrend in Gold .
From an Elliott wave theory perspective , it seems that Gold has completed the Zigzag Correction(ABC) , and we can expect the next 5 downwaves .
I expect Gold to continue to decline at least to the Support zone($3,281-$3,243) and Monthly Pivot Point .
Note: Stop Loss (SL) = $3,360
Gold Analyze (XAUUSD), 1-hour time frame.
Be sure to follow the updated ideas.
Do not forget to put a Stop loss for your positions (For every position you want to open).
Please follow your strategy; this is just my idea, and I will gladly see your ideas in this post.
Please do not forget the ✅ ' like ' ✅ button 🙏😊 & Share it with your friends; thanks, and Trade safe.

Gold Builds Bullish Momentum After $3,294.0 ReboundGold bounced from $3,294.0, forming a double bottom pattern as XAU/USD consolidates near $3,330.0. Stochastic has exited oversold territory, signaling strengthening bullish momentum.
If $3,294.0 holds as support, the uptrend may continue toward the $3,393.0 target.
DeGRAM | GOLD rebound📊 Technical Analysis
● Friday’s flush tagged the green 3 300–3 310 demand and the long-term trend-support, then left a bullish gap inside the falling channel; price is now basing above the gap midpoint and printing higher lows toward the pink supply.
● A clean break of channel resistance at 3 348 completes a 4 h inverse-H&S measured to the next confluence at 3 375 (May pivot / former range top).
💡 Fundamental Analysis
● Core PCE cooled to 0.1 % m/m, pulling real 2-yr yields to two-week lows while IMF flagged persistent central-bank bullion buying—both restoring bid tone in gold.
✨ Summary
Long 3 320-3 335; clearance of 3 348 targets 3 375. Bias void on a 4 h close below 3 300.
-------------------
Share your opinion in the comments and support the idea with a like. Thanks for your support!

DeGRAM | GOLD held the lower boundary of the channel📊 Technical Analysis
● Price bounced from the channel floor (≈ 3 320) forming a bullish falling-wedge whose breakout target coincides with the median resistance at 3 348.
● Hidden RSI divergence and a series of higher lows inside today’s micro-range show buyers absorbing supply; reclaiming the wedge apex should accelerate toward the upper channel band near 3 375.
💡 Fundamental Analysis
● Spot-ETF inflows resumed and Fed-funds futures now price only one cut this year while real yields eased after soft US consumer-confidence data, trimming dollar bid and reviving gold demand.
✨ Summary
Long 3 320-3 330; wedge break > 3 335 eyes 3 348 then 3 375. Bull view void on a 30 min close below 3 300.
-------------------
Share your opinion in the comments and support the idea with a like. Thanks for your support!

Gold (XAUUSD) – Pullback Setup Before Breakout? – JUNE 26, 2025🟡 GOLD PRICE OUTLOOK – June 26, 2025
Bias: Bullish | Looking for long entry on pullback
📊 Technical Overview :
OANDA:XAUUSD Gold continues to build a bullish market structure, forming consistent Higher Highs (HH) and Higher Lows (HL). Price is currently moving within a rising wedge, approaching a short-term resistance zone.
🔴 Sell Zone (Resistance) : 3359 – 3373
– Rising wedge top + upper trendline
– Fakeout trap possible near 3379.26
🟢 Buy Zone (Support) : 3294 – 3300
– Strong confluence zone
– Matches previous structure support + trendline
– Ideal for HL formation and long setup
🌍 Fundamentals & Macro Drivers :
💵 USD Weakness:
• DXY near 3.5-year low after Powell replacement rumors
• Boosting gold's upside momentum
☢ Geopolitical Risk:
• Iran–Israel ceasefire in place, but fragile
• Safe-haven demand still supportive
🏦 Central Bank Demand:
• 20% of global gold demand from central banks
• China 🇨🇳 & India 🇮🇳 are major buyers
📅 Upcoming Catalysts:
• US PCE Inflation & GDP due tomorrow
→ Weak data = Potential breakout above 3370+
📌 Trade Plan :
✔ Watch for rejection at 3359–3373
✔ Long setup if price retests 3294–3300
🎯 Target = 3370+
❌ Invalidation = Daily close below 3280
📈 Summary :
Gold remains structurally bullish, supported by weak USD, central bank demand, and macro risks.
Waiting for a healthy pullback into demand for long continuation setups.

Gold is obviously suppressed, so we must go short!Yesterday, gold continued to fluctuate and fall under pressure at the 3360 mark. The US market further accelerated downward to break through the 3300 integer mark and reached a weak closing near 3295. The daily K-line closed with a suppressed fall and broke the bottom of the middle shadow. The overall gold price continued to fluctuate and fall in a weak rhythm. After reaching the lowest level of 3295, it rebounded and closed at 3323. Today, it opened at 3324. As of now, it has reached the highest level of 3337. At present, we are focusing on the suppression of 3340-3348. If the rebound is under pressure, we can still intervene in short orders. The recent market trends are basically the same - bottoming out and rebounding. In terms of operation, continue to keep shorting under pressure and long positions after bottoming out and rebounding.
From the current market trend, today's upper short-term resistance focuses on the 3338-3342 area. If it rebounds to this range and is under pressure, you can consider choosing an opportunity to arrange short orders. The lower support focuses on the 3315-3305 line. If it falls back and stabilizes, there is a possibility of a short-term rebound. The overall situation is still in a range-bound structure. It is recommended to focus on key points, buy high and sell low, follow the trend, and strictly control risks. For more specific operation points, please pay attention to the 🌐 notification at the bottom.

DeGRAM | GOLD dipped below the supply zone📊 Technical Analysis
● Price has broken the inner rising-trend support and is sliding inside a fresh descending channel; the current pull-back is stalling in the 3 350-3 365 supply zone, where the old trend-line and a June distribution block overlap, printing consecutive lower highs.
● The channel’s width and the purple flag just completed project to 3 295 support (May pivot + mid-channel); a close beneath it exposes the outer rail / March swing low around 3 245.
💡 Fundamental Analysis
● Hawkish Fed comments have pushed 2-yr yields back above 4.8 % and lifted the DXY, while CFTC figures show a third straight week of long liquidation, curbing bullion bids.
✨ Summary
Fade 3 345-3 360; sustained trade under 3 320 targets 3 295 ➜ 3 245. Short bias void on an H1 close above 3 365.
-------------------
Share your opinion in the comments and support the idea with a like. Thanks for your support!

DeGRAM | GOLD bullish takeover from support📊 Technical Analysis
● The XAUUSD 4-hour chart, as shown in the upper right corner, presents a clear bullish structure within a well-defined rising channel. Price action has consistently respected both the lower and upper boundaries of this channel, with multiple bounces off support levels reinforcing the trend. Recently, the chart highlights a “bullish takeover” after a brief pullback, where price found support at 3,345.47 and quickly reclaimed ground above the channel’s median. The forecasted path, illustrated by the projected arrows, suggests a continuation toward the resistance zone at 3,431.14, with the channel’s upper boundary acting as a dynamic target. The presence of higher lows and the swift recovery from the latest dip further confirm the underlying bullish momentum.
● The technical setup is strengthened by the clear identification of support and resistance levels. The 3,293.50 area has repeatedly served as a strong base, while the 3,431.14 level is marked as the next significant resistance. The rising channel itself provides a visual framework for the ongoing uptrend, and the recent bullish engulfing pattern at support signals renewed buying interest. The chart’s structure, with its clean trendlines and labeled zones, points to a high-probability scenario for further gains as long as price remains within the channel.
💡 Fundamental Analysis
● Recent fundamentals support the technical case for continued upside in gold. As of June 22-23, 2025, gold is trading near 3,364, with market sentiment buoyed by ongoing geopolitical tensions in the Middle East and persistent global economic uncertainty. While Citi has revised its long-term gold forecasts downward, Bank of America maintains a bullish outlook, citing safe-haven demand amid US military actions and inflation concerns. Additionally, the latest data shows that gold remains above key moving averages, and the Relative Strength Index (RSI) is holding near neutral, suggesting room for further upside. The combination of technical resilience and supportive macro factors continues to attract buyers to gold as a hedge against volatility.
✨ Summary
● XAUUSD is poised for a move toward 3,431.14, with the rising channel and recent bullish takeover pattern supporting the case for further gains. The bullish scenario remains valid as long as price holds above 3,345.47, with 3,293.50 serving as a critical support. A sustained break above resistance could open the path to new highs, while a drop below channel support would warrant a reassessment of the trend.
-------------------
Share your opinion in the comments and support the idea with a like. Thanks for your support!

DeGRAM | GOLD descending wedge📊 Technical Analysis
● Price is compressing in a descending wedge at the channel floor (3 343-3 350). Repeated long-tailed rejections hint at seller exhaustion while RSI makes higher lows, flagging hidden strength.
● A 30 min close above the wedge roof (≈ 3 357) should trigger a measured move to the intra-channel resistance band at 3 371, then the prior pivot at 3 383.
💡 Fundamental Analysis
● Thursday’s softer US Philly Fed index and a slip in 2-yr real yields cooled the dollar, reviving bullion bids; meanwhile Chinese customs data show May gold imports up 18 % m/m, underscoring physical demand.
✨ Summary
Buy 3 345-3 355; wedge breakout >3 357 targets 3 371 ➜ 3 383. Long view void on a 30 min close below 3 335.
-------------------
Share your opinion in the comments and support the idea with a like. Thanks for your support!

Gold Hits PRZ with RD-! Time for Bears to Take Over?Gold ( OANDA:XAUUSD ) attacked the Resistance zone ($3,445-$3,406) once again, forming an Ending Diagonal at the top of the structure.
Although price reached the Potential Reversal Zone (PRZ) , the presence of Regular Divergence (RD-) between the last two peaks could indicate the weakening of bullish momentum .
In terms of Elliott Wave theory , we can clearly count a completed 5-wave structure , with an Ending Diagonal pattern . This supports the idea of a major correction starting soon .
I expect Gold to attack the lower lines of Ending Diagonal , and if it breaks, it could drop to at least $3,333 . The Second Target could be the Support zone ($3,451-$3,120) .
Do you think Gold will make a new All-Time High(ATH) again in this rally?!
Note: Stop Loss (SL) = $3,463
Gold Analyze (XAUUSD), 2-hour time frame.
Be sure to follow the updated ideas.
Do not forget to put a Stop loss for your positions (For every position you want to open).
Please follow your strategy; this is just my idea, and I will gladly see your ideas in this post.
Please do not forget the ✅ ' like ' ✅ button 🙏😊 & Share it with your friends; thanks, and Trade safe.

DeGRAM | GOLD aim to test the lower boundary📊 Technical Analysis
● Hourly price is defending the channel’s lower half: three consecutive wicks bounced at 3 360, forming a descending flag whose base coincides with the dynamic support.
● OBV is edging higher while the flag narrows; a close above 3 408 would unlock the flag-measured move toward the upper rail / horizontal target at 3 444–3 450.
💡 Fundamental Analysis
● World Gold Council reports India’s jewellery demand rebounded 8 % w/w as monsoon concerns eased, while CME data show fresh 6 K-lot COMEX short-covering after the latest FOMC testimony tempered rate-hike talk.
✨ Summary
Long 3 360–3 380; flag break > 3 408 eyes 3 444 → 3 450. Bull view void on an H1 close below 3 343.
-------------------
Share your opinion in the comments and support the idea with a like. Thanks for your support!

DeGRAM | GOLD kept the rising channel📊 Technical Analysis
● Price rejected the channel roof near 3 435 again, carving a small evening-star and slipping back under the May trend-median 3 370 — a repeat of April/May fades.
● Bearish RSI divergence plus a break of the micro up-sloper (last three sessions) tips for a rotation toward the lower rail/3 295 support; loss of that opens the April pivot at 3 225.
💡 Fundamental Analysis
● Sticky US retail-sales and hawkish Fed comments keep 2-yr yields near 4.8 %, firming the DXY, while CFTC data show specs cutting longs for a second week — limiting bid depth.
✨ Summary
Sell rallies 3 410-3 430; sustained trade below 3 366 targets 3 295, stretch 3 225. Short view void on an H4 close above 3 450.
-------------------
Share your opinion in the comments and support the idea with a like. Thanks for your support!

Gold bulls may restart at any time, buy gold!Although compared with the performance of gold during the day, gold only touched 3452 and then began to retreat, and even failed to approach the previous high of 3500, gold is not strong; but based on the current fundamentals and technical structure, gold is currently in a very strong bullish structure; so I think the gold retracement is not a sign of gold weakness, but to increase liquidity, so that gold can rise better and prepare in advance for breaking through 3500! Gold bulls are ready to restart at any time after the retracement!
So for short-term trading, I don’t think the gold retracement is a reason for weakness, nor is it a certificate for chasing short gold; on the contrary, I think the gold retracement is a good time to buy on dips; first of all, the support area we have to pay attention to is the 3410-3400 area, and the second must pay attention to the 3390-3380 area support.
So in the next transaction, we might as well use these two support areas as defense and start to go long on gold in batches!

DeGRAM | GOLD reached the resistance area📊 Technical Analysis
● Third rejection of the H1 descending-channel roof (≈3 382) printed a bearish engulfing and confirmed the prior “false-break” spike; price is now back under the purple retest line that acted as supply all month.
● An intraday rising wedge has cracked; its measured leg aligns with the grey targets at 3 344 (minor support) and the 3 289 liquidity pocket near the channel’s mid-rail.
💡 Fundamental Analysis
● Firmer US 2-yr yield near 4.8 % after upbeat PPI and hawkish Fed dots lifted the DXY, while CFTC data show fresh trimming of gold longs, reducing dip-buying fire-power.
✨ Summary
Fade rallies 3 335-3 345; sustained trade <3 320 eyes 3 344 then 3 289. Bear view void on an H1 close above 3 350.
-------------------
Share your opinion in the comments and support the idea with a like. Thanks for your support!

Gold Correction = Bearish Divergence + Wedge + Zigzag CompleteGold ( OANDA:XAUUSD ) attacked the Resistance zone($3,387-$3,357) today after the release of the US CPI indices . Although the figures seemed to be in gold's favor, traders still seem to be determined to continue the price correction.
In terms of Elliott Wave theory , it seems that Gold has managed to complete the Zigzag Correction. We should wait for the next 5 down waves .
Also, we can see the Regular Divergence(RD-) between Consecutive Peaks .
In terms of Classic Technical Analysis , Gold appears to have successfully formed a Rising Wedge Pattern .
I expect Gold to drop to at least $3,296 AFTER breaking the lower line of the Rising Wedge Pattern .
Note: Stop Loss(SL)= $3,380
Gold Analyze ( XAUUSD ), 1-hour time frame.
Be sure to follow the updated ideas.
Do not forget to put a Stop loss for your positions (For every position you want to open).
Please follow your strategy; this is just my idea, and I will gladly see your ideas in this post.
Please do not forget the ✅' like '✅ button 🙏😊 & Share it with your friends; thanks, and Trade safe.

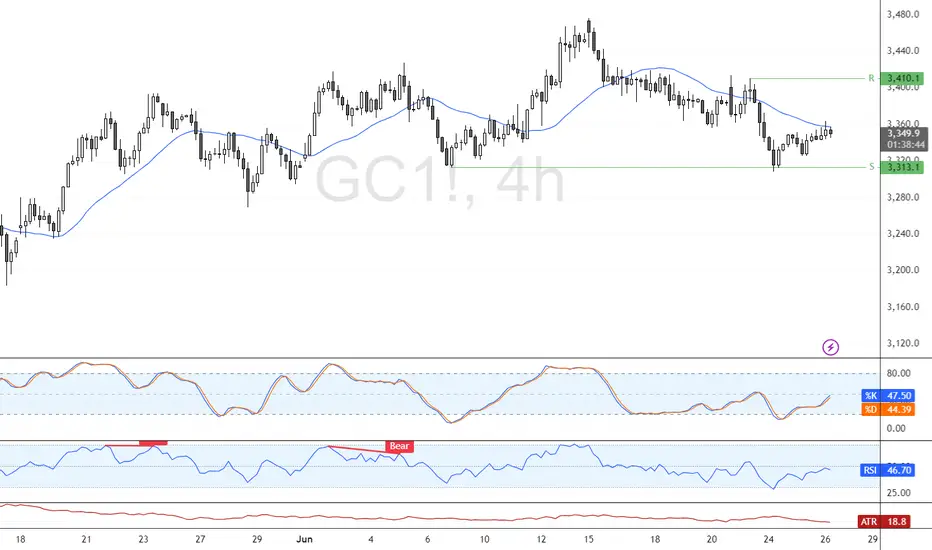
The gold trend is perfectly in line with expectations.The recent trend of gold is consistent with my expectations. Overall, the rebound is mainly based on fluctuating downward, and the rhythm of the oscillation between long and short positions is perfectly grasped. The upper resistance is still strong, and gold can still be shorted if the rebound is not broken.
From the current analysis of the gold trend, the lower support focuses on the area around 3315-3305. If it falls back to this position range, continue to look at the continuation of the rebound upward; the upper resistance focuses on the area around 3350-3362. The overall rhythm of the high-altitude and low-multiple range is still maintained, and the strategy is mainly to participate in the range back and forth.
1. Go long when gold falls back to 3315-3305, and the target is 3330-3340;
2. Go short when gold rebounds to 3350-3360, and the target is 3340-3330.

Insist on shorting gold on ralliesToday we made a total profit of 350 pips in 2 short trades. First, we shorted gold near 3345, and when gold fell to around 3330, we manually closed the order to lock in profits; the second time, gold rebounded sharply with the help of CPI data, and we seized the opportunity to short gold again near 3360, and ended the transaction by hitting TP: 3340. We accurately grasped the profit of gold shorting.
At present, gold is in a narrow range of fluctuations near the 3330 mark. Relatively speaking, gold is still in a weak position. Although gold has rebounded sharply with the help of the positive CPI data, it has shown a long upper shadow in the candle chart due to the rapid retracement, which has strengthened the resistance above and limited the rebound space of gold in the short term. In addition, the morphological structure shows signs of building a head and shoulders top structure. The resistance area in the short term is 3345-3355; followed by 3360-3370. Although gold is currently in a narrow range of fluctuations near the 3330 mark, it does not show obvious signs of support. It is easy to fall below the area near 3330 in a weak situation. The relatively strong support is in the 3320-3310 area, followed by the area near 3300-3290.
So for short-term trading, I still advocate taking the 3345-3355 area as resistance first and continue to short gold!

DeGRAM | GOLD broke the wedge📊 Technical Analysis
● Price still respects the former channel roof (now support) at 3 315-3 320; every dip to this line (green arrows) printed a higher low, preserving the rising-wedge structure.
● A break of the local wedge cap at 3 350 would reopen the April supply/median target at 3 435; failure to pierce keeps the pull-back window open toward the lower grey band at 3 245, where the broader demand begins.
💡 Fundamental Analysis
● US ISM-services prices and NFP cooled, lifting September Fed-cut odds >70 % and capping real yields, while continued PBoC purchases offset ETF outflows, under-pinning bullion.
✨ Summary
Buy 3 305-3 320; confirmation above 3 350 targets 3 435, extension 3 500. Long bias void on an H4 close below 3 245.
-------------------
Share your opinion in the comments and support the idea with a like. Thanks for your support!

Gold fluctuates repeatedly and opportunities emerge.Gold bottomed out in the Asian session and rebounded to break through the opening of the decline. The European session continued to break through yesterday's high. The US session continued to break through the key pressure position of 3335-3345, and walked out of the standard strong cycle. After the break, it is necessary to change the thinking and follow the trend to be bullish. Pay attention to the support below 3315-3325. In terms of operation, it is mainly long when it falls back. The upper side gradually looks to 3352 and 3365. If the pressure is not broken, look at the falling space!
Operation suggestion: Go long when gold falls back to 3325-3315, and look at 3338 and 3352! If the pressure above 3352 and 3365 is not broken, you can short!
The recent trading strategy ideas are all realized, and all the points are predicted accurately. If your current gold operation is not ideal, I hope I can help you avoid detours in your investment. Welcome to communicate with us!

xauusd weekly analysis
**XAU/USD Weekly Analysis**
*(June 2-13, 2025)*
---
### **LAST WEEK'S PERFORMANCE (June 2-6)**
**Price Action:**
- Weekly decline: **~2%**
- Key levels:
- Resistance: $3,355–$3,381 (61.8% Fibo)
- Support: $3,272–$3,288 (38.2% Fibo)
- Range: $3,291.50 (low) to $3,365 (high)
- Close: Near $3,310–$3,316
**Key Drivers:**
1. **USD Strength**: Fiscal concerns (Senate tax bill debate adding $3.8T debt)
2. **Reduced Safe-Haven Demand**: Trump delayed EU tariffs to July 9
3. **Central Bank Caution**: Market awaited ECB/BoC decisions and U.S. jobs data
---
### **NEXT WEEK OUTLOOK (June 9-13)**
**Critical Technical Levels:**
| **Support** | **Resistance** |
|-------------------|-------------------|
| $3,272–$3,288 | $3,370–$3,375 |
| $3,295 (SMA) | $3,381 (Key Breakout) |
| $3,210–$3,214 | $3,400–$3,434 |
**Fundamental Catalysts:**
1. **Central Banks**:
- ECB Decision (June 12) → Dovish stance = USD strength
- BoC Decision (June 11) → Rate cuts may boost USD
2. **U.S. Data**:
- Non-Farm Payrolls (June 13) → Strong data = fewer Fed rate cuts
3. **Geopolitical Risks**:
- Escalations in Ukraine/Middle East → Safe-haven demand
4. **U.S. Fiscal Policy**: Senate vote on $3.8T tax bill
**Market Sentiment:**
- **Bullish Case**: Break above $3,381 targets $3,500–$3,800
- **Bearish Risks**: Breakdown below $3,272 risks drop to $3,160
---
### **TRADING STRATEGY**
**Key Approaches:**
- **🔺 Long Setup**:
- Entry: Above $3,381
- Target: $3,500
- Stop-loss: $3,320
- **🔻 Short Setup**:
- Entry: Below $3,272
- Target: $3,210
- Stop-loss: $3,310
- **Event Hedging**: Use options around ECB/BoC/NFP events
**Risk Management Note:**
> "Gold's trajectory hinges on USD dynamics and central bank guidance. A weekly close above $3,381 confirms bull trend resumption."
---
### **KEY EVENTS CALENDAR**
| Date | Event | Impact Level |
|------------|---------------------------|--------------|
| June 11 | Bank of Canada Rate Decision | High |
| June 12 | ECB Rate Decision | High |
| June 13 | US Non-Farm Payrolls | Very High |
| Mid-week | US Senate Tax Bill Vote | Moderate-High|
---
**Conclusion:**
Next week presents a binary setup for XAU/USD:
- Break above **$3,381** opens path to $3,500+
- Failure to hold **$3,272** risks correction to $3,210
Prioritize risk management during high-impact events. The long-term uptrend remains intact but short-term direction depends on USD and central bank policy.
for intra day traders and scalpers follow the range zone

DeGRAM | GOLD forming the ascending wedge📊 Technical Analysis
● Price is coiling inside an ascending flag that is riding the new support line at 3 342; flag range compression after each pull-back signals energy for a thrust.
● The pattern sits above the old channel roof, turning the former resistance into a launch pad; measured move of the flag points to the next confluence at 3 435.
💡 Fundamental Analysis
● US jobless claims ticked up while 10-yr yields slipped under 4.30 %; lower carry costs and renewed Chinese reserve buying reported by Reuters keep dip-buyers active in bullion.
✨ Summary
Buy 3 330-3 350; flag break targets 3 435, stretch 3 500. Invalidate on a 4 h close < 3 245.
-------------------
Share your opinion in the comments and support the idea with a like. Thanks for your support!
