Gold's Descent: Breaking Support and Looking AheadYesterday was not a bad day for Gold bears, with the price dropping around 150 pips, but more importantly, breaking under important confluence support around 1915.
As explained in yesterday's post, this was the line in the sand and Gold under this level would bring bearish confirmation.
Going further, I expect XauUsd to continue its descent and I'm looking for a drop to the first technical level at 1885.
However, in the long run, 1855 is my target.
That being said, sell rallies is the strategy for me with an ideal entry between 1910-1915.
Keep in mind that gold is currently in a weakened state, and the broken support may not be retested. Therefore, signs of weakness above 1900 could also present good entry opportunities.
Best of luck and happy trading!
Mihai Iacob
Goldsignal

XAUUSD Top-down analysis Hello traders, this is a complete multiple timeframe analysis of this pair. We see could find significant trading opportunities as per analysis upon price action confirmation we may take this trade. Smash the like button if you find value in this analysis and drop a comment if you have any questions or let me know which pair to cover in my next analysis.

Gold Fall by 🗻Double Top Pattern🗻⏰(1-Hour)⏰🗻Gold seems to be completing the second top of the 🗻 Double Top Pattern 🗻 near the 🔴 Resistance zone($1,939.00-$1,932.00) 🔴 and the Important Downtrend line .
🌊According to the theory of Elliott waves , gold seems to have completed its 5 impulsive waves and is now forming Corrective Waves .
🔔I expect Gold to move towards the 🟢 Support zone 🟢 after breaking the Neckline of the Double Top pattern .
Gold Analyze ( XAUUSD ), 1-hour time frame ⏰.
Do not forget to put Stop loss for your positions (For every position you want to open).
Please follow your strategy; this is just my idea, and I will gladly see your ideas in this post.
Please do not forget the ✅' like '✅ button 🙏😊 & Share it with your friends; thanks, and Trade safe.

GOLD (XAUUSD): Important Resistance Ahead! 🥇
Gold suddenly bounced on Friday.
The market closed, approaching a significant zone of supply.
The underlined blue area on the chart is based on a falling trend line
and a horizontal resistance.
From that zone, a bearish movement will be expected at least to 1908 support.
Alternatively, a bullish breakout of the underlined zone may trigger a strong bullish wave.
❤️Please, support my work with like, thank you!❤️

🚀Gold increase after Breaking the Resistance lines🚀⏰(1-Hour)⏰✅Gold managed to break the resistance lines a few hours ago.
🔔I expect the upward trend of Gold to continue and Gold to close its 🟡 Price Reversal Zone(PRZ) 🟡 and Important Downtrend line .
Gold Analyze ( XAUUSD ), 1-hour time frame ⏰.
Do not forget to put Stop loss for your positions (For every position you want to open).
Please follow your strategy; this is just my idea, and I will gladly see your ideas in this post.
Please do not forget the ✅' like '✅ button 🙏😊 & Share it with your friends; thanks, and Trade safe.

Today, again gold sell? We hope Gold will hit our targetsDear MsProTrading Members,
Today, we can clearly see the gold trend, and we hope that this trend will continue until 1912 or 1906.

GOLD (XAUUSD): Detailed Structure Analysis 🥇
Here is my latest structure analysis for Gold.
Horizontal Key Levels
Resistance 1: 1942 - 1953 area
Resistance 2: 1965 - 1972 area
Resistance 3: 1978 - 1987 area
Support 1: 1884 - 1889 area
Vertical Key Levels
Vertical Resistance 1: Falling trend line
Consider these structures for pullback/breakout trading.
❤️Please, support my work with like, thank you!❤️

🥇Gold🥇 Falls and then Rises⏰(15_Min)⏰✅Gold managed to form an Ascending Broadening Wedge Pattern .
🌊According to Elliott's wave theory , the Ascending Broadening Wedge Pattern completed Wave 4 .
🔔I expect Gold to decline to the 🟢 Support zone($1,915.420-$1,910.640) 🟢 and then rise again after confirmation of the end of Wave 5 .
⚠️I have shared two Long and Short positions in the chart for you, but be sure to act according to your Strategy and follow Capital management .
Gold Analyze ( XAUUSD ), 15-minute time frame ⏰.
Do not forget to put Stop loss for your positions (For every position you want to open).
Please follow your strategy; this is just my idea, and I will gladly see your ideas in this post.
Please do not forget the ✅' like '✅ button 🙏😊 & Share it with your friends; thanks, and Trade safe.

GOLD (XAUUSD): Bearish Wave Continues 🥇
Earlier, I have predicted that Gold will drop from a major falling trend line.
After its test, we saw a strong bearish reaction.
Taking into consideration the fact that Gold is trading in a bearish trend,
probabilities will be high that the market will go lower.
On a 4H time frame, the market closed, trading in a horizontal range and consolidating.
Your bearish confirmation will be a bearish breakout of the support of the range
- a 4h candle close below 1914.
A further bearish continuation at least to 1907 level will be expected then.
Alternatively, a bullish breakout of the range may initiate a correctional movement.
❤️Please, support my work with like, thank you!❤️

🥇Gold🥇 is Ready to ⚔️Attack⚔️ to Downtrend line⏰(15_Min)⏰🏃♂️Gold is moving near the 🟢 Support zone($1,914.520-$1,910.640) 🟢.
🌊Theoretically, Gold Elliott Waves can complete its 5 descending waves in the support zone. This is while wave 3 is Extended.
🔔I expect Gold to attack the Downtrend line from 🟢 Support zone($1,914.520-$1,910.640) 🟢.
Gold Analyze ( XAUUSD ), 15-minute time frame ⏰.
Do not forget to put Stop loss for your positions (For every position you want to open).
Please follow your strategy; this is just my idea, and I will gladly see your ideas in this post.
Please do not forget the ✅' like '✅ button 🙏😊 & Share it with your friends; thanks, and Trade safe.

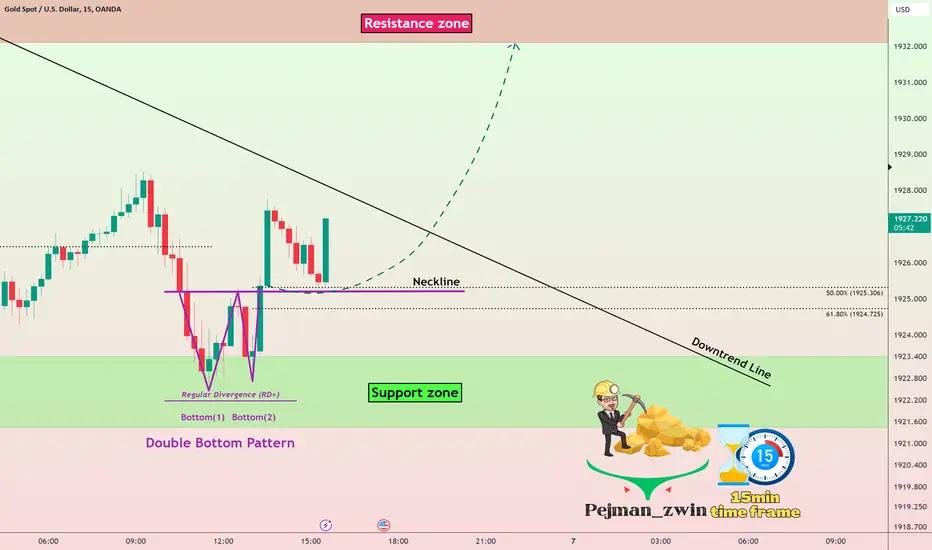
🥇Gold🥇ready to go up by Double Bottom Pattern🚀(15-Min)🚀Gold has managed to form a Double Bottom Pattern in the 🟢 Support zone($1,923.40-$1,921.40) 🟢.
📚 Regular Divergence(RD+) between the two bottoms of the Double Bottom Pattern is a good sign for this pattern to work.
🔔I expect gold to start going up after completing the pullback to the neckline of the double bottom pattern and breaking the downtrend line , and Gold will go up to the 🔴 Resistance zone($1,939-$1,932$ )🔴.
Gold Analyze ( XAUUSD ), 15-minute time frame ⏰.
Do not forget to put Stop loss for your positions (For every position you want to open).
Please follow your strategy; this is just my idea, and I will gladly see your ideas in this post.
Please do not forget the ✅' like '✅ button 🙏😊 & Share it with your friends; thanks, and Trade safe.
Gold remains bullish above 1930 zoneIn my yesterday's analysis, I said that I expect XauUsd to reach 1980 and my opinion hasn't changed.
As expected Gold retrace a little from the top, but considering the 700 pips rally from the recent bottom, this is nearly a correction. Also, looking at a shorter time frame, like h4 or h1, looks more like a consolidation.
Looking at the posted daily chart we see that the 1925-1930 zone is strong support and as long as the price stays above this zone, the buy dips strategy remains intact.
That being said, I will look to buy, and, if the target is reached, a 1:4 risk: reward ratio could be achieved, and that is all that matters in the end for a trader:)

🥇Gold🥇is ready to break the Downtrend line⏰(15 min)⏰!!!🏃♂️Gold is moving in the 🟢 Support zone($1,939-$1,932) 🟢 and near the Support line .
🌊Gold seems to be completing another corrective wave , which is a Zigzag structure(5-3-5) .
🔔I expect Gold to at least increase to the previous top after breaking the downtrend line .
Gold Analyze ( XAUUSD ), 15-minute time frame ⏰.
Do not forget to put Stop loss for your positions (For every position you want to open).
Please follow your strategy; this is just my idea, and I will gladly see your ideas in this post.
Please do not forget the ✅' like '✅ button 🙏😊 & Share it with your friends; thanks, and Trade safe.

GOLD possible long for 1950gold broke 1947 resistance but did not hold price above the resistance. Demand zone for long 1925 & 1915. stop loss: 1912, target: 1950.

GoldTp short1:1938/40
Tp short 2:1936/00
To long 1:1946/00
To long 2:1947/00
Tp long 3:1949/50
Intry price:1939/40

GOLD (XAUUSD): Your Trading Plan For Next Week 🥇
GOLD perfectly respected a contracting supply zone on a daily time frame,
based on a major falling trend line and a horizontal resistance.
Next week, pay attention to a double top pattern on a 4H time frame.
If the price breaks and closes below 1934 - the neckline of the pattern,
a bearish continuation will be expected at least to 1926.
Because the market is trading in a bearish trend since May,
I remain very bearish biased.
However, a bullish breakout of the underlined blue are may trigger a strong bullish wave.
❤️Please, support my work with like, thank you!❤️

🥇Gold🥇 Analyze (Road Map)!!!🗺️(15 min)🚀Gold is resting for the next climb after breaking the 🔴 resistance zone 🔴 during the last day.
🌊According to the theory of Elliott waves , the structure of gold corrective waves is the Double Three Correction type(WXY) .
🔔I expect gold to rally to the next 🔴 resistance zone($1,954.80-$1,949.80 🔴 in the coming hours.
Gold Analyze ( XAUUSD ), 15-minute time frame ⏰.
Do not forget to put Stop loss for your positions (For every position you want to open).
Please follow your strategy; this is just my idea, and I will gladly see your ideas in this post.
Please do not forget the ✅' like '✅ button 🙏😊 & Share it with your friends; thanks, and Trade safe.

XAUUSD Top-down analysisHello traders, this is a complete multiple timeframe analysis of this pair. We see could find significant trading opportunities as per analysis upon price action confirmation we may take this trade. Smash the like button if you find value in this analysis and drop a comment if you have any questions or let me know which pair to cover in my next analysis.

🥇Gold🥇 is ready to ⚔️Attack⚔️ the 🔴Resistance Zone🔴🔨 Gold started to rise after breaking the descending channel from the 🟢 heavy support zone($1,903-$1,886) 🟢.
🌊According to the theory of Elliott waves , gold managed to complete wave 5 and is currently completing wave 4.
🔔I expect wave 4 to end in the 🟡 Price Reversal Zone(PRZ) 🟡 and gold to start rising again (the 🎯 target 🎯 of wave 5 could be in the area I marked on the chart).
Gold Analyze ( XAUUSD ), 1-hour time frame ⏰.
Do not forget to put Stop loss for your positions (For every position you want to open).
Please follow your strategy; this is just my idea, and I will gladly see your ideas in this post.
Please do not forget the ✅' like '✅ button 🙏😊 & Share it with your friends; thanks, and Trade safe.

XAUUSD Top-down analysis Hello traders, this is a complete multiple timeframe analysis of this pair. We see could find significant trading opportunities as per analysis upon price action confirmation we may take this trade. Smash the like button if you find value in this analysis and drop a comment if you have any questions or let me know which pair to cover in my next analysis.

XAUUSD Top-down analysis, UPDATED!!Hello traders, this is a complete multiple timeframe analysis of this pair. We see could find significant trading opportunities as per analysis upon price action confirmation we may take this trade. Smash the like button if you find value in this analysis and drop a comment if you have any questions or let me know which pair to cover in my next analysis.

GOLD SELL Dear traders, gold is ready for sell
entry 1923
sl 1933
tp 1905
note- per trade max risk 1 %
( MONEY MANAGEMENT IS THE ONE AND ONLY KEY IN FOREX )

XAUUSD Top-down analysis Hello traders, this is a complete multiple timeframe analysis of this pair. We see could find significant trading opportunities as per analysis upon price action confirmation we may take this trade. Smash the like button if you find value in this analysis and drop a comment if you have any questions or let me know which pair to cover in my next analysis.
