Gold- Correction after false break?After the recent 1655 low, Gold started to consolidate with a downwards tendency.
Today's FED could bring volatility and a new spike down.
However, after this low, I expect a correction to the upside and a challenge of 1700.
Also, looking at a monthly chart you can see that this is the 6th consecutive red month and Gold is in need of a meaningful correction and can close September into green territory.
Today's daily close should bring a more clear picture though.
Goldsignal

Gold Rane Zone 1H Time FrameGold trade into rang zone and trade below 21-EMA and trendline
RSI below 50 and down side 30 mark support
The near–term support is around $1650,

DeGRAM | GOLD shortGOLD is in an ascending channel following a bearish move.
Price action is forming a triangle. This is a trend-continuation pattern.
Price is coiling up before expansion.
We expect to test support levels.
-------------------
Share your opinion in the comments and support the idea with like. Thanks for your support!

Gold- Do we have a genuine break of support?As I kept saying last week, there is a high probability of a double top pattern for Gold and the 1680-1690 zone support was the only thing that stood in bears way and a confirmation of this pattern.
Now we have this break and, of course, we wonder if is a genuine one.
In my opinion, it is.
With this in mind, I expect a continuation to this fall and a drop, in the first instance, around 1600.
Gold bears should look to sell rallies in old's support zone, now resistance.
And negation comes with Gold back above 1700.
Best reagards!
Mihai Iacob

Gold Breakout Weekly TrendlineGold has a downward trend in the short term support 1650 scope
RSI testing triple bottom strong bearish
It is good to wait till gold closes below the $1674 level in the weekly chart (today).

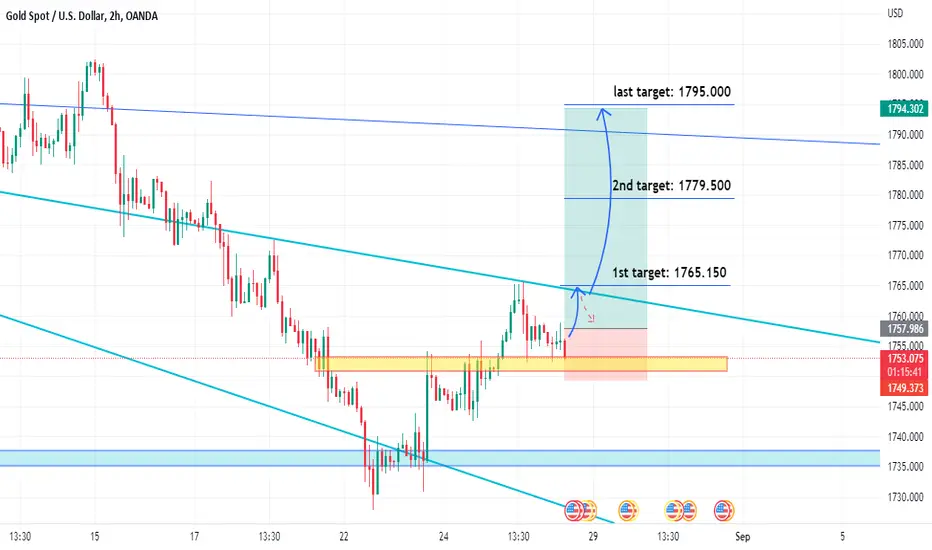
GoldViewFX - 20 PIP SIGNAL SETUP IN ACTION!!!
This is a simple 20 pip setup that can be used in ranging conditions allowing intraday setups both ways.
We look for EMA5 to crossover MA21 UP or DOWN followed with a 1H closing candle, which we call the locking candle. Once this is done, we then enter on the next candle and target 20pips.
The example on this chart shows the setup in action hitting targets up and down.
Please don't forget to like, comment and follow to support us, we really appreciate it!
GoldViewFX
XAUUSD TOP AUTHOR
GoldViewFX - Market UPDATEHey Everyone,
Another fantastic day at Premier. We waited patiently for a new Goldturn low and then identified a signal to 1707, which was the perfect exit.
We still have the gap open to 1695 on this chart, which is playing out perfectly! and also 1685 on the chart below.
These levels are still within the support and swing range and therefore we are not comfortable shorting to these levels at support now. We will use this instead to keep exits tight on buys and try and get the sweet entries for the run up once the momentum below has found floor.
EMA5 break and lock above 1738 Goldturn will fail and break the rising wedge pattern opening the upper range upto 1761. A rejection below 1738 will maintain the rising wedge pattern until we see the breakout geared for the break below to retest 1695 in line with the formation. This TARGET 1695 is still open!!
As always, we will keep you all updated with any changes to our plans throughout the week. Please don't forget to like, comment and follow to support us, we really appreciate it!
GoldViewFX
XAUUSD TOP AUTHOR

Gold is ready for huge drop (Double top soon in play)On 2nd September I've written that Gold could drop under the 1680-1690 zone, confirming a large double top pattern.
Also, yesterday and on Monday I draw attention that the recent rise is ONLY a correction and not a genuine reversal.
And, indeed, yesterday, on the back of CPI data, Gold dropped more than 300 pips from top to bottom, negating a week of growth.
So, what's next?
Looking at the posted daily chart we can see that the trend is very bearish with a sequence of 5 lower highs at this moment and also from mid-June, Gold is trading in a descending triangle.
I consider the recent correction finished after yesterday's reversal and I expect a drop under important 1680-1690 support. Considering the importance of such a break and the possibility of large SLs under this level, I expect acceleration to the downside and a strong bearish move in the coming weeks.
The longer-term target can be 1500 and if you are "scared" of a 2k pips drop, all you need to do is to look at the March- April drop followed by the June-July drop, which is also 2k pips. So, the triangle's target is not only not out of the question, but very probable.
My 2nd Sept analysis:
Monday analysis:
Yesterday's analysis:
Best regards!
Mihai Iacob

Gold- Is this correction over?In my yesterday's comment I said that, in my opinion, the rise from 1690 support is just a correction, not the start of a new bull leg and my opinion remains unchanged.
This correction has continued yersterday and as I expected, a spike above 1730 took place.
However, looking at the posted chart we can clearly see that the structure lacks impulse and is overlapping suggesting that a reversal is imminent.
A first indication that the correction is over comes with a break under short term trend line with further contirmation with a drop under yesterday's low.
I'm looking to sell Gold

Gold Direction Next (XAU USD)Gold Direction Next (XAU USD), the next direction of gold is zigzag in small area but remember that news can affect the direction.

Gold- 1725-1730 zone is the line in the sandYesterday, after a new visit at support, under 1700, Gold has recovered losses and finished the day well into the green.
However, the trend remains bearish both in the short and medium term with a clear strong confluence resistance above 1720.
I will remain bearish as long as this level is intact and expect a new dive under 1700.
On the other hand, a fail from the bears to defend this zone would signal 1690 as a bottom for the time being.

Gold will Target the new Low. (Daily)Hi Everyone,
Gold fail to break the resistance yesteday and gold also break the support range. High Probability (75-80%) gold will aim for the Lower price and seems it will make a new Lower Range later around (1640 - 1730) or maybe if FED hike more than 75bps on 20-21 Sept 2022, it will make a lower range from 1600- 1680 to trade next month.
i try to always we will keep you all updated . Please don't forget to like, comment and follow to support us, i really appreciate you support !
Goodluck
i'll help you to have a great trade.
Please using good money management.
dont take any emotional trade.
Note:
Dont risk more than 0.2% on trending market
Dont risk more than 1% on ranging market
Wish good luck for all people.
Please help support me by Clicking like button, and if you like my ideas please follow me and support me. i Relly Appreciate it!
i'll make more and more great analysis if this chanel grows.
on Gold , Oil , Nasdaq, SP500 , and some American, China, Japan, Indonesia stocks.
Best luck for you.
Cheers mate!
Thankyou.

Will Gold break under important support?On my Monday commentary, I said that 1720-1730 should be strong resistance and rallies towards that zone should be sold and, indeed, after an overnight spike in that zone yesterday, the price reversed strongly leaving a long-tailed red candle on our daily chart, a clear indication that bears are in control.
At the time of writing Gold is trading under the 1700 figure and a continuation to the downside is very probable.
I expect a break of support in the near future which will also confirm a large double top that we've spoken about on Friday.
The strategy should remain the same: Sell rallies and this bearish outlook is valid as long as the price of Gold is under yesterday's high.
Monday's Gold analysis:
Friday's Gold analysis:

Sell rallies is my strategyAs almost everyone has anticipated, Gold reversed from 1680-1690 zone support and now is trading 200 pips above this important zone.
However, in my opinion, this is not a reversal of the leg down from above 1800 started in mid-August, but just a correction.
Looking at the posted chart we can see that above 1720 is a strong confluence resistance given by the horizontal old support and the falling trend line and here traders shoul look for selling opportunities.
Only a daily close above 1730 would change this mid-term bearish outlook.
Best regards
Mihai Iacob

TRADE OF THE WEEK | Gold Scealping💰
Hey traders,
This week we spotted together a cute confluence zone on Gold.
The zone was based on the intraday falling trend line and recently broken horizontal structure.
Shorting the market from that we managed to catch a great winner.
Great analysis and perfect trend-following trade.
Good luck next week!
❤️If you have any questions, please, ask me in the comment section.
Please, support my work with like, thank you!❤️

Gold New Cup & HandleGold Recovery 21-EMA Edges Above if break next eyes 55-EMA
RSI Pauses at 50 mark resistance

GOLD NEW YORK SESSION TODAYHi team,
See detailed EURUSD analysis (linked post) for news relating to GOLD/USD this week. We will see something similar here.
We are hedging on the local support at 1710, and I will sell if we break lower - something I expect we will do in an hours time!
TP levels relate to daily time-frame descending channel.
We will hold a slightly higher SL than usual, given expected volatility at market opening.
Good luck, Trade safe
DrBear

Will Gold drop under 1500? (Long term view!!!)In this post, I will focus on an overview of Gold and what could happen in the long term.
In the short term, everyone saw the support from 1680 and is aware of the possibility of a rebound...
So...
Looking at the weekly posted chart we can see that after the high above 2k back in spring, Gold has started to drop, putting in lower highs on our chart. After the touch of the long-term trend line in May, Gold reversed, but soon after, in June, has broken under and quickly dived to the 1680 important zone. In July we again have a rise, just to be completely erased by August price action.
This whole dynamic gives me an indication that Gold could drop under 1680 and by this, it will also confirm an immense double top pattern that took two years to complete.
That being said, I'm more inclined to a continuation to the downside when it comes to medium-term price evolution, and considering the measured target for the double top pattern, we can see Gold trading under 1500.
In the short term, we can have a rally, but in my opinion, it will be short-lived and should be used as a selling opportunity for swing traders.

Gold is facing 1700 figure. What now?Since the last 1727-1765 rally, Gold is trading clearly down and all corrections that bulls are capable of are some anemic intraday rallies that are quickly sold.
I expect the down move to continue at least to 1680 and traders should look to sell rallies towards 1720 now resistance.
Only Gold above that level would delay this bearish scenario.
My previous Gold analysis:

Gold, XAUUSD forecast and signalit has a little pull-back, you can enter the short trade now or after pull-back.
This analysis is a continuation of yesterday's analysis.
gold and XAUUSD forecast
---------------------------------------------------------
Please write any advice or suggestions.
Dear friends, request any cryptocurrency pair, currencies pair for forex, and any index that you want to be analyzed and ask any questions.
Thanks for your attention

Gold- To resume its down move?After yesterday's low at 1720, Gold has started to correct the drop that started last week and has risen to an intraday high at 1745.
Now the precious metal looks ready to resume its down move and a drop to yesterday's low is probable.
I'm bearish as long as Gold is trading under 1750

Gold Finally Testing cup and handle supportGold rejected 21-EMA breakout and cloud base resistance
RSI sharply break down at 50 mark momentum is strong bearish

Gold forecast and ideaPlease write any advice or suggestions.
Dear friends, request any cryptocurrency pair, currencies pair for forex, and any index that you want to be analyzed and ask any questions.
Thanks for your attention