Gold Testing PRZ & Resistance Zone-Short Opportunity? Gold ( OANDA:XAUUSD ) moved according to yesterday's analysis and the position that was Risk-To-Reward:1.61 and hit the target of this position. Do you think Gold will continue its correction, or should we wait for the next gold rally to start?
Gold is trading in the Resistance zone($3,280-$3,245) near the Potential Reversal Zone(PRZ) , and the Resistance lines .
From a Classical Technical Analysis perspective , it seems possible that an Ascending Broadening Wedge Pattern could form.
Educational note : An Ascending Broadening Wedge is a bearish technical pattern characterized by higher highs and higher lows that expand over time. It signals increasing volatility and weakening bullish momentum, often leading to a breakdown below support.
In terms of Elliott Wave theory , Gold appears to be in corrective waves in the 15-minute time frame .
I expect Gold to decline at least to the Support lines again , at least I think you can find a good Risk-To-Reward in PRZ for short positions .
Note: If Gold touches $3,292 [ Worst Stop Loss(SL) ], we can expect further gains.
Gold Analyze ( XAUUSD ), 15-minute time frame.
Be sure to follow the updated ideas.
Do not forget to put a Stop loss for your positions (For every position you want to open).
Please follow your strategy; this is just my idea, and I will gladly see your ideas in this post.
Please do not forget the ✅' like '✅ button 🙏😊 & Share it with your friends; thanks, and Trade safe.
Goldsignal

XAUUSD/GOLD | 1H | SELL NOW Hello, everyone,
My gold target level is 3,190.0.
My friends, every single like from you is my biggest motivation to share my analysis.
Thank you very much to everyone who supports me with likes.

GOLD Correction Complete - Rally Toward $3,450 AheadOANDA:XAUUSD is trading within a well-defined ascending channel, signaling ongoing bullish momentum. The price has continued to respect the channel structure, printing higher highs and higher lows, a clear sign of an intact uptrend. The recent retracement represents a healthy correction, potentially setting the stage for another bullish leg.
Price is now approaching a key support zone, marked by the lower boundary of the channel and a previous demand area. If this zone holds, it may offer a strong re-entry opportunity for buyers. The projected upside target is $3,450, which aligns with both the midline of the ascending channel and a previous resistance level.
As long as the price remains above the support zone and the ascending trendline, the bullish scenario remains valid. A break below this level, however, could invalidate the setup and increase the likelihood of a deeper retracement.
Always confirm your setups and trade with a proper risk management.
Best of luck!

DeGRAM | GOLD trend line breakout📊 Technical Analysis
● Price printed successive lower highs (LH) inside the descending channel and has just broken back below the blue corrective trend‑line.
● Fresh acceptance under the 3 260 points to a slide toward the lower rail at 3 200, with scope to probe the March floor near 3 100; bias flips only on a 4 h close back above 3 300.
💡 Fundamental Analysis
● A hotter‑than‑expected US CPI (3.5 % y/y) lifted 10‑yr yields to 4.50 %, reviving bets that the Fed may delay cuts, which firmed the USD and spurred ETF outflows from bullion.
✨ Summary
Lower highs + rising US yields favour a short‑term short in XAU/USD: targets 3 200 → 3 100, risk managed above 3 300.
-------------------
Share your opinion in the comments and support the idea with a like. Thanks for your support!

Gold’s Short-Term Setup!!!Gold ( OANDA:XAUUSD ) started to fall today after the news " The United States has dropped its tariffs on Chinese goods to 30%, down from a brutal 145%, while China is slashing its own duties on US imports to just 10%, temporarily, for the next 90 days. "
Gold is moving near a Heavy Support zone($3,198-$3,136) .
In terms of Elliott wave theory , it appears that Gold has completed five downwaves , and we should expect Gold to rise at least to the Resistance zone($3,280-$3,245) .
It is possible that selling pressure on Gold will increase again with the opening of the US marke t. But this analysis is in the short term , and it is likely to hit Target before the US market opens.
The Bullish Engulfing Candlestick Pattern can also be a sign of Gold rising , at least in the short term .
I expect Gold to rise to at least $3,241.890.
Note: Stop Loss(SL): $3204.820
Gold Analyze ( XAUUSD ), 15-minute time frame.
Be sure to follow the updated ideas.
Do not forget to put a Stop loss for your positions (For every position you want to open).
Please follow your strategy; this is just my idea, and I will gladly see your ideas in this post.
Please do not forget the ✅' like'✅ button 🙏😊 & Share it with your friends; thanks, and Trade safe.

Gold Bounces After Fake Break — More Upside AheadGold ( OANDA:XAUUSD ) fell to the Support zone($3,280-$3,240) as I posted yesterday ( Full Target) .
Gold started to rise again after making a Fake Break below the Support lines .
Gold is trading above the Resistance zone($3,330-$3,320) .
In terms of Elliott Wave theory , it seems that Bitcoin completed the main wave C with the help of the Ending Diagonal .
Educational note : The Ending Diagonal in Classic Technical Analysis is the Falling Wedge Pattern .
I expect Gold to resume its bullish trend, at least for the short term , and to at least $3,356 .
Note: If Gold breaks the Support lines with high volume, we can expect further declines.
Note: Worst Stop Loss(SL) = $3,031
Gold Analyze ( XAUUSD ), 15-minute time frame.
Be sure to follow the updated ideas.
Do not forget to put a Stop loss for your positions (For every position you want to open).
Please follow your strategy; this is just my idea, and I will gladly see your ideas in this post.
Please do not forget the ✅' like '✅ button 🙏😊 & Share it with your friends; thanks, and Trade safe.

DeGRAM | GOLD held the support line📊 Technical Analysis
● OANDA:XAUUSD tagged the purple support line at $3 300 inside the green demand zone, then printed a bullish engulfing candle.
● Price is climbing within the rising‑channel mid‑band; reclaiming the black support level $3 360 should propel gold to the upper resistance level near $3 500. Long view void on a close below $3 200.
💡 Fundamental Analysis
● Fed Vice‑Chair Jefferson signalled rates are “sufficiently restrictive” amid cooling CPI base effects, pressuring real yields and the USD.
✨ Summary
Channel‑base rebound plus strong Asian demand and a dovish Fed backdrop support a short‑term long: targets $3 360 → $3 500; invalidate under $3 200.
-------------------
Share your opinion in the comments and support the idea with a like. Thanks for your support!

Gold's Bearish Momentum Builds from PRZ-Short SetupGold ( OANDA:XAUUSD ) started to decline exactly from PRZ (previous idea) as I expected in my previous idea . And with the loss of the Support zone($3,387-$3,357) we can expect further decline.
Gold is currently moving near the Resistance zone($3,387-$3,357 ) and the Potential Reversal Zone(PRZ) .
From the Elliott Wave theory , Gold appears to have completed a five-wave impuls e and we should expect corrective waves . Since the momentum of the second decline that broke the Support zone($3,387-$3,357) is high , the correction is expected to continue and Gold appears to be completing a pullback .
---------------------------------------------
The US Unemployment Claims Index was also released a few minutes ago, and let's take a look and examine the possible impact on Gold .
This better-than-expected data confirms a stronger U.S. labor market , reducing the urgency for the Fed to cut rates anytime soon .
Impact on Gold :
A resilient job market supports the hawkish stance of the Fed , which could keep downward pressure on Gold in the short term as yields and the dollar remain firm.
However, traders should remain cautious and watch for upcoming data and Fed commentary, which could shift the tone.
---------------------------------------------
I expect Gold to start falling from Potential Reversal Zone(PRZ) to the targets I have indicated on the chart. The first target could be around $3,319 .
Note: If Gold touches $3,401(the worst Stop Loss(SL)), we can expect the resistance lines to break and gold to rise further.
Gold Analyze ( XAUUSD ), 1-hour time frame.
Be sure to follow the updated ideas.
Do not forget to put a Stop loss for your positions (For every position you want to open).
Please follow your strategy; this is just my idea, and I will gladly see your ideas in this post.
Please do not forget the ✅' like '✅ button 🙏😊 & Share it with your friends; thanks, and Trade safe.

Gold Potential Bullish ContinuationGold price still seems to exhibit signs of potential Bullish momentum as the price action may form a credible Higher Low with multiple confluences through key Fibonacci and Support levels which presents us with a potential long opportunity.
Trade Plan:
Entry : 3389.8
Stop Loss : 3345
TP 0.9 - 1 : 3430 - 3434

DeGRAM | GOLD has reached the channel boundary📊 Technical Analysis
● Chart shows a bullish breakout from the falling wedge into a rising channel. Support near $3,300 held firm, and price is now above the $3,360 pivot, eyeing the $3,430–$3,500 resistance zone. Oscillators on daily chart remain positive, reinforcing the upward bias.
💡 Fundamental Analysis
● Global uncertainty is fueling safe-haven demand: tensions in Ukraine, the Middle East and renewed US-China trade fears are supporting gold.
● A softer US dollar and policy uncertainty also boost bullion; analysts note continued demand keeping prices elevated above $3,000.
● Bank of America highlights that US trade-policy uncertainty will “lend support” to gold prices.
✨ Summary
Upside momentum remains strong, with key support around $3,300–$3,360. Gold’s long bias points toward ~$3,500 in the short term, underpinned by geopolitical risks and a weak dollar.
-------------------
Share your opinion in the comments and support the idea with a like. Thanks for your support!

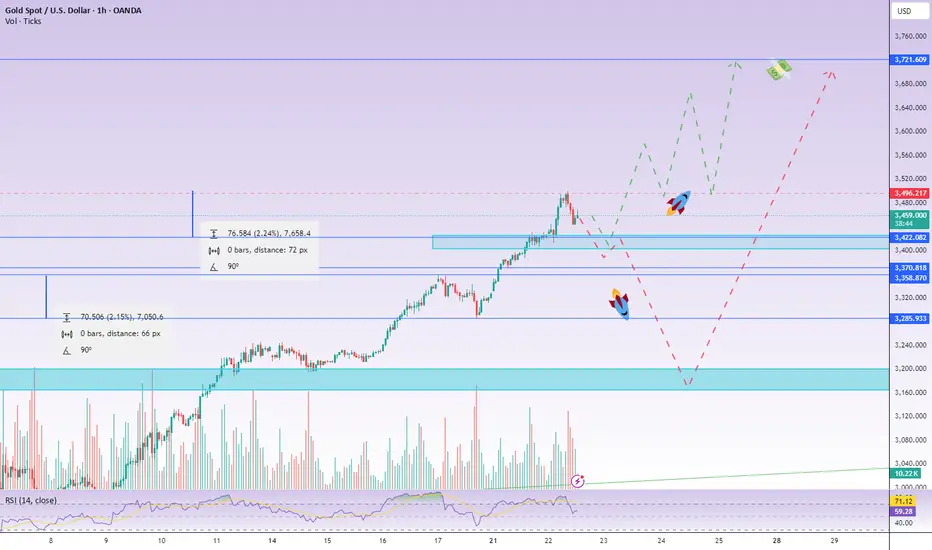
Gold Rally Running Out of Steam? PRZ May Trigger Drop!Gold ( OANDA:XAUUSD ) has hit the targets as I shared with you in yesterday's idae . Will this uptrend of the past 5-6 days continue?
Gold seems to have broken through the Resistance zone($3,387-$3,357) and has been moving in an Ascending Channel for the past 5 days .
In terms of Elliott Wave theory , Gold appears to be completing microwave 5 of the main wave 3 . The end of the main wave 3 can be at the Potential Reversal Zone(PRZ) .
Also, expect to see a clear Regular Divergence(RD-) between Consecutive Peaks at the Resistance zone($3,434-$3,406) .
I expect Gold to start declining from the Potential Reversal Zone(PRZ) and at least to the lower line of the ascending channel . This analysis is against the main trend, so pay more attention to money management .
Note: If Gold touches $3,448(Stop Loss(SL)), we can expect more pumps.
Note: If Gold falls below $3,342, we can expect a deeper decline than expected.
Gold Analyze ( XAUUSD ), 1-hour time frame.
Be sure to follow the updated ideas.
Do not forget to put a Stop loss for your positions (For every position you want to open).
Please follow your strategy; this is just my idea, and I will gladly see your ideas in this post.
Please do not forget the ✅' like '✅ button 🙏😊 & Share it with your friends; thanks, and Trade safe.

DeGRAM | GOLD Finished Correcting?📊 Technical Analysis
● After two successful touches of rising-channel support near $3 200, XAU/USD pierced the resistance line and the triangle, confirming a bullish breakout.
● A pattern of higher lows now projects a fresh impulse toward the channel top at ~$3 500.
💡 Fundamental Analysis
● Goldman Sachs forecasts central banks will keep buying bullion amid recession fears, driving gold to $3 700 by year-end.
● Traders price in ~80 bp of Fed rate cuts from July, lowering real yields and bolstering gold’s appeal.
✨ Summary
Channel breakout + strong CB demand and Fed-cut bets support a short-term long bias: a clear break above $3 315 targets $3 500; view invalid below $3 200.
-------------------
Share your opinion in the comments and support the idea with a like. Thanks for your support!

DeGRAM | GOLD Broke the Rising Channel📊 Technical Analysis
● Break below the rising channel and $3 290 support; failed retest inside the $3 320-3 260 supply creates a descending structure—targets sit at $3 200, then $3 000.
● 4-hour RSI bearish divergence and a sequence of lower highs confirm momentum has flipped to the downside.
💡 Fundamental Analysis
● Dollar Index rebounds (+0.27 %) on auto-tariff-relief headlines, boosting risk appetite and trimming haven demand.
● Yahoo Finance reports gold sliding as a stronger USD and tariff reprieve trigger profit-taking.
✨ Summary
Channel break + USD strength favour a short XAU/USD view: objectives $3 200 → $3 000; invalidation above $3 360.
-------------------
Share your opinion in the comments and support the idea with a like. Thanks for your support!

GoldXau usd daily analysis
Time frame 4hours
Risk rewards ratio =2
I think we can have good benefits in this time
Gold is moving up and down a d we can open long position in the position close to support line

DeGRAM | GOLD Held the Channel📊 Technical Analysis
● Gold is basing at $3 290; defending this demand band keeps $3 500 – 3 520 viable.
💡 Fundamental Analysis
● Goldman raised its year-end target to $3 700 on robust demand.
✨ Summary
Fundamentals are in line with chart support, favoring a bounce towards $3 500 - $3 520 while maintaining $3 290.
-------------------
Share your opinion in the comments and support the idea with a like. Thanks for your support!

DeGRAM | GOLD Held Support Level📊 Technical Analysis
Gold’s slide paused at $3 315; holding here keeps $3 500 – 3 520 in play.
💡 Fundamental Analysis
• PBoC has been buying for 5 months in a row.
• WGC expects strong demand from central banks in 2025.
• Trade wars, tensions in the Middle East and South Asia are causing risks that are increasing demand for gold.
• IMF warns new tariffs could slow growth, boosting safe-haven bids.
• Western ETFs had bought ≈240 t by mid-April.
• DXY is at 3-year lows and yields are down.
✨ Summary
Strong central-bank buying, renewed ETF inflows, softer USD yields and rising geopolitical risk align with chart support, favouring a rebound toward $3 500 – 3 520 while $3 315 holds.
-------------------
Share your opinion in the comments and support the idea with a like. Thanks for your support!

Gold’s ATH Rally Slowing Down – Needs Correction!!!Gold ( OANDA:XAUUSD ) has been on a strong uptrend in recent weeks , creating a new All-Time High(ATH) almost every day. Will a new ATH be created after $3,500 in the coming days? What do you think?
Gold is moving between the Resistance zone($3,386-$3,357) and Support zone($3,282-$3,245) .
In terms of Elliott Wave theory , it seems that Gold has started to form Corrective Waves after recording the latest ATH . Gold is completing a Zigzag Correction wave (ABC/5-3-5) ( most likely ).
I expect Gold to start declining again after approaching the Resistance zone($3,386-$3,357) and attack the Support lines and Support zone($3,282-$3,245) . It seems like Gold needs a correction , do you agree with me!? In the worst-case scenario for my analysis, Gold starts falling from the resistance zone($3,431-$3,406) .
Note: If Gold can move above $3,440, we can expect more pumps and maybe make na ew All-Time High(ATH).
Gold Analyze ( XAUUSD ), 1-hour time frame.
Be sure to follow the updated ideas.
Do not forget to put a Stop loss for your positions (For every position you want to open).
Please follow your strategy; this is just my idea, and I will gladly see your ideas in this post.
Please do not forget the ✅' like '✅ button 🙏😊 & Share it with your friends; thanks, and Trade safe.

DeGRAM | GOLD Reached the Support📊 Technical Analysis
Gold’s false pop above $3 500 reversed into a falling wedge; price slipped through $3 430 and is now testing the support level at $3 315 (channel base + trend-line). Holding this pivot preserves the rising channel and favors a rebound toward $3 500 – 3 520.
💡 Fundamental Analysis
Central-bank demand stays brisk (333 t Q4-24; PBoC buying streak now 5 mths). Fed pause, softer real yields and a 3-yr-low USD cut carry costs. IMF warns tariff risks could chill growth, boosting hedge bids.
✨ Summary
A hold above $3 315 could launch XAU/USD back to $3 500+, with $3 520 on a clean breakout.
-------------------
Share your opinion in the comments and support the idea with a like. Thanks for your support!

Gold’s Super Bullish Breakout – Eyeing $3700 or $3200?My previous analysis played out very well, except I was concerned that we didn't reach the $3,180 area. With the ongoing trade wars and recent comments from Powell, the USD is weakening significantly, and we’re seeing a gold move unlike any I’ve experienced before—possibly the most bullish pattern yet.
Based on my analysis from the edge of the market, we can identify key breakout levels that must hold to continue pushing toward $3,700.
Watch the 1H and 4H wick and body formations:
1. If the 1H candle body can break above $3,500, we’ll likely continue making higher highs and higher lows toward $3,700.
2. If the 1H candle body fails to hold the $3,400 level, we might see the pullback I’ve been anticipating—possibly down to the $3,200 level >> and pullback towards $3700.
DeGRAM | GOLD Preparing to Take $3520📊 Technical Analysis
Gold couldn’t clear $3 500 and is drifting toward $3 430 support.
💡 Fundamental Analysis
Central banks keep buying— 333 t in Q4 ’24 and still rising in April ’25.
The dollar just hit a 3‑yr low on Fed‑credibility fears.
Real yields have slipped, restoring gold’s carry appeal.
IMF warns tariff tensions could chill growth, fuelling hedge demand.
Street targets climb: GS sees $3 700–4 500, JPM $3 000+.
✨ Summary
Technicals flag a pullback, yet fresh central‑bank demand, a weaker USD, lower real yields and escalating trade risks add upside torque—any bounce off $3 430 could retest $3 520.
-------------------
Share your opinion in the comments and support the idea with a like. Thanks for your support!

Gold at PRZ Again – Correction to $3,227 Possible!!!Gold ( OANDA:XAUUSD ) started to rise as I expected in the previous idea and created a new All-Time High(ATH) as usual . How long do you think the upward trend of Gold will continue!? ( Please give your reasons for the rise, I would appreciate it. )
Gold is trading near the Potential Reversal Zone(PRZ) and trying to break the Uptrend line .
In terms of Elliott Wave theory , it appears that Gold has completed another 5-wave impulsive .
Signs of the completion of the main wave 5 can be the presence of Regular Divergence(RD-) between Consecutive Peaks, and the break of the Uptrend line (validly) .
I expect Gold to fall to $3,227 in the coming hours.
Note: If Gold can move above $3,420, we can expect more pumps.
Gold Analyze ( XAUUSD ), 1-hour time frame.
Be sure to follow the updated ideas.
Do not forget to put a Stop loss for your positions (For every position you want to open).
Please follow your strategy; this is just my idea, and I will gladly see your ideas in this post.
Please do not forget the ✅' like '✅ button 🙏😊 & Share it with your friends; thanks, and Trade safe.

DeGRAM | GOLD Slows Under Resistance📊 Technical Analysis
GOLD failed to break out above the resistance line near $3 400 and is retreating from overbought levels; low volatility signals weakening momentum and a likely pullback toward support around $3 325.
💡 Fundamental Analysis
Short-term macro drivers also tilt bearish. Rising U.S. Treasury yields are making gold less attractive, while hawkish Fed signals fueled by strong U.S. data have strengthened the dollar.
✨ Summary
Technical and fundamental factors point to a short-term bearish correction in XAUUSD.
-------------------
Share your opinion in the comments and support the idea with a like. Thanks for your support!

DeGRAM | GOLD Anchored Above the Channel📊 Technical Analysis
GOLD trades within an ascending channel, holding above $3 285 support.
A breakout from a triangle confirms bullish momentum. Key targets are $3 360 - $3 380.
💡 Fundamental Analysis
Demand is rising amid safe-haven flows, Chinese insurer interest, and central bank buying. A weaker USD and US - China tensions support gold.
✨ Summary
Technical breakout and strong fundamentals favor XAUUSD growth. Holding above $3 285 keeps the path open to $3 360.
-------------------
Share your opinion in the comments and support the idea with a like. Thanks for your support!
