Gold’s Uptrend Strong, But Is a Short-Term Drop Coming?Gold ( OANDA:XAUUSD ) has increased by more than +5% over the past seven days and has managed to create new All-Time High(ATH) daily. The reasons for the increase in Gold prices include US economic statistics and the tensions in the Middle East that have increased these days.
The question is how long this bullish trend in Gold will continue. It seems that Gold needs at least a correction to continue its upward trend and I tried to find the starting zone of the correction with technical analysis tools (for the short term ).
Gold is moving near the Potential Reversal Zone(PRZ) , this zone could be a correction zone for Gold for at least the short term .
Gold also responds well to the Pitchfork tool lines , the Pitchfork lines can be considered as support and resistance lines for gold .
From an Elliott Wave theory perspective, Gold appears to be completing microwave 5 of main wave 5 (these five waves are likely to be part of main wave 3 ).
Also, we can see the Regular Divergence(RD-) between Consecutive Peaks .
I expect Gold to drop to at least $3,003 after breaking the Uptrend line , and my second target is $2,986 .
Note: The worst Stop Loss(SL) for your Short position could be $3,061.
Gold Analyze ( XAUUSD ), 2-hour time frame.
Be sure to follow the updated ideas.
Do not forget to put a Stop loss for your positions (For every position you want to open).
Please follow your strategy; this is just my idea, and I will gladly see your ideas in this post.
Please do not forget the ✅' like '✅ button 🙏😊 & Share it with your friends; thanks, and Trade safe.
Goldsignal

Gold is Pulling Back to Support lines & PRZ – Another Rally!?As I expected in my previous post , Gold ( OANDA:XAUUSD ) finally touched Potential Reversal Zone(PRZ) (of course with a lot of volatility).
From Elliott Wave theory , Gold appears to have completed the main wave 3 and is currently completing the main wave 4 . The main wave 4 is likely to end near the Support lines and Potential Reversal Zone(PRZ) .
I expect Gold to attack Potential Reversal Zone(PRZ) at least once more after completing the main wave 4 .
Can Gold make a new All-Time High(ATH) or Correction?
Note: There is also a possibility that the main wave 5 is a truncated wave because in PRZ we have the $3,000 round number.
Note: If Gold falls below $2,940, we can expect further declines.
Gold Analyze ( XAUUSD ), 1-hour time frame.
Be sure to follow the updated ideas.
Do not forget to put a Stop loss for your positions (For every position you want to open).
Please follow your strategy; this is just my idea, and I will gladly see your ideas in this post.
Please do not forget the ✅' like '✅ button 🙏😊 & Share it with your friends; thanks, and Trade safe.

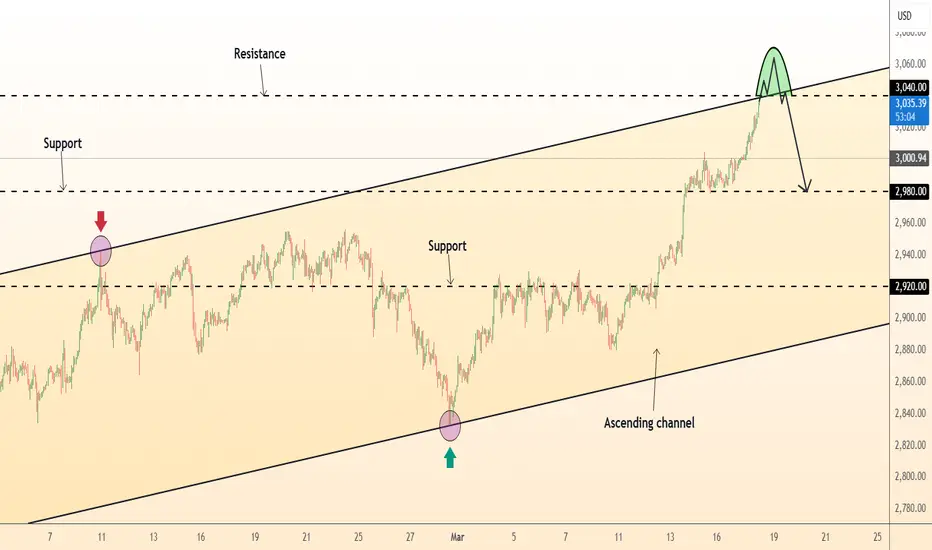
DeGRAM | GOLD reached the resistance levelGOLD has reached the upper boundary of the channel and resistance level.
The indicators indicate that the asset is overbought.
A bearish divergence is forming on the 1H Timeframe.
We expect a pullback.
-------------------
Share your opinion in the comments and support the idea with a like. Thanks for your support!
DeGRAM | GOLD hit $3000GOLD is in an ascending channel above the trend lines.
The price is moving from the lower boundary of the channel.
The chart has consolidated above the upper trend line.
We expect the growth to continue until reaching the upper boundary of the channel.
-------------------
Share your opinion in the comments and support the idea with a like. Thanks for your support!

DeGRAM | GOLD continues to growGOLD is in an ascending channel above the trend lines.
The price is moving from the dynamic support and has already broken the resistance level.
We expect XAUUSD to continue rising towards $3000.
-------------------
Share your opinion in the comments and support the idea with a like. Thanks for your support!

DeGRAM | GOLD has consolidated above the trend lineGOLD is above the descending channel and trend lines.
After a false break of the support level, the price has reached the lower trend line and 50% retracement level, which coincides with the previous rebound points.
The chart has consolidated above the upper trend line.
We expect the growth to continue.
-------------------
Share your opinion in the comments and support the idea with a like. Thanks for your support!

XAUUSD Analysis todayHello traders, this is a complete multiple timeframe analysis of this pair. We see could find significant trading opportunities as per analysis upon price action confirmation we may take this trade. Smash the like button if you find value in this analysis and drop a comment if you have any questions or let me know which pair to cover in my next analysis.

DeGRAM | GOLD squeezed by trend linesGOLD is near the upper boundary of the descending channel between the trend lines.
The price is moving from the dynamic support.
The chart is holding above the 38.2% retracement level.
We expect the price growth to continue.
-------------------
Share your opinion in the comments and support the idea with a like. Thanks for your support!

DeGRAM | GOLD came out of a downward channelGOLD is above the descending channel between the trend lines.
The price is moving from the lower boundary of the channel where it formed a bullish takeover.
The chart held above the 38.2% retracement level and also formed a bullish flag before breaking the upper channel boundary.
We expect XAUUSD to rise after consolidating above the dynamic resistance.
-------------------
Share your opinion in the comments and support the idea with a like. Thanks for your support!

DeGRAM | GOLD is holding under the supply zoneGOLD is under an ascending channel between trend lines, under the supply zone.
The price is moving from the dynamic resistance.
The chart is holding under the lower boundary of the supply zone, which coincides with the 78.6% retracement level.
The previous week was ended with a bearish takeover formation.
We expect XAUUSD to continue its decline.
-------------------
Share your opinion in the comments and support the idea with a like. Thanks for your support!

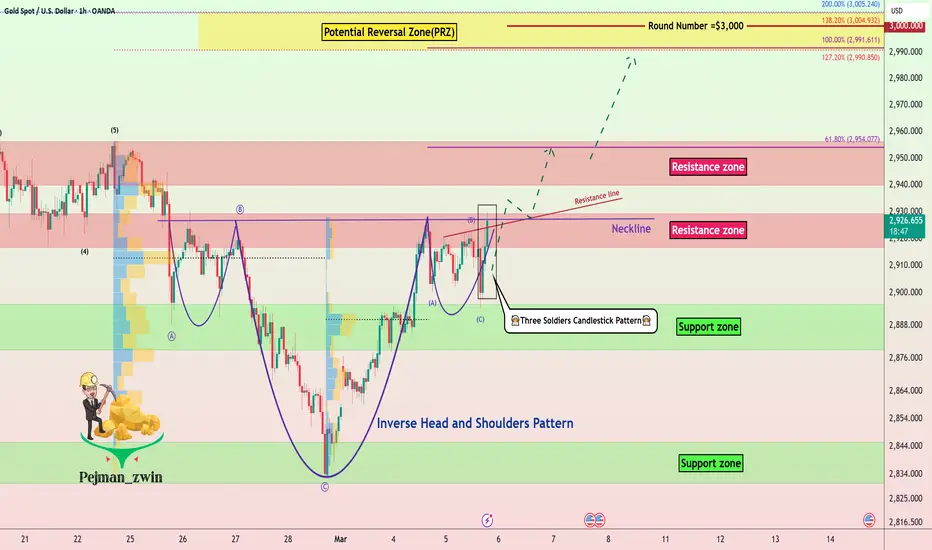
Gold’s Three Soldiers Pattern Signal: A Strong Rally Ahead?Gold ( OANDA:XAUUSD ) is breaking the Resistance zone($2,930-$2,916) and the Neckline of the Inverse Head-and-Shoulders Pattern .
According to the Elliott wave theory, the Zigzag Correction(ABC/5-3-5) is over, and we must wait for the next impulse wave .
Also, the Three Soldiers Candlestick Pattern is a good sign to break the Resistance zone($2,930-$2,916) and neckline .
I expect Gold to rise to at least $2,953 , if the Resistance zone($2,957-$2,940) is broken, we should wait for Gold to rise to the Potential Reversal Zone(PRZ) .
Do you think Gold can make a new All-Time High(ATH)?
Note: If Gold goes below $2,887, it should expect more gold Dumps.
Gold Analyze ( XAUUSD ), 1-hour time frame.
Be sure to follow the updated ideas.
Do not forget to put a Stop loss for your positions (For every position you want to open).
Please follow your strategy; this is just my idea, and I will gladly see your ideas in this post.
Please do not forget the ✅' like '✅ button 🙏😊 & Share it with your friends; thanks, and Trade safe.
Gold's Resistance Battle: Breakout or Reversal?Gold ( OANDA:XAUUSD ) is moving near the Resistance zone($2,896-$2,878) .
According to the theory of Elliott waves , Gold seems to have succeeded in completing microwave 5 .
Also, we can see the Regular Divergence(RD-) between Consecutive Peaks .
I expect Gold to go down at least pivot points after breaking the Uptrend line , and in the next stage , the Support zone($2,845-$2,830) can be the next target .
Note: If Gold can go over the Resistance zone($2,896-$2,878), we can expect more pumps.
Gold Analyze ( XAUUSD ), 15-minute time frame.
Be sure to follow the updated ideas.
Do not forget to put a Stop loss for your positions (For every position you want to open).
Please follow your strategy; this is just my idea, and I will gladly see your ideas in this post.
Please do not forget the ✅' like '✅ button 🙏😊 & Share it with your friends; thanks, and Trade safe.

DeGRAM | GOLD local oversoldGOLD is under an ascending channel between trend lines.
The price is moving from the lower trend line and support level.
Indicators on small timeframes indicate oversold.
We expect that XAUUSD after consolidation above the support may bounce to $2900, which coincides with the 62% retracement level.
-------------------
Share your opinion in the comments and support the idea with a like. Thanks for your support!

DeGRAM | GOLD retest of the supply areaGOLD is in an ascending channel below the trend lines.
Indicators are out of the oversold zone.
The price is moving from the upper boundary of the channel.
The chart is holding under the supply zone and 38.2% retracement level.
XAUUSD will continue to decline.
-------------------
Share your opinion in the comments and support the idea with a like. Thanks for your support!

GOLD, Will the correction continue or not ??Hello Traders, Hope you are doing great.
As you can see below this post, We expected a correction in GOLD yesterday because it was forming a Rising Wedge Reversal pattern. The price corrected about 500 pips and then it began to retrace to 61.8 Fibo level. But what happens now? will the correction continue or not ?
The answer of this question is a Hesitant Yes, it will probably continue its downward correction, but PCE data that comes Friday can change everything, so Don't forget to use proper risk management. and Remember that these kind of corrections are temporary and gold price will probably see higher price this year
and finally tell me What are your thoughts about GOLD ? UP or DOWN ? comment your opinion below this post.

DeGRAM | GOLD working out a rising wedgeGOLD is in an ascending channel between trend lines, in a range of $2877 to $2940.
The price is moving from the upper boundary of the channel and has already dropped below the dynamic support.
We expect the decline to continue after consolidation under $2877.
-------------------
Share your opinion in the comments and support the idea with a like. Thanks for your support!

DeGRAM | GOLD is pressing the trend lineGOLD is in an ascending channel between the trend lines.
Chart volatility has decreased
The price is moving from the upper boundary of the channel and is forming an ascending wedge.
We expect a pullback after consolidation under the dynamic support.
-------------------
Share your opinion in the comments and support the idea with a like. Thanks for your support!

Head & Shoulders Pattern Forming – Gold Breakdown Soon?Gold ( OANDA:XAUUSD ) is currently near the Resistance zone($2,948-$2,940) . Gold attacked the Resistance zone($2,948-$2,940) several times but failed to break it and even created a Bull Trap .
Regarding Classical Technical Analysis , Gold seems to be completing the Head and Shoulders Pattern . If Gold reaches the Neckline of this pattern , it seems to succeed in breaking it. One of the signs of the validity of the Head and Shoulders Pattern is to see a Regular Divergence(RD-) between the two shoulders, which we see here.
According to the theory of Elliott waves , Gold seems to have succeeded in completing corrective waves. The structure of correction waves is Double Three Correction(WXY) .
I expect Gold to reach the Neckline of the Head and Shoulders Pattern in the coming hours, and if it breaks , it will drop to at least $2,901 .
Note: If Gold can go over the Resistance zone($2,948-$2,940), we can expect more pumps.
Note: If Gold touches $2,934, we can hope for a drop.
Do you think that Gold succeeds in forming a new All-Time High(ATH) or does it need to be corrected?
Be sure to follow the updated ideas.
Gold Analyze ( XAUUSD ), 30-minute time frame.
Do not forget to put Stop loss for your positions (For every position you want to open).
Please follow your strategy; this is just my idea, and I will gladly see your ideas in this post.
Please do not forget the ✅' like '✅ button 🙏😊 & Share it with your friends; thanks, and Trade safe.

DeGRAM | GOLD pullback from resistanceGOLD is in an ascending channel between the trend lines.
The price is moving from the upper trend line and resistance level.
The chart formed a bearish engulfment during the resistance retest.
We expect the pullback to continue.
-------------------
Share your opinion in the comments and support the idea with a like. Thanks for your support!

Gold’s Bull Trap? Major Reversal Incoming!As I expected in yesterday's post , Gold ( OANDA:XAUUSD ) started to rise from the Support zone($2,919-$2,905) and bounced exactly on my hypothesized lines , and I hope you were able to profit.
Gold failed to break the Resistance zone($2,948-$2,940) . And it appears to have created a Bull Trap .
In terms of the Elliott wave theory , Gold seems to have completed the main wave 5 , and one of the signs for me was the Bull Trap .
I expect Gold to fall to at least the Support zone($2,919-$2,905) after breaking the Uptrend lines . ( Next targets are also possible ).
Note: If Gold can go over the Resistance zone, we can expect more pumps.
Be sure to follow the updated ideas.
Gold Analyze ( XAUUSD ), 30-minute time frame.
Do not forget to put Stop loss for your positions (For every position you want to open).
Please follow your strategy; this is just my idea, and I will gladly see your ideas in this post.
Please do not forget the ✅' like '✅ button 🙏😊 & Share it with your friends; thanks, and Trade safe.

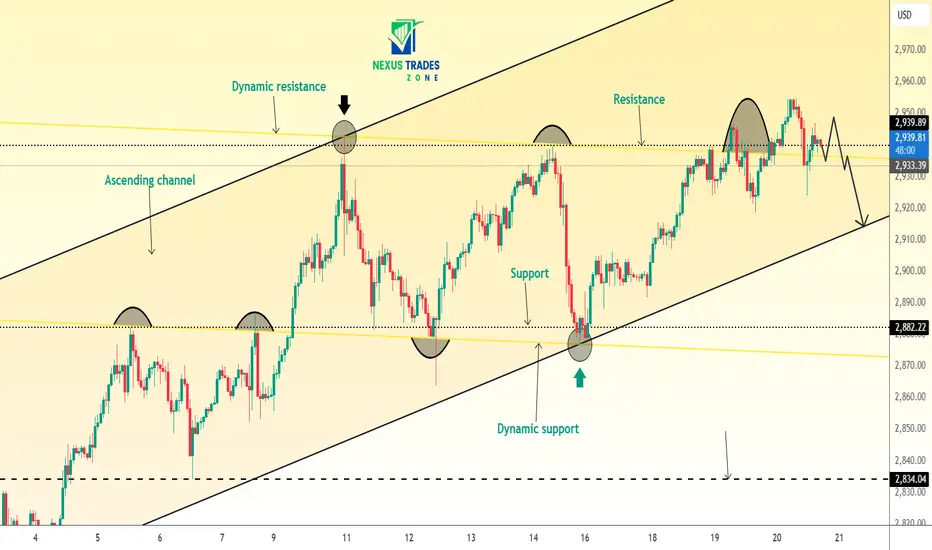
Gold Analysis – Ascending Channel with Resistance RejectionGold (XAU/USD) Analysis – Ascending Channel with Resistance Rejection 📉
📊 Timeframe: 4H
💰 Current Price: $2,939
📈 Trend: Uptrend within an ascending channel
Market Overview:
Gold is currently trading inside an ascending channel, respecting both dynamic support and resistance. However, the price has shown multiple rejections at the resistance zone, indicating a potential pullback.
Key Levels to Watch:
✅ Resistance Zone: $2,950 - $2,960 (Strong rejection area)
✅ Support Levels: $2,920 (Dynamic support), $2,882 (Major support)
✅ Critical Breakdown Level: Below $2,882 could signal a deeper correction
Technical Pattern:
🔹 Double Top Formation at Resistance: Price failed to break higher, showing a bearish reaction.
🔹 Dynamic Support Retest: The price could test the ascending channel support near $2,920.
🔹 Lower Highs Forming: A sign of weakening bullish momentum.
Trade Plan:
🔹 Bearish Scenario:
If price rejects the resistance again, expect a pullback towards $2,920 - $2,910.
A breakdown below the ascending channel could trigger a drop to $2,882 or lower.
🔹 Bullish Scenario:
If price holds above $2,920, bulls may attempt another breakout towards $2,960+.
DeGRAM | GOLD retest of the dynamic resistanceGOLD is in an ascending channel above the trend lines.
The price is testing the resistance level and the trend line, which held it back during the last week.
The indicators on the 1H Timeframe indicate the formation of a bearish divergence.
We expect a decline.
-------------------
Share your opinion in the comments and support the idea with a like. Thanks for your support!

Gold in Correction Mode – How Low Can It Go!?As I expected in the previous post , Gold ( OANDA:XAUUSD ) started to decline from the Potential Reversal Zone(PRZ) and with good momentum .
Gold is moving near the Resistance zone($2,916-$2,905) and the 100_SMA(1-hour) . 100_SMA(1-hour) was an important support for Gold so that every time Gold hit this moving average, it started to increase.
Also, Gold's movements seem to be corrective since the market opened .
According to the theory of Elliott waves , it seems that Gold is in Corrective Waves , and according to Gold's falling momentum , it is possible that Gold will have a Zigzag Correction(ABC/5-3-5) in front of it.
In addition, if you look at the Gold chart in the 4-hour or Daily time frame , you will notice that there is a possibility of Adam & Adam Double Top Pattern(AADT) .
I expect Gold to attack at least the Support zone($2,890-$2,879) in the coming hours, and if this zone breaks , we should wait for Gold to drop to at least $2,865 .
Note: If Gold can go above 100_SMA(1-hour) again, or rather, if Gold touches $2,920, we should expect more pumps.
Be sure to follow the updated ideas.
Gold Analyze ( XAUUSD ), 1-hour time frame.
Do not forget to put Stop loss for your positions (For every position you want to open).
Please follow your strategy; this is just my idea, and I will gladly see your ideas in this post.
Please do not forget the ✅' like '✅ button 🙏😊 & Share it with your friends; thanks, and Trade safe.
