GOLD (XAUUSD): 2 Strong Bullish Patterns
As I warned you earlier, Gold is resuming a growth.
After completing a bullish accumulation, the price
is currently breaking both a neckline of an ascending triangle
and an inverted head and shoulders formation on a 4H.
I think that the price will rise more and reach 3320 resistance soon.
❤️Please, support my work with like, thank you!❤️
I am part of Trade Nation's Influencer program and receive a monthly fee for using their TradingView charts in my analysis.
Goldsignals

Gold rebound height is limited, short goldTechnical aspects:
Gold has failed to make a major breakthrough in the recent rebound process, and the rebound height has been limited to a smaller and smaller level. Overall, gold is now in a state of shock and short position; as the center of gravity of gold shifts downward, the current short-term resistance is in the 3220-3230 area; and gold has tested downward many times recently, which makes it easier for gold to fall below 3200. Once gold falls below 3200 again, it is very likely to extend to 3190, or even around 3160.
Trading strategy:
Consider starting to short gold in batches in the 3220-3230 area, TP: 3205-3195


XAU/USD: More Bullish Move Ahead? (READ THE CAPTION)By analyzing the gold chart on the 2-hour timeframe, we can see that after our last analysis, the price dropped to $3120, and then faced strong buying pressure, pushing it back up to the $3240 area! Gold is now trading in a critical zone for trend direction. If the price manages to hold above $3233, we can expect further bullish movement. This analysis will be updated with your support!
Please support me with your likes and comments to motivate me to share more analysis with you and share your opinion about the possible trend of this chart with me !
Best Regards , Arman Shaban

XAUUSDHello Traders! 👋
What are your thoughts on GOLD?
After a powerful bullish rally since the beginning of 2025, gold has entered a corrective phase
In the current price zone, we expect a temporary upward retracement, potentially offering short-term relief, before the downtrend resumes.
For a safer bearish entry, it's recommended to wait for a confirmed break below both the marked support zone and the ascending trendline to validate continuation to lower levels.
Don’t forget to like and share your thoughts in the comments! ❤️

XAUUSD and USDCAD Analysis todayHello traders, this is a complete multiple timeframe analysis of this pair. We see could find significant trading opportunities as per analysis upon price action confirmation we may take this trade. Smash the like button if you find value in this analysis and drop a comment if you have any questions or let me know which pair to cover in my next analysis.

Bullish Inflation Data Fuels Gold Rebound — Impulsive Waves!?Gold ( OANDA:XAUUSD ) started to fall from the Resistance zone($3,280-$3,245) as I expected in the previous idea , but 50_SMA(Daily) and Support lines were able to hold Gold .
----------------------------------
Today, key U.S. economic data was released:
Core PPI m/m: -0.4% (vs. 0.3% forecast)
Core Retail Sales m/m: 0.1% (vs. 0.3% expected)
PPI m/m: -0.5% (vs. 0.2% forecast)
Retail Sales m/m: 0.1% (in line)
Unemployment Claims: 229K (as expected)
Outlook :
The weaker-than-expected inflation data, especially the PPI figures, indicate easing inflationary pressures. This may increase expectations for potential Fed rate cuts, which generally supports gold as a non-yielding asset.
Conclusion :
Today’s data is overall bullish for gold. Watch for continued upside if sentiment shifts further toward dovish Fed expectations. However, keep an eye on upcoming Fed commentary for confirmation.
----------------------------------
Gold is moving above the Heavy Support zone($3,200-$3,136) and has managed to break the Resistance lines .
In terms of Elliott Wave theory , Gold seems to have completed the corrective waves , and we can expect the start of an impulsive wave . Breaking the Resistance zone($3,280-$3,245) can be a good sign for the start of an impulsive wave and a gold pump .
I expect Gold to start rising again after a pullback to the Resistance lines(broken) , probably from the Fibonacci Levels inside the chart , and attack the Resistance zone($3,280-$3,245) .
Note: If Gold touches $3,154 , we can expect more dumps.
Gold Analyze ( XAUUSD ), 1-hour time frame.
Be sure to follow the updated ideas.
Do not forget to put a Stop loss for your positions (For every position you want to open).
Please follow your strategy; this is just my idea, and I will gladly see your ideas in this post.
Please do not forget the ✅' like '✅ button 🙏😊 & Share it with your friends; thanks, and Trade safe.

THE KOG REPORTTHE KOG REPORT:
In last week’s KOG Report we said we would be looking for the price to attempt the higher resistance level shown on the chart which was slightly higher than the red box. We wanted this level to reject price and give us the move down into the level which was shown on the chart. As you can see this move worked from the open, respecting the red box active level instead and completing all the bias level bearish targets in one swoop after the break.
We then updated the KOG Report with the move we wanted in order to then long into immediate resistance to again test the short trade, which again worked while we suggested traders look for the lower red box levels to attempt the long trades.
There was slight stretch again downside, but those red boxes played their part giving us the move on confirmation for the longs towards the end of the week, ending the week on a high.
It was a difficult week to trade with aggressive movement across the markets, however, the levels are reacting well and although there is a stretch on price, we’re getting the movement we want.
So, what can we expect in the week ahead?
We have key level now on the daily also aligning with the EMA50 at 3162 on the daily chart, while that 4H shows us a possible reversal on the flip. For this reason we have given the immediate red box levels of 3225-30 resistance and 3190-85 support. We have also plotted the potential range of play for the early part of the week, where we feel price may stabilise until a further move.
We’re looking for two possible moves here, one in order to continue to short and then look for the longer trade lower down, or, a break of the red box and bias level into higher resistance upon which we’ll trade level to level and then look higher for a potential short again. The bias level for this week has a huge extension of the move so it will be tradeable both directions. We have applied filters to the algo which is under test so we’ll also want to see if that works in our favour.
So, for now, support below can give us the move into the 3225-30 region which is the level to watch for the break, if rejected there may be an opportunity to short but that short must break below the 3185 level to continue and complete the move downside into the 3150-55 and below that 3130 levels. That’s where we feel the opportunity to long for the swing may come from but please remember, it’s changed structure until we break and hold above the 3265 level. That will be this week’s key level.
KOG’s bias of the week:
Bearish below 3235 with targets below 3196, 3185, 3177, 3165 and 3155
Bullish on break of 3230 with targets above 3242, 3250, 3255 and 3262
RED BOXES:
Break above 3210 for 3118, 3220, 3225, 3230, 3235 and 3247 in extension of the move
Break below 3195 for 3187, 3179, 3165, 3155, 3150 and 3137 in extension of the move
Please do support us by hitting the like button, leaving a comment, and giving us a follow. We’ve been doing this for a long time now providing traders with in-depth free analysis on Gold, so your likes and comments are very much appreciated.
As always, trade safe.
KOG

XAUUSD Targeting the 1D MA100.When we looked at Gold (XAUUSD) on May 05 (see chart below), we called for a strong sell on the 1D MA50 (blue trend-line) and a 3155 Target:
Now that this target was hit and the 1D MA50 broke, we expect a short-term bearish continuation, as the last 3 times the price broke below the 1D MA50, it always hit the 1D MA100 (green trend-line).
Still, all candles since the test closed above the 1D MA50 so we need to seek a confirmation of the bearish continuation and that is the 4H MA50 (red trend-line). If rejected there, expect an instant drop. If not, the last Resistance is the top of the Channel Down. In both cases, our short-term Target is 3060.
-------------------------------------------------------------------------------
** Please LIKE 👍, FOLLOW ✅, SHARE 🙌 and COMMENT ✍ if you enjoy this idea! Also share your ideas and charts in the comments section below! This is best way to keep it relevant, support us, keep the content here free and allow the idea to reach as many people as possible. **
-------------------------------------------------------------------------------
Disclosure: I am part of Trade Nation's Influencer program and receive a monthly fee for using their TradingView charts in my analysis.
💸💸💸💸💸💸
👇 👇 👇 👇 👇 👇

Gold Sell Setup: Bearish Price Action Points to 3092!Hello traders,
I'm currently keeping a close eye on Gold (XAU/USD) for potential short setups. Recent price action shows clear bearish pressure, with Lower Highs (LHs) and Lower Lows (LLs) forming consistently — a strong indication that bulls are losing control and sellers are still in charge.
I'm particularly watching the internal highs around the 3265 zone. I’m anticipating a possible liquidity sweep above that level — a fake breakout that could tap into the daily imbalance zone (highlighted on the chart below). If price reacts bearishly from that area, I’ll be looking for confirmation to go short.
GOLD Daily
My short-term target for this sell idea is around 3092, just below last week's low.
That’s my current perspective on Gold — what are your thoughts?
Feel free to drop your analysis or any alternative views in the comment section below. Let’s learn and grow together!

GOLD set for another drop?As expected in our previous analysis XAUUSD bounced to daily resistance and started to get rejected with a strong momentum in the major direction of the trend. As we see series of lower high formation XAUUSD may continue to drop to daily support level following the long term trend.

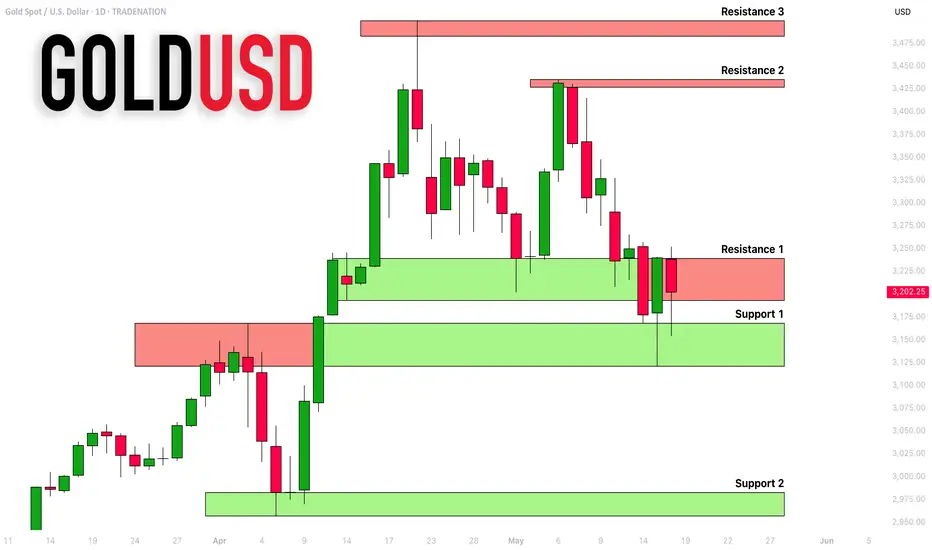
GOLD (XAUUSD): Support & Resistance Analysis For Next Week
Here is my latest structure analysis and
important supports & resistances for Gold for next week.
Support 1: 3120 - 3167 area
Support 2: 2957 - 2982 area
Resistance 1: 3193 - 3238 area
Resistance 2: 3427 - 3425 area
Resistance 3: 3483 - 3501 area
Consider these structures for pullback/breakout trading.
❤️Please, support my work with like, thank you!❤️
I am part of Trade Nation's Influencer program and receive a monthly fee for using their TradingView charts in my analysis.
XAUUSD TRADE Entry from Support with Targets at 3,347 and 3,503Entry Point: 3,219.45
Stop Loss: 3,171.35
Target Point One: 3,347.49
EA Target Point (Final Target): 3,503.87
Trade Plan:
Risk Zone: Between entry (3,219.45) and stop loss (3,171.35). The trader risks roughly 48.1 points.
Reward Zone: From entry to:
Target Point One: ~128 points.
Final Target (EA Target): ~284.4 points.
Risk-Reward Ratios:
To Target Point One: ~2.66:1
To EA Target Point: ~5.9:1
Indicators and Signals:
Price appears to be bouncing off a support zone near 3,212–3,219, indicating a potential reversal.
200 EMA (blue) and 50 EMA (red) are shown; price is slightly above the 200 EMA, suggesting long-term support.
There is a downtrend before the bounce, so this might be a counter-trend trade or the start of a new trend.
Summary:
This setup is a classic bounce from a demand/support zone with a clear upside potential. The risk is tightly managed, and the reward is significantly higher, aligning with favorable risk-reward principles. However, the position is speculative and relies on bullish follow-through from the support level. Watch price behavior near the 3,288 and 3,347 resistance zones to assess momentum.

Gold Bulls Reloading from 3239 | Break-and-Retest Long SetupGold (XAUUSD) is still riding a solid bullish wave after yesterday's strong move. The price surged sharply and is now setting up a classic break-and-retest pattern around the 3239 demand zone on the 30-minute chart.
After hitting a local peak, the price pulled back to the previous breakout level, creating a potential re-entry point for buyers. This movement fits well with the intraday structure and momentum, making it a high-probability continuation setup.
As long as the 3231 support level holds, the bullish outlook stays intact. The rejection wick from this area shows early signs of buyer interest, and a small bullish candle confirmation from here could spark another upward move.
🔹 Trade Plan:
Entry: 3239 (retest of broken structure)
Stop Loss: 3231 (below rejection wick & minor support)
Take Profits:
TP1: 3248 – minor resistance
TP2: 3255 – price imbalance fill
TP3: 3264 – extended target / top liquidity zone

Gold Breaks $3170 on Dovish Fed – Targeting $3220Gold (XAU/USD) has successfully broken above the short-term resistance at $3,170, surging toward the $3,200 level after Fed Chair Jerome Powell’s latest remarks. The market reacted positively as Powell avoided any hawkish signals, lifting investor sentiment and pushing safe-haven demand higher.
🧠 Market Sentiment & Fundamental Support
- Powell maintained a neutral tone, offering no hints of further rate hikes. This calmed investor nerves and weakened the U.S. dollar slightly.
- The latest PPI data came in lower than expected, signaling cooling inflation pressure and reducing expectations for tighter Fed policy.
- Traders are shifting away from the fear of additional rate hikes, with some even anticipating policy easing later this year.
🔮 Short-Term Outlook
Given current sentiment and the momentum from Powell’s comments, gold is likely to retest the $3,200 – $3,205 zone in the short term. If bullish pressure continues and no major surprises come from incoming economic data, the $3,220 level could be reached before we see a potential pullback.
📌 Important Note:
- Keep an eye on upcoming U.S. economic releases like unemployment claims and regional manufacturing data to gauge dollar strength.
- If gold fails to break above $3,220 and shows signs of bearish divergence, it may present a short-term profit-taking opportunity or a correction setup.
📌 Like & follow for more real-time XAU/USD ideas and updates!
📌Drop your thoughts below – bullish or bearish from here?

USD/JPY : More Bullish Move Ahead ? (READ THE CAPTION)By analyzing the USD/JPY chart on the daily timeframe, we can see that the price moved exactly as expected — first correcting down to the 142.5 area, and then rallying strongly to hit the 146.2 target. Currently, this pair is trading around 145.2, and if the price can hold above 145, we can still expect further upside movement on USDJPY. The next potential targets are 148.7 and 150 respectively. This analysis will be updated. The total return of this analysis so far has been over 720 pips!
Please support me with your likes and comments to motivate me to share more analysis with you and share your opinion about the possible trend of this chart with me !
Best Regards , Arman Shaban

XAUUSD Analysis today: Unemployment spike? Hello traders, this is a complete multiple timeframe analysis of this pair. We see could find significant trading opportunities as per analysis upon price action confirmation we may take this trade. Smash the like button if you find value in this analysis and drop a comment if you have any questions or let me know which pair to cover in my next analysis.

GOLD - Bearish Double TOPHello Traders !
The GOLD failed to create a new higher high !
The price formed a double top pattern.
Currently, The neckline is broken !
So, I expect a bearish move📉
________________
TARGET: 3022🎯

Rebounds are opportunities to short goldAt present, gold has tried to fall below the 3200 mark and completely broke the recent low support, laying the foundation for the downward structure. As the center of gravity of gold shifts downward, the upper resistance also moves down to the 3210-3220 area. The relatively clear support below in the short term is in the 3165-3160 area, and after breaking this area, it may even continue to the 3105-3100 area.
Trading strategy:
Consider continuing to short gold in the 3210-3220 area, TP: 3180-3170
CAPITALCOM:GOLD OANDA:XAUUSD FOREXCOM:XAUUSD TVC:DXY

Gold Testing PRZ & Resistance Zone-Short Opportunity? Gold ( OANDA:XAUUSD ) moved according to yesterday's analysis and the position that was Risk-To-Reward:1.61 and hit the target of this position. Do you think Gold will continue its correction, or should we wait for the next gold rally to start?
Gold is trading in the Resistance zone($3,280-$3,245) near the Potential Reversal Zone(PRZ) , and the Resistance lines .
From a Classical Technical Analysis perspective , it seems possible that an Ascending Broadening Wedge Pattern could form.
Educational note : An Ascending Broadening Wedge is a bearish technical pattern characterized by higher highs and higher lows that expand over time. It signals increasing volatility and weakening bullish momentum, often leading to a breakdown below support.
In terms of Elliott Wave theory , Gold appears to be in corrective waves in the 15-minute time frame .
I expect Gold to decline at least to the Support lines again , at least I think you can find a good Risk-To-Reward in PRZ for short positions .
Note: If Gold touches $3,292 [ Worst Stop Loss(SL) ], we can expect further gains.
Gold Analyze ( XAUUSD ), 15-minute time frame.
Be sure to follow the updated ideas.
Do not forget to put a Stop loss for your positions (For every position you want to open).
Please follow your strategy; this is just my idea, and I will gladly see your ideas in this post.
Please do not forget the ✅' like '✅ button 🙏😊 & Share it with your friends; thanks, and Trade safe.

GOLD (XAUUSD): Detailed Technical Outlook & Trading Plan
As we discussed on the yesterday's live stream,
Gold is currently in a consolidation stage.
The price is stuck within a wide horizontal channel on a daily
and we see a test of its support at the moment.
With the absence of high impact news in the economic calendar,
I assume that a consolidation will continue and there is a high
chance to see a pullback.
Your confirmation signal will be a bullish breakout and a 4H candle close
above 3271 - upper boundary of the intraday horizontal range.
There will be a strong possibility of a rise to at least to 3320 level.
Alternatively, a bearish violation of a support of the range on a daily
and a daily candle close below that may trigger a further decline.
❤️Please, support my work with like, thank you!❤️
I am part of Trade Nation's Influencer program and receive a monthly fee for using their TradingView charts in my analysis.

XAUUAD UPDATE-14-5-2025This chart shows the 1-hour price movement for Gold (XAU/USD) and presents a technical analysis setup. Here’s a breakdown of the key elements:
1. Chart Patterns:
Descending Triangle Pattern: The blue lines form a descending triangle, with lower highs and a relatively flat support near 3,232.
Support Zone (Yellow Box): Between approximately 3,232 and 3,111 — identified as a key demand zone.
Resistance Zone (Top Yellow Box): Around 3,430 — a potential price target if the price breaks out upwards.
2. Trade Setup:
Entry Point: Near the lower support (~3,232).
Take Profit (TP): Around 3,430 — suggested by the red horizontal box.
Stop Loss (SL): Below 3,111 — marked by the green area.
Risk-Reward Ratio: This appears to be favorable (target is wider than the risk).
3. Volume Insight:
Volume bars show decreasing volume during consolidation, which often precedes a breakout.
4. Prediction:
Bullish Breakout Expected: The chart suggests a potential breakout above the descending triangle, targeting the 3,430 zone.

Gold has recently broke through the call entry!Market Analysis Update: Gold Price Movement
Gold has recently broken through the Call Entry (CE) level of the 1-hour Fair Value Gap (FVG), indicating a possible continuation of upward momentum in the short term. Based on current price action and technical indicators, we are expecting gold to continue moving higher. This move may potentially target the liquidity resting above previous swing highs, as traders' stop losses in those areas are likely to be triggered, fueling the upward trend.
Once this liquidity is cleared, there is a notable resistance zone marked in the 3270–3274 range, commonly referred to as the "black zone." This area is likely to act as a key decision point. If price reaches this zone and exhibits signs of bearish confirmation (such as rejection candles, divergence, or other reversal signals), there may be a potential selling opportunity from that level.
Additionally, it is worth noting that there is a trendline drawn below the current market structure, which may also attract price action. This trendline represents another area where liquidity might be collected before any significant directional move occurs.
Thank you for your attention to this analysis. If there is anything in the explanation that you find unclear or if you have questions about specific terms or concepts, feel free to ask for clarification.
