XAUUSD Analysis todayHello traders, this is a complete multiple timeframe analysis of this pair. We see could find significant trading opportunities as per analysis upon price action confirmation we may take this trade. Smash the like button if you find value in this analysis and drop a comment if you have any questions or let me know which pair to cover in my next analysis.
Goldsignals

GOLD UPDATEMarket structure suggests is preparing for its next move.
The AND level will likely play a critical role in the upcoming direction.
** If structure breaks and confirms the shift, a new bias might form after the retest. **

GOLD(XAUUSD) -Weekly Forecast,Technical Analysis & Trading IdeasMidterm forecast:
2772.38 is a major support, while this level is not broken, the Midterm wave will be uptrend.
TVC:GOLD OANDA:XAUUSD
Technical analysis:
A trough is formed in daily chart at 2956.50 on 04/07/2025, so more gains to resistance(s) 3357.00, 3500.00 and more heights is expected.
Take Profits:
2833.00
2879.11
2955.00
3057.40
3160.00
3257.03
3357.00
3500.00
__________________________________________________________________
❤️ If you find this helpful and want more FREE forecasts in TradingView,
. . . . . . . . Hit the 'BOOST' button 👍
. . . . . . . . . . . Drop some feedback in the comments below! (e.g., What did you find most useful? How can we improve?)
🙏 Your support is appreciated!
Now, it's your turn!
Be sure to leave a comment; let us know how you see this opportunity and forecast.
Have a successful week,
ForecastCity Support Team

(XAU/USD) Bullish Trade Setup – Targeting $3,506.52 with Entry aEntry Point: $3,221.19
Stop Loss: $3,169.80
Resistance Zone: Around $3,277.98 to $3,280.64
Target (TP) Point: $3,506.52 (Approx. 9.05% upside)
📊 Technical Indicators and Markings:
Moving Averages:
Likely a 50-period (blue) and 200-period (red) moving average.
Price is currently below both MAs, signaling a short-term downtrend.
Support & Resistance Zones:
Strong support around $3,207.67–$3,221.19 (entry area).
Resistance at $3,244.25–$3,280.64.
Stop-loss is strategically placed below support to limit downside risk.
Target Area:
Projected upside target is $3,506.52, with a potential 9.05% gain from the entry.
This is marked as the EA (Expert Advisor) Target Point, possibly suggesting this is a strategy from an automated trading system.
Orange Circles:
Likely indicate swing highs and lows, used to identify trend patterns and potential reversal points.
📈 Trading Idea Summary:
Bullish Setup: Buying at support, aiming for breakout above resistance to reach target.
Risk-Reward Ratio: Favorable, assuming price holds above $3,207.
Watch for Confirmation: Price needs to break above resistance around $3,280 for momentum continuation.

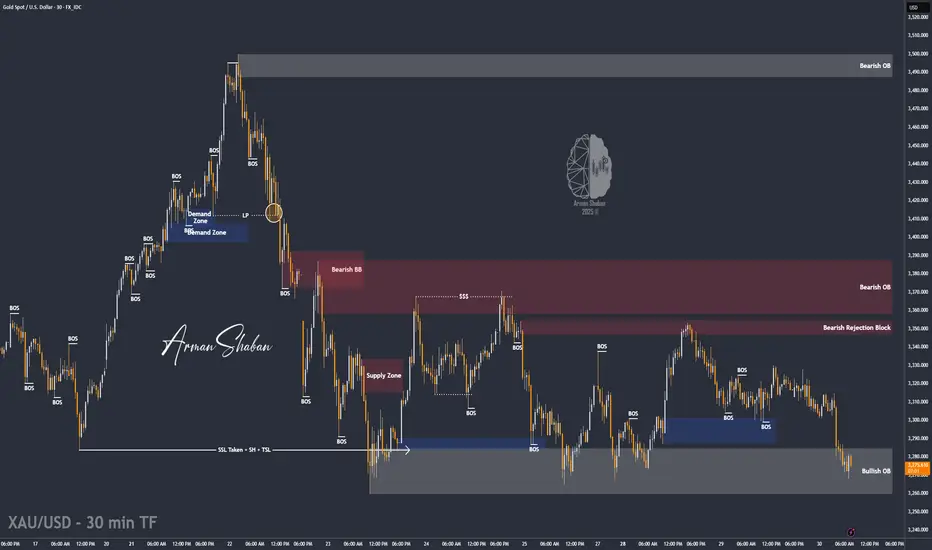
XAU/USD: NFP has come,What's Next? (READ THE CAPTION)By analyzing the gold chart on the 1-hour timeframe, we can see that after yesterday’s analysis, the price successfully rallied from $3231 to $3268. Once it reached that zone, selling pressure kicked in, and gold has since corrected down to $3239.
If gold stabilizes below $3257, we may expect further downside. The potential bearish targets are $3237 and $3221.
Keep a close eye on the $3209–$3220 zone, as price reaction there could be significant.
Please support me with your likes and comments to motivate me to share more analysis with you and share your opinion about the possible trend of this chart with me !
Best Regards , Arman Shaban

XAUUSD Channel Up intact and targeting the 1D MA50.Gold (XAUUSD) has been trading within a Channel Up since the October 30 2024 High and is currently on its latest technical Bearish Leg. The last pull-back tested the 1D MA50 (blue tend-line) before rebounding again.
As you can see the Low that this pull-back made was also on the 0.618 Fibonacci retracement level. On the current Bearish Leg, the 0.618 Fib is at 3155 and can make contact with the 1D MA50 within 1 week. That is our short-term Target, but depending on the Fed Rate Decision on Wednesday, it may be achieved earlier.
-------------------------------------------------------------------------------
** Please LIKE 👍, FOLLOW ✅, SHARE 🙌 and COMMENT ✍ if you enjoy this idea! Also share your ideas and charts in the comments section below! This is best way to keep it relevant, support us, keep the content here free and allow the idea to reach as many people as possible. **
-------------------------------------------------------------------------------
Disclosure: I am part of Trade Nation's Influencer program and receive a monthly fee for using their TradingView charts in my analysis.
💸💸💸💸💸💸
👇 👇 👇 👇 👇 👇

XAUUSD Bounce to daily resistance?Hello traders, this is a complete multiple timeframe analysis of this pair. We see could find significant trading opportunities as per analysis upon price action confirmation we may take this trade. Smash the like button if you find value in this analysis and drop a comment if you have any questions or let me know which pair to cover in my next analysis.

XAUUSD ANALYSIS XAUUSD took support from support line,
All long targets are achieved.
this month taking rejection from major resistence,
Let's track the moves to down.
follow for more swing analysis on INDICES - CURRENCY - COMMODITIES

XAUUSD Analysis todayHello traders, this is a complete multiple timeframe analysis of this pair. We see could find significant trading opportunities as per analysis upon price action confirmation we may take this trade. Smash the like button if you find value in this analysis and drop a comment if you have any questions or let me know which pair to cover in my next analysis.

GOLD D1 Chart Update For Shorter Term TradingRead all levels mentioned in chart carefully as we have 2 directions
Right now GOLD standing at turning point
GOLD remains in BUY trend as long as stays above 2900-3000 Zone

Gold's Symmetrical Triangle Near Break – Support Test Imminent!Gold ( OANDA:XAUUSD ) moved as I expected in my previous post and attacked the Support zone($3,282-$3,245) and Support lines for the second time . The question is, can Gold break the Support zone($3,282-$3,245) and Support lines or not!?
Please stay with me .
Gold is moving between Support zone($3,282-$3,245) and Resistance zone($3,386-$3,357) again . In fact, it can be said that Gold has been moving in a range for the past 5-6 days .
From a Classical Technical Analysis perspective, Gold appears to be forming a Symmetrical Triangle Pattern. A break of either line could indicate the next direction for Gold, but since the Symmetrical Triangle Pattern is a Continuation Pattern , the lower line is more likely to break .
In terms of Elliott Wave Theory analysis , it seems that we still have to wait for the next five downwaves .
------------------------------------------
Today, important U.S. data — JOLTS Job Openings and CB Consumer Confidence — will be released.
Let’s quickly review their potential impact on Gold:
JOLTS Job Openings :
If the number comes lower than expected , it signals a weakening labor market, increasing the chances of a dovish Fed → Bullish for Gold .
If the number is stronger than expected , it indicates a robust labor market, pushing the Fed to stay hawkish → Bearish for Gold .
CB Consumer Confidence :
A drop in consumer confidence reflects economic worries , driving demand for safe-haven assets like Gold → Bullish .
A rise in consumer confidence shows economic strength, reducing the appeal of Gold → Bearish .
Historical Impact :
Both indices have caused strong intraday moves in Gold recently, especially if the figures surprise the market.
Summary :
Weak JOLTS and low Confidence → Gold bullish
Strong JOLTS and high Confidence → Gold bearish
Be prepared for high volatility during the releases. Always manage your risk carefully!
------------------------------------------
I expect Gold to attack the Support zone($3,282-$3,245) and Support lines for at least the third time , and if it breaks, the next target could be $3,223 .
Note: If Gold can move above $3,393, we can expect more pumps and maybe make a new All-Time High(ATH).
Gold Analyze ( XAUUSD ), 1-hour time frame.
Be sure to follow the updated ideas.
Do not forget to put a Stop loss for your positions (For every position you want to open).
Please follow your strategy; this is just my idea, and I will gladly see your ideas in this post.
Please do not forget the ✅' like '✅ button 🙏😊 & Share it with your friends; thanks, and Trade safe.

THE KOG REPORT - NFPTHE KOG REPORT – NFP
This is our view for NFP, please do your own research and analysis to make an informed decision on the markets. It is not recommended you try to trade the event if you have less than 6 months trading experience and have a trusted risk strategy in place. The markets are extremely volatile, and these events can cause aggressive swings in price.
We’ve done well this week on gold, capturing the high into the low and then taking the long late session which has nearly completed our higher target for a decent week on this precious metal. As we’ve said, best practice is to let this play out, let them take it to where they want, once it settles, then look for the trade.
We have support now at the 320-35 level which is a key level that will need to break in order to reverse and go lower. This level also lines up with our Excalibur levels and red boxes so we can say it’s pretty strong. Above, we have the 3270-75 region which is the previous order level, our volume indicator is suggesting a pull back, so rejection there can take us back into support to settle for the NFP release. It’s this level, if held which can push this upside and our thoughts are at the moment, are they going to take this back into the previous range and hold it there into the close.
So as long as 3240 holds us, we’re likely to see higher pricing for now, 3310-20 is the key level above which needs to break to then give us the flip and potential for a new all time high.
For now, let’s sit back and see what happens.
RED BOXES:
Break above 3262 for 3265, 3270, 3275 and 3288 in extension of the move
Break below 3252 for 3240, 3236, 3230 and 3220 in extension of the move
Please do support us by hitting the like button, leaving a comment, and giving us a follow. We’ve been doing this for a long time now providing traders with in-depth free analysis on Gold, so your likes and comments are very much appreciated.
As always, trade safe.
KOG

Gold Technical Update (4H Time Frame) / Gold BullishAs we mentioned last week, gold was consolidating on the 4H time frame. After the breakout, all our projected targets were successfully achieved as of yesterday.
Currently, gold is forming a bullish flag pattern on the 4H chart — a continuation pattern that often signals the potential for further upside.
If gold sustains above the 3275–3280 zone, we may see renewed bullish momentum with the following potential targets:
Target 1: 3300
Target 2: 3340
Target 3: 3360
Target 4: 3400
⚠️ This is a technical analysis-based outlook. Traders are advised to manage their positions with proper risk-reward strategies and stay updated with market developments.

XAUUSD NFP spike coming!Hello traders, this is a complete multiple timeframe analysis of this pair. We see could find significant trading opportunities as per analysis upon price action confirmation we may take this trade. Smash the like button if you find value in this analysis and drop a comment if you have any questions or let me know which pair to cover in my next analysis.

XAU/USD: High Volatility is Expected! (READ THE CAPTION)By analyzing the gold chart on the 30-minute timeframe, we can see that, as expected, the price began rising from the $3310 zone yesterday and reached $3330, delivering a 200-pip gain.
After that, selling pressure took over, and gold is now trading around $3277. Given the current market structure and today's important news events, I expect high volatility in both bullish and bearish directions.
One of the key liquidity pools likely to be targeted today lies below $3259, and before any potential drop, we may see the liquidity gap between $3288 and $3303 being filled.
Please support me with your likes and comments to motivate me to share more analysis with you and share your opinion about the possible trend of this chart with me !
Best Regards , Arman Shaban
The bearish trend is obvious, 3180 is foreseeable!Fundamentals:
Focus on US economic data and Fed dynamics;
Technical aspects:
After gold fell below the recent low support area of 3260, the bearish trend became more obvious. Although gold has stopped falling near 3220, there is no obvious sign of bottoming out. From the current structure, gold still has room to fall, and the area near 3180 can be foreseen in the short term. However, after a sharp drop in gold, there may still be repetitions in the short term, so it is not advisable to over-short gold for the time being. Gold still has the possibility of a short-term rebound to the 3245-3255 area.
Trading strategy:
1. Consider waiting for gold to rebound to the 3245-3255 area before shorting gold; TP: 3235-3225;
2. Consider trying to go long on gold in small batches in the 2330-2320 area, TP: 3245-3255, and then short gold after reaching the target area.

XAUUSD Analysis todayHello traders, this is a complete multiple timeframe analysis of this pair. We see could find significant trading opportunities as per analysis upon price action confirmation we may take this trade. Smash the like button if you find value in this analysis and drop a comment if you have any questions or let me know which pair to cover in my next analysis.

XAUUSD drop to daily support?XAUUSD with the new daily open price with a gap and started to trend back down. As the market is just below a significant support, the price may continue to drop to the daily 20ema which is also previous swing high turn support.
A sell trade is high probably after price action confirmation.

Short gold, gold may continue to fall to 3245-3235Fundamentals:
1. Focus on the performance of US economic data and the dynamics of the Federal Reserve;
2. Pay attention to whether the geopolitical conflicts will escalate, including the situation between India and Pakistan, Russia and Ukraine, and the situation between the United States and Iran, etc.
Technical aspects:
The rebound momentum of gold has gradually weakened, and gold has failed to effectively break through the 3320-3330 resistance zone many times recently, and has built multiple short-term top structures in this area, which has limited the height of gold rebound and further strengthened the bearish sentiment in the market, which is conducive to further decline of gold. In addition, gold has tested the area near 3260 many times, which has weakened the support strength of this area to a certain extent. Gold may fall below this area at any time and continue to the 3245-235 zone.
Trading strategy:
Consider shorting gold again with the 3315-3325 zone as resistance, and expect gold to fall below 3260 and continue to the 3245-3235 zone.

Short gold after the rebound!Fundamentals:
1. First, focus on Trump and the Fed’s dynamics;
2. Pay attention to whether geopolitical conflicts escalate, including the situation between India and Pakistan, Russia and Ukraine, and the situation between the United States and Iran, etc.
Technical aspects:
Although gold once rebounded from around 3267 under the circumstances of the ADP data being significantly positive, reversing the downward trend in the short term. However, the recent rebound high of gold only stopped at around 3330, and multiple top turning points were built in the 3320-3330 area, which greatly limited the height of gold’s rebound and further the bearish sentiment in the market. Therefore, I think the area around 3260 is not the low point of this round of decline. I think gold is very likely to continue to fall and continue to the 3240-3230 area, or even lower.
Trading strategy:
Consider shorting gold when it rebounds to the 3315-3325 area, and expect gold to fall below 3260 and completely open up the downward space!

XAUUSD Analysis todayHello traders, this is a complete multiple timeframe analysis of this pair. We see could find significant trading opportunities as per analysis upon price action confirmation we may take this trade. Smash the like button if you find value in this analysis and drop a comment if you have any questions or let me know which pair to cover in my next analysis.

Gold insights: 30-APRIL-2025Rise and shine, traders! Start your day with actionable Gold insights. Let's grow your skills together, one chart at a time.

(XAU/USD) 1H Chart: Long Setup Targeting 3,500 with Key Support Entry Point: Suggested near 3,301.51 USD (marked with the purple support zone).
Stop Loss Zone: Below 3,266.87 to 3,221.67 USD (marked in blue and purple). This is where you limit your loss if the trade goes wrong.
First Target (Target Point One): 3,376.65 USD.
Final Target (EA Target Point): 3,523.55 USD (~8.26% potential gain from entry).
Main Setup Idea:
The price is consolidating around the support zone.
There's a plan to buy (go long) at the purple zone (Entry Point) and aim for the two target points
