XAUUSD It's most important week in 5 years.Gold (XAUUSD) hit last week the multi-year Higher Highs trend-line that has been in effect since the July 04 2016 High. Last time it had a rejection on it was on August 03 2020 when the market started the last 2-year Bear Cycle.
The current 1W candle has opened above this Higher Highs trend-line, so the week is of utmost importance as a closing below it maintains the pattern and the bearish Cycle Top bias, while above it jeopardizes invalidating it.
If as a result, the market closes the week below it and remains within the Fibonacci Channel Up, we may indeed be on Leg (4) peak and our Target will be near the 0.382 horizontal Fibonacci level at 2700 towards the end of the year. If not, we will see what new pattern is created and adapt accordingly (updates will follow).
-------------------------------------------------------------------------------
** Please LIKE 👍, FOLLOW ✅, SHARE 🙌 and COMMENT ✍ if you enjoy this idea! Also share your ideas and charts in the comments section below! This is best way to keep it relevant, support us, keep the content here free and allow the idea to reach as many people as possible. **
-------------------------------------------------------------------------------
Disclosure: I am part of Trade Nation's Influencer program and receive a monthly fee for using their TradingView charts in my analysis.
💸💸💸💸💸💸
👇 👇 👇 👇 👇 👇
Goldsignals

XAUUSD Analysis todayHello traders, this is a complete multiple timeframe analysis of this pair. We see could find significant trading opportunities as per analysis upon price action confirmation we may take this trade. Smash the like button if you find value in this analysis and drop a comment if you have any questions or let me know which pair to cover in my next analysis.

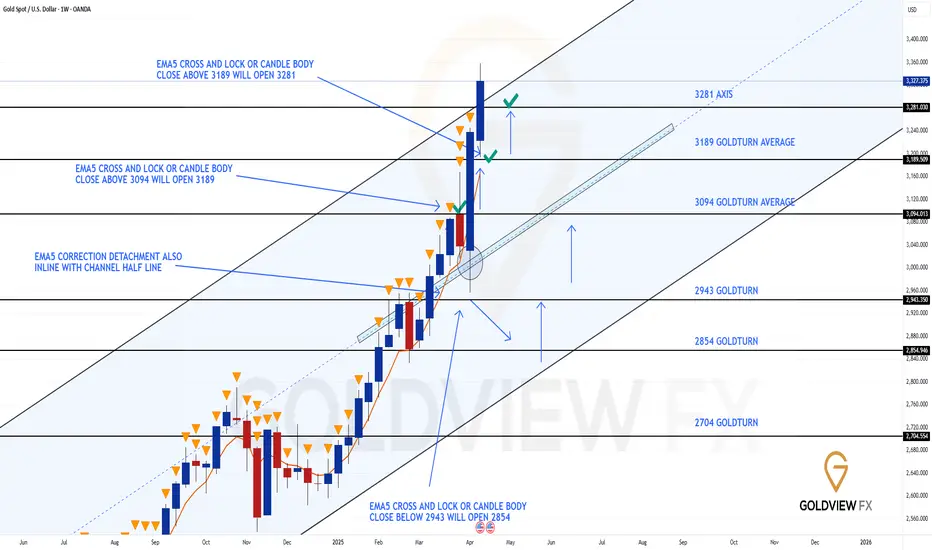
GOLD WEEKLY CHART MID/LONG TERM ROUTE MAPHey Everyone,
Please see update on our week chart idea, which has been playing out perfectly allowing us to track the movement down and trade the movement up and finally complete - BOOOOM!!!
After completed all our [previous targets on this chart, we were left with a body close above 3189 leaving a long range/term gap to 3281. This target was hit last week completed this chart idea.
We will now update a new weekly chart idea next week with more long term/range projections. Please keep an eye out for this for next Sunday or if we get a chance, we will try and get this out earlier.
However, please note if we see a rejection here on the channel top, then the lower levels within the channel, are still valid to track the movement down and up.
Thank you all for your likes, comments and follows, we really appreciate it!
Mr Gold
GoldViewFX
GOLD (XAUUSD): Classic Trend-Following Pattern
Gold closed on Thursday, forming a bullish flag pattern
on an hourly time frame.
The flag reflects a correction that the market started after a completion
of a strong bullish wave.
A breakout of its resistance line and a candle close above will signify
a highly probable resumption of the trend.
With a high probability, the price will move up at least to a current ATH.
(Remember that the price may respect a trend line one or several times more
and a correction can be more extended, that is why we rely on a breakout of a reliable trigger).
❤️Please, support my work with like, thank you!❤️
I am part of Trade Nation's Influencer program and receive a monthly fee for using their TradingView charts in my analysis.

Gold & The Policy Earthquake: Has the Top Been Set?🌐 1. Macro Landscape & Fundamental Drivers
April 2025 is shaping up to be one of the most volatile months in recent financial memory:
The U.S.-Global trade war is escalating with no signs of cooling. Following widespread tariff hikes by the Trump administration, the EU retaliated with 25% tariffs on U.S. goods, and dozens of nations are reacting in kind. WTO estimates global trade volume will drop by 1% in 2025.
Central banks are pivoting: both the ECB and Bank of England are signaling rate cuts. Morgan Stanley expects the BoE to slash rates down to 3.25% by year-end.
Global equities are under stress: the DAX and CAC40 plunged 4%, while U.S. indices are selling off hard.
💡 OANDA:XAUUSD surged to a record high near $3,360/oz, before pulling back to the current level around $3,327.
📌 Bottom Line – Fundamentals:
Flight to safety is alive and well. However, with gold at record levels and rate expectations shifting rapidly, we may be witnessing a transitional phase – from aggressive bidding to cautious holding.
📉 2. Multi-Timeframe Technical Analysis
🔍 Daily Chart (D1) – Strong Bull Trend, but Warning Signs Ahead
Price trades significantly above the 34, 89, and 200 EMAs – classic uptrend structure.
RSI is at 72.79, indicating overbought territory.
Volume shows signs of tapering off after a major spike – early signs of exhaustion?
🧾 D1 Summary: Momentum remains bullish, but with RSI overheated and volume waning, the rally may pause or retrace in the near term.
🔍 4H Chart (H4) – Entering Distribution Zone
Price has broken out and is now consolidating above prior highs.
All EMAs (34 > 89 > 200) remain bullish.
RSI at 70.24 = overbought, and price action shows indecision (doji, small-bodied candles).
🧾 H4 Summary: This is textbook distribution behavior. Bulls may still be in control, but sellers are testing the water.
🔍 1H Chart (H1) – Short-Term Battle Ground
Current price: $3,327.375
EMAs remain aligned for upside, but price is stalling around resistance.
RSI is neutral at 55.71, suggesting temporary equilibrium.
Volume is declining, hinting that bulls may be losing momentum.
🧾 H1 Summary: Price is consolidating. The next breakout or breakdown will define the short-term direction.
🧠 3. Market Sentiment Overview
🛡 Gold is still the safe-haven of choice, but fresh buying interest is diminishing.
📉 Risk sentiment remains fragile – traders are trimming exposure amid policy uncertainty.
📈 Bond yields are rising again, drawing capital away from gold in the very short term.
🧾 Sentiment Summary: Bulls dominate the narrative, but the crowd is showing signs of hesitation. A healthy pullback wouldn’t be surprising.
🎯 4. Trade Strategy for April 21, 2025 – Two-Sided Plan by Fuinvest
🔻 Scenario A: Short-Term Sell Setup (If price fails to break resistance)
Sell Entry: $3,327 – $3,332
Stop Loss: $3,348
Take Profits:
TP1: $3,313 (EMA34 on H1)
TP2: $3,288 (local demand)
TP3: $3,272 (EMA89 H1)
🧠 Why sell? Overbought RSI, weak volume, and potential distribution suggest a short-term pullback is likely.
🔺 Scenario B: Trend Continuation Buy (If breakout confirmed)
Buy Entry: $3,350 – $3,355 (after H1/H4 closes above $3,348 with volume confirmation)
Stop Loss: $3,327
Take Profits:
TP1: $3,378 (measured move target)
TP2: $3,410 (Fibonacci extension)
TP3: $3,450 (psychological round number)
🧠 Why buy? Trend remains intact. If resistance breaks, it could trigger momentum buying and stop-runs.
💼 Risk Management Tip:
Limit risk to 1–2% per trade.
Use trailing stops once price moves in your favor.
🧾 5. Final Thoughts from Fuinvest
“Gold has rallied in response to deep macro uncertainty, but with record highs comes fragility. The current structure suggests we are at a key decision point: either a clean breakout or a well-needed cooldown. Smart money is watching closely – and so should you.”
📣 Follow Fuinvest for real-time trade analysis, macro commentary, and actionable strategies that help you stay ahead of the market. Don’t just react – anticipate.

XAUUSD FALLING WEDGE PATTERNI Created This XAUUSD Chart Analysis In 30-M Tf
Entry: BUY from 3315
Support zone : 3312
Target Will Be : 3355
OANDA:XAUUSD made Falling wedge Pattern, It went to Uptrend, Let me know your thoughts in comments section

GOLD (XAUUSD): Updated Support & Resistance Analysis
With a strong bullish rally that we saw on Gold since the beginning
of the week, I prepared for you the updated support & resistance analysis.
Resistance 1: 3340 - 3357 area
Resistance 2: 3390 - 3406 area
Resistance 3: 3440 - 3450 area
Support 1: 3235 - 3246 area
Support 2: 3135 - 3167 area
Support 3: 2957 - 2983 area
Consider these structures for pullback/breakout trading.
❤️Please, support my work with like, thank you!❤️
I am part of Trade Nation's Influencer program and receive a monthly fee for using their TradingView charts in my analysis.

XAUUSD Analysis todayHello traders, this is a complete multiple timeframe analysis of this pair. We see could find significant trading opportunities as per analysis upon price action confirmation we may take this trade. Smash the like button if you find value in this analysis and drop a comment if you have any questions or let me know which pair to cover in my next analysis.

Gold Trading Zones: 17-APRIL-2025Gold trading made easier: Explore today's zones and refine your strategy.

Gold Price Analysis April 16Gold price is at ATH and no stopping point is seen
safe trading strategy can only be waiting for retest of strong buying zones to BUY
There is no specific strategy when gold is at the current price range. Today's strategy focuses on Buy around 3275-3273. The best zone to BUY today is 3246-3244. 3313 is a notable Fibonacci resistance zone, breaking this zone Gold will head to the next Fibonacci zone around 3350.
wish you a successful trading day.

XAU/USD: All-Time High Reached with Pullback Opportunity AheadThe XAU/USD market has set a new all-time high, continuing its strong bullish trajectory toward the 3300 resistance zone. This level may act as a potential reversal point, offering a chance to enter on a pullback.
A range zone has formed around the 3225 level, which, along with the nearby upward trendline, could serve as a key support area for identifying buy signals. With high-impact news scheduled for today, volatility is expected. Should a retracement occur, the support zone around 3225 may provide a launchpad for the next move toward the resistance zone at 3390

Gold (XAUUSD) Trade Setup: Bullish Breakout Toward $3,637 TargeCurrent Price: $3,309.18
EMA 30 (Red Line): $3,265.00
EMA 200 (Blue Line): $3,163.35
Trend Direction: Strong uptrend (price above both EMAs)
Timeframe: 1-hour (short-term analysis)
📍 Key Levels
Entry Point: Around $3,266.63 (just above EMA 30)
Stop Loss: Around $3,265.00
Target (EA Target Point): $3,637.23
Potential Profit: +$365.01 or +11.16%
🔍 Technical Patterns & Zones
Rising Channel: Price is moving within a rising wedge or channel, indicating bullish momentum but with narrowing range — a potential reversal signal if broken.
Support Zone: Highlighted purple box around the entry point; likely a demand zone.
Resistance Zone: $3,637.23 area marked as the EA Target Point — previous resistance or Fibonacci extension level.
✅ Bullish Signals
Price is consistently making higher highs and higher lows.
EMAs are aligned in a bullish formation (short EMA above long EMA).
Clear breakout above consolidation range recently.
Trade setup shows favorable risk-to-reward ratio.
⚠️ Risks / Caution
Rising wedge can sometimes break down — watch for volume drop or divergence.
Potential pullback to the entry zone is expected (indicated by the arrow).
News Events: Symbols below the chart indicate upcoming USD economic data, which could bring volatility.
📈 Strategy Summary
Buy on pullback to $3,266.63 with tight stop at $3,265.00.
Target: $3,637.23 — potential 11% gain.
Risk: Minimal if stop is respected, tight stop-loss.

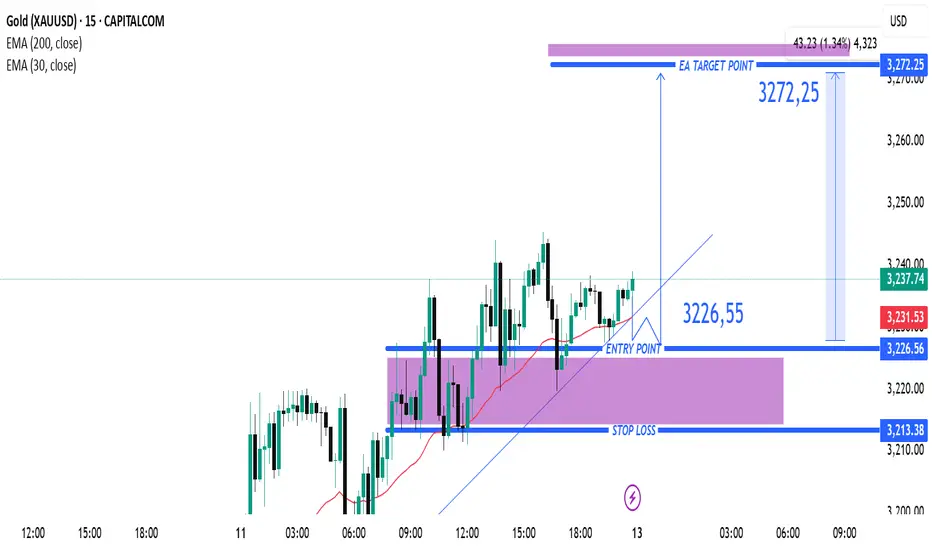
Gold (XAUUSD) 15-Min Buy Setup: Bullish Breakout with High Risk-Instrument: XAUUSD (Gold vs. US Dollar)
Timeframe: 15 minutes
Indicators:
EMA 200 (Blue): 3,170.78 (long-term trend indicator)
EMA 30 (Red): 3,231.53 (short-term trend indicator)
---
Key Levels:
Entry Point: 3,226.55 (highlighted with a blue arrow and line)
Stop Loss: 3,213.38 (purple zone bottom)
Target (Take Profit): 3,272.25
---
Trade Setup:
Type: Long (Buy) Position
Risk-to-Reward Ratio:
Risk: ~13.17 points (from 3,226.55 to 3,213.38)
Reward: ~45.7 points (from 3,226.55 to 3,272.25)
R/R Ratio: Approximately 3.5:1, which is favorable
---
Market Context:
Price is curren
Gold (XAUUSD) Bullish Breakout Setup – Targeting 3,394.56 After EMA 30 (Red Line): Currently at 3,109.56
EMA 200 (Blue Line): Currently at 3,064.85
Price is above both EMAs, indicating bullish momentum in the short and long term.
📈 Trade Setup:
Entry Point: Around 3,162.15
Stop Loss Zone: Below the purple support box around 3,109–3,141 (right above the 30 EMA)
Target (Take Profit): 3,394.56 — marked as "EA TARGET POINT"
📊 Strategy Outlook:
Bullish Setup: The price recently broke out of a resistance zone (purple area) and retested it, confirming the breakout.
The risk-to-reward ratio appears favorable, as the target is significantly higher than the stop loss.
The upward price projection suggests confidence in a strong bullish continuation.
⚠️ Things to Watch:
Volume confirmation and price action near the entry level.
If price closes below the 30 EMA, it may invalidate the setup.
Always consider broader macroeconomic or fundamental factors when trading gold (e.g., USD strength, interest rates, geopolitical tension).

XAUUSD Analysis todayHello traders, this is a complete multiple timeframe analysis of this pair. We see could find significant trading opportunities as per analysis upon price action confirmation we may take this trade. Smash the like button if you find value in this analysis and drop a comment if you have any questions or let me know which pair to cover in my next analysis.

Gold reached 3275 and will continue to move towards new highs
📌 Driving Events
Kitco Metals senior analyst Jim Wyckoff pointed out: "The gold market is waiting for new catalysts, but the technical side remains strong and the safe-haven demand remains solid." It is worth noting that the US government has recently launched an investigation into the import of drugs and semiconductors in preparation for the imposition of tariffs. Trump has also made it clear that the details of the semiconductor import tariff will be announced this week.
💢 Investors please pay close attention to the following key events:
Fed Chairman Powell's speech on Wednesday (interest rate policy orientation)
US retail sales data on Wednesday
ECB interest rate decision on Thursday (expected to cut interest rates by 25 basis points)
Specific implementation details of Trump's tariff policy
📊Comment analysis
In my previous post interpretation, I suggested that the gold price should be sideways, waiting for the price to continue to rise to a new high. Today, Wednesday (April 16), the Asian market broke a new high as expected in the early trading. As of now, the gold price is $3275
Now after two days of adjustment, the gold price has broken through again, and the resistance level of 3255 has also turned into support. The next step is 3280 and 3300.
Follow the trend, participate in one direction, and continue to be long today.
💰Strategy Package
Long position:
Actively participate at 3270-3275 points, profit target above 3295 points
Steady participation at 3250-3260 points, profit target above 3280 points
⭐️ Note: Labaron hopes that traders can properly manage their funds
- Choose the number of lots that matches your funds
- Profit is 4-7% of the fund account
- Stop loss is 1-3% of the fund account

XAUUSD NEXT MOVE IN 30MI Created This XAUUSD Chart Analysis In 30-M Tf
Entry: BUY from 3220
Support zone : 3220 / 3216
Target Will Be : 3240
OANDA:XAUUSD made parallel Channel and It take support and it went to Uptrend, Let me know your thoughts in comments section

XAUUSD is in buy zone!After a short break on daily timeframe XAUUSD managed to breakout in the major direction of the trend with strong momentum with multiple liquidity grab from the support level. 5min shows a break of structure and drop to 3254.00 followed by strong rejection to the upside showing a high probability of trend continuation to the upside.
Is the price reaching to 3300?

Gold is brewing a big drop!After the tariff issue was moderately cooled, gold returned to calm and volatility gradually narrowed! From the candle chart, although gold did not form an effective decline, the bullish momentum slowed down significantly!
Since gold rose near 2970, it has reached a high of around 3246. The bulls did not get a respite. After the news returned to calm, gold may usher in a technical retracement repair; gold has been blocked near 3246 many times in the past two days, and the upper shadow line clearly shows a rejection signal! In the current gold structure, gold has formed a secondary high point near 3232, and it is very likely to combine the 3246 high point to form a double top structure, which is conducive to the decline of gold to a certain extent;
In addition, compared with the market's expected targets of 3300 and 3400, the upper side belongs to an unknown area and is more risky, while the lower side has a previous historical track. From the perspective of market psychology and risk preference, gold prices may be more willing to retreat.
So in the short term, I will still not give up my short position. Once gold falls below the 3205-3200 zone, the area around 3190 will not be able to stop the decline of gold. The retracement target area is located in: 3160-3140 zone.
The trading strategy verification accuracy rate is more than 90%; one step ahead, exclusive access to trading strategies and real-time trading settings

Consolidation Phase in XAU/USD with Bullish PotentialFollowing a period of strong bullish momentum, XAU/USD is currently trading sideways, remaining confined within the price range established between Friday and Monday. This consolidation suggests the market may continue ranging in the short term.
However, if the price dips below the lows of the past two days and breaches the ascending trendline, there is a strong potential for a rebound and continuation to the upside. An alternative scenario could see the formation of a triangle or rising wedge pattern near the current resistance zone.
Despite short-term uncertainty, a key support area around 3170–3180 remains critical. A bounce from this zone could signal the resumption of upward movement. Traders are advised to monitor these key levels closely for confirmation of the next significant directional move. The next target is the resistance zone near 3285

XAUUSD Analysis todayHello traders, this is a complete multiple timeframe analysis of this pair. We see could find significant trading opportunities as per analysis upon price action confirmation we may take this trade. Smash the like button if you find value in this analysis and drop a comment if you have any questions or let me know which pair to cover in my next analysis.

Gold sell setup Why We Would Sell (Short) XAUUSD in This Setup:
Strong Resistance Zone:
Price is approaching a clear resistance level around 3,250, marked by multiple rejections in the past.
This zone acted as a ceiling for the bulls — each time price reached this level, it got pushed back down, showing strong selling pressure.
Double Top Formation (Potential Reversal Pattern):
The price formed a potential double top near 3,250.
This pattern often signals a shift from bullish to bearish momentum.
Bearish Rejection Wicks:
Candlesticks near the resistance show long upper wicks, indicating that buyers are getting weak and sellers are stepping in.
Lower High Forming:
After the second peak, price failed to make a new high, suggesting buying momentum is weakening.
The current price action is forming a lower high, which is a bearish signal.
Bearish Price Projection (Arrow Path):
The blue arrow suggests a retest of the resistance zone followed by a strong drop down to the support zone at 3,187.
This offers a good risk-to-reward ratio for a short trade setup.
Trade Parameters:
Stop Loss above resistance (around 3,250).
Take Profit around 3,187 (previous support).
This setup offers a clear invalidation point if the price breaks above resistance.

XAUUSD LONG CHART MAPPINGI Created This XAUUSD Chart Analysis In 30-M Tf
Entry: BUY from 3196
Support zone : 3188
Target Will Be : 3230
OANDA:XAUUSD take support and it went to Uptrend, Let me know your thought in comments section
