GOLD SHORT-TERM CORRECTION AFTER 3,360 – Consolidation likely📊 Market Summary:
Gold pulled back to around 3,363 USD, currently trading near 3,373 USD USD strength post-Fed comments and overbought conditions are prompting a short-term correction, while geopolitical tensions provide mild underlying support .
📉 Technical Points:
• Resistance: ~3,387–3,388, then 3,400 .
• Support: ~3,363, with secondary support 3,352–3,355 .
• EMA/SMA: Above EMA50, below 20 SMA (~3,347), indicating range-bound behavior
• Momentum: RSI & MACD neutral, Stochastic ~58%—suggesting sideways movement .
📌 Outlook:
Expect continued consolidation between 3,352–3,388. Breach above may lead to breakout, breach below possibly triggers pullback toward 3,320.
💡 Trading Plan:
SELL XAU/USD: 3,380–3,385
• 🎯 TP: ~3,360
• ❌ SL: ~3,395
BUY XAU/USD: 3,363–3,365
• 🎯 TP: ~3,380–3,387
• ❌ SL: ~3,350
Goldsignals

XAUUSD MARKET UPDATE 19 - 06 - 2025This chart presents a technical analysis of Gold CFDs (XAU/USD) on the 30-minute timeframe. Here's a breakdown of the key elements:
Chart Structure & Patterns:
Descending Channel: Price has been consolidating in a downward-sloping channel (marked in blue).
Projected Move: The sketch on the chart shows a potential false breakdown below the channel support, followed by a strong bullish reversal.
Support Zone: Around $3,321.534 to $3,341, highlighted in green/red — this is the expected reversal zone.
Resistance/Target Zone: A sharp upward arrow suggests the price could move towards the $3,453.550 area, the previous high and a key resistance.
Current Price:
$3,373.133 (as per the chart), sitting near the middle of the channel.
Analysis Summary:
This is a bullish setup expecting:
1. A dip to retest or fake out below the channel.
2. Reversal from the demand zone (highlighted green).
3. Breakout from the descending channel leading to a strong rally.
Invalidation likely occurs below $3,321.
Trade Idea (based on the chart):
Buy near: $3,340–$3,325
Stop loss: Below $3,321
Target: $3,440–$3,453
Would you like a written trading plan or risk management breakdown for this idea?

Today, the Federal Reserve is the key to breaking the deadlock!
📌 Core driving events
Yesterday, as the market believed that the possibility of direct U.S. involvement in the conflict had increased, tensions intensified again, and the market was once worried about possible attacks during the Asian session. Although it did not happen in the end, it is said that the next 24 to 48 hours will be a critical period. This wave of tension triggered widespread "risk aversion" operations in the market, but interestingly, gold did not react strongly. The market remained cautious before the Fed's interest rate decision was released, and the slight increase in risk appetite in the stock market also put pressure on gold prices.
📊Comment analysis
At present, the technical side of gold has been showing a bearish trend, but as of now, the market has not fallen below yesterday's closing low of 3364, and the upper side has been under pressure from the resistance of 3405. Long and short positions are wandering in this range, and the breakthrough market will either break through at the end of the day, and the current trend uses sideways trading to exchange time and space, and has not fallen below the support below, so there is a high probability that it will go up.
In the current tense market, it is more necessary to open a position near the high and low points to make a better game. At the same time, from historical experience, the impact of the Middle East geopolitical crisis on gold has three stages and has entered the second stage. The uncertainty of the global economy, the intensification of trade frictions and the rise in inflation expectations may provide structural support for gold. Therefore, if it does not break near 3364 today, it will be bullish first!
💰Strategy Package
Gold: More near 3368-70, defend the 3364 line, and look up to the 3397-3405 line. If it breaks 3405 upward, it will further impact 3422 and even the previous high, but if it breaks below 3364, the long single position will be adjusted out and it will no longer be bullish for the time being!
⭐️ Note: Labaron hopes that traders can properly manage their funds
- Choose the number of lots that matches your funds

Stick to shorting goldGold is currently fluctuating in a narrow range of 3380-3385, and the trend is relatively slow. We also need more patience. In comparison, I think the current short-selling force has a slight upper hand, because gold has shown signs of accelerating decline after a difficult rebound many times, and has fallen below 3380 many times. According to the current gold structure, gold does not have sufficient room for decline, and it is still possible to continue to fall to the 3365-3355 area.
It is expected that gold will not fluctuate too much before the Fed's interest rate decision and Powell's monetary policy press conference. For this interest rate decision, I think the possibility of a rate cut is not great, and the current interest rate may still remain unchanged. The reduction in the expectation of a rate cut may stimulate a wave of gold declines in the short term. So in the short term, I still prefer a short trade in gold. Obviously, gold is currently under pressure in the 3395-3405 area, so we can still try to short gold in this area.

Gold Spot / U.S. Dollar (XAUUSD) 4-Hour Chart4-hour price movement of Gold Spot (XAUUSD) against the U.S. Dollar, covering the period from late June to early July 2025. The current price is $3,381.09, reflecting a slight decrease of $7.09 (-0.21%) over the period. The chart includes candlestick patterns, with a highlighted consolidation zone and a recent downward trend. Key price levels such as $3,401.46, $3,389.38, and $3,340.00 are marked, indicating potential support and resistance zones.

Seize the opportunity to short gold after the reboundBecause gold fell back to the expected support area of 3375-3365 first, I just took the opportunity to go long on gold near 3372 and set TP: 3390. Obviously, our long position ended the transaction by hitting TP, and we made a profit of 180pips.
At present, gold continues to rebound to around 3396, and is facing the short-term resistance area of 3395-3405, and the upside may be limited. And I think before the Fed's interest rate decision and Powell's monetary policy conference, gold is likely to maintain a range of fluctuations, and the willingness of both long and short parties to break through may not be strong in the short term. And from the current structure, gold tends to fluctuate downward as a whole.
So for short-term trading, we might as well try to short gold in the resistance area. I think it is still very likely to retreat to at least the 3385-3380 area.

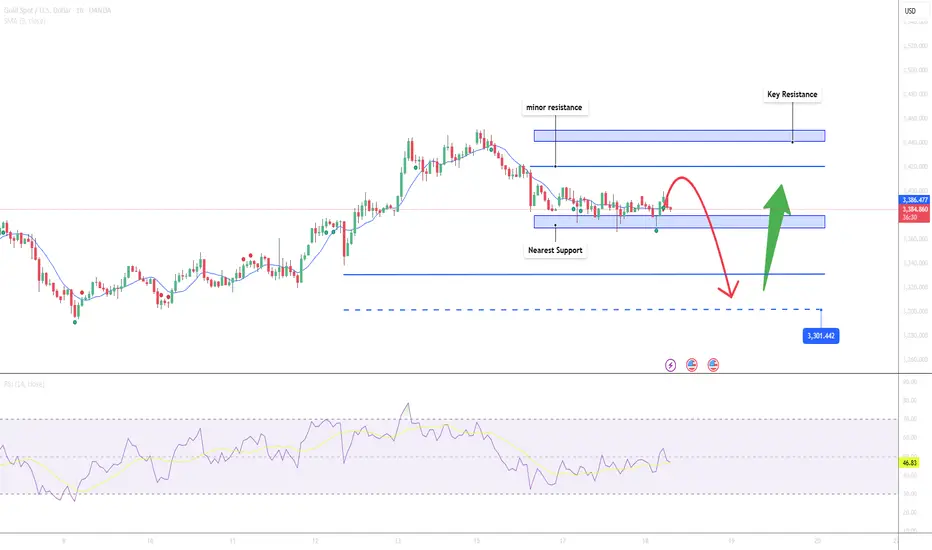
Gold May Dip Slightly Before Rebounding📊 Market Dynamics
• Gold is supported by ongoing Israel–Iran tensions and a weaker USD, despite a slight pullback as some investors take profits.
• Citi has revised its short-term outlook for gold to around $3,300, citing potential for deeper correction in the mid-to-long term if investment demand weakens.
📉 Technical Analysis
• Key Resistance: $3,440 – $3,450 (recent highs)
• $3,420 – minor resistance (psychological mid-level)
• Nearest Support: $3,374 – $3,380 (accumulation zone)
•$3,365 – deeper support, in case $3,374 is breached
• EMA 09: Price remains above both EMA09 and EMA20, signaling that short-term bullish momentum is still intact.
• Candle/Volume/Momentum:
RSI (H1): Currently at 46.8, indicating weakening momentum and potential for further pullback unless a rebound occurs soon. This is a neutral zone – neither overbought nor oversold.
📌 Outlook
With RSI below 50 and buying momentum fading, gold may undergo a mild correction toward the $3,374–3,380 zone before a clearer trend emerges. A break below $3,365 would likely trigger a short-term bearish shift. Conversely, if support holds and RSI climbs above 50, a bullish reversal could follow.
💡 Suggested Scalping Setup
• SELL XAU/USD at: $3,440–3,445
🎯 TP: $3,420
❌ SL: $3,451
• BUY XAU/USD at: $3,374–3,380
🎯 TP: $3,395
❌ SL: $3,365
Gold Pulls Back After Testing Resistance📊 Market Overview:
Gold fell to a low of $3,374 earlier today after testing the $3,434 resistance late last week. The drop was primarily due to profit-taking near recent highs, alongside a mild recovery in the US dollar. Despite this pullback, the medium-term uptrend remains supported by expectations of upcoming Fed rate cuts and persistent geopolitical tensions in the Middle East.
📉 Technical Analysis:
• Key Resistance: $3,434 – $3,450
• Nearest Support: $3,374 – $3.360
• EMA: Price remains above both EMA 09 and EMA 20, suggesting a continuation of the short-term bullish trend.
• Candlestick / Volume / Momentum:
o RSI is holding around 61–63, no longer in overbought territory.
o MACD remains positive, though upward momentum has slowed.
o Bearish candles during the Asian session suggest lingering sell pressure near $3,430. A technical rebound from $3,374 is currently underway.
📌 Outlook:
Gold may consolidate between $3,370–$3,390 in the near term. If the $3,360 support holds, a rebound toward $3,420–$3,440 is likely. However, a stronger USD could increase downside pressure.
💡 Suggested Trade Strategy:
🔻 SELL XAU/USD at: $3,410 – $3,420
🎯 TP: $3,385
❌ SL: $3,430
🔺 BUY XAU/USD at: $3,374 – $3,378
🎯 TP: $3,400 – $3,420
❌ SL: $3,360
Gold Potential Bullish ContinuationAfter retracing to the approx. 3370 - 3380 zone, gold still seems to exhibit signs of overall potential Bullish momentum as the price action may form a credible Higher Low with multiple confluences through key Fibonacci and Support levels which presents us with a potential long opportunity.
Trade Plan:
Entry : CMP 3393
Stop Loss : 3286
TP : 3499 (Before All Time High)

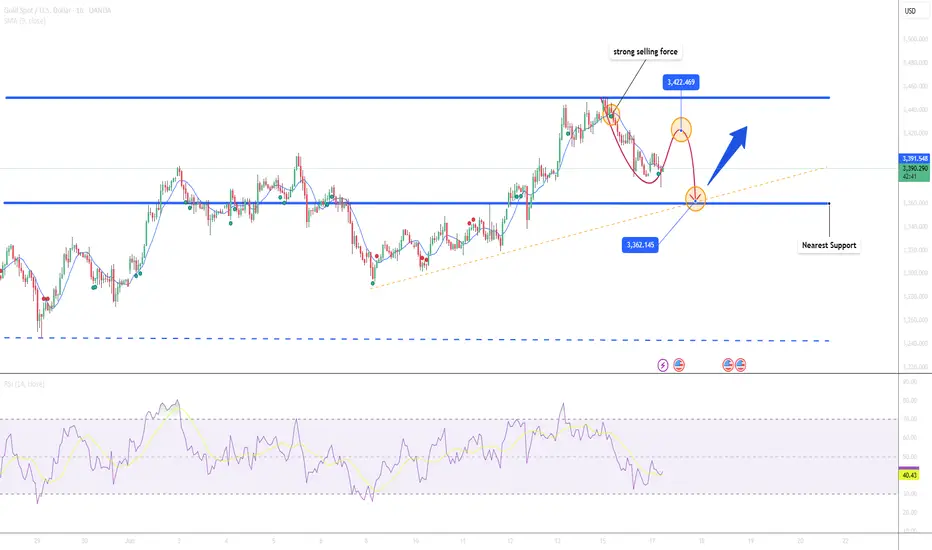
Gold on the Rise! – Bullish Setup in Focus The chart shows a repeating consolidation‑then‑breakout pattern, with Gold forming ascending swing structures, consolidating in rectangles (green), then riding higher along a rising trendline (purple). Price has just bounced off that trendline again, signaling a possible new leg up—potentially targeting the upper range near $3,448–3,450. A clear breakout above that level could open the door toward $3,500+.
📍 Trading Plan
🎯 Entry
Long on breakout above recent consolidation highs (~$3,440–3,448).
Alternatively, buy the dip near the purple trendline (~$3,385–3,390), with confirmation (hammer candle, bounce).
🛑 Stop‑Loss
For breakout: just below the top of the rectangle consolidation (~$3,389).
For trendline entry: slightly below recent swing low (~$3,358–3,360).
🎯 Profit Targets
Primary: upper rectangle level (~$3,448–3,450).
Extension: historic all‑time high region (~$3,500) → next major zone.
🎥 Path
Potential minor pullback toward trendline.
Bounce establishes support.
Surge toward top of range.
Breakout with trend continuation to new highs.
📊 Trade Risk & Reward
Target ~60–100 pts above entry, stop ~50 pts below → ideal Risk:Reward ≥ 1:1.2.
📌 Key Levels to Monitor
Level Role
$3,360 Swift dip support (green base line)
$3,390–3,400 Trendline confluence zone
$3,440–3,450 Breakout area & top of rectangle
$3,500 Next major resistance/all‑time high
🧭 Market Context & Drivers
Broad uptrend remains intact amid geopolitical tensions, especially the Israel–Iran situation, which continues to support safe-haven flows
Markets are positioning ahead of Fed’s June 18 decision; dovish signals could fuel continuation toward new highs (~$3,500+)
.
Technical structure reflects bullish momentum—ascending wedge patterns with shallow dips and strong trendline bounces
.
✅ Summary
Bias: Bullish – uptrend intact.
Strategy: Go long on dip near trendline or on breakout above $3,445.
Stop‑Loss: Just below last swing low ($3,360).
Targets:
Near-term: $3,448–3,450
Medium-term: $3,500+

XAUUSD Analysis todayHello traders, this is a complete multiple timeframe analysis of this pair. We see could find significant trading opportunities as per analysis upon price action confirmation we may take this trade. Smash the like button if you find value in this analysis and drop a comment if you have any questions or let me know which pair to cover in my next analysis.

XAUUAD Today update 17 - 6 -2025This chart shows a 30-minute timeframe for Gold (TVC:GOLD) with a clear short-term price action analysis. Here's a breakdown:
---
🔍 Key Levels & Zones Identified:
1. Resistance Area:
Around 3,384.174 — marked with a black dashed zone at the top.
Price previously rejected here.
2. Current Price:
3,386.600 (as of 10:56 UTC on June 17, 2025), slightly above the resistance — indicating a potential fakeout or bullish breakout attempt.
3. Support Zone:
Around 3,338.913, highlighted in blue.
The chart notes: "If it comes down below that, it will come down."
Suggests a bearish continuation if price breaks this level.
4. Target Support:
Near 3,325–3,300, green thick band at the bottom.
This is the zone marked "then it will touch", likely the next bearish target.
---
🔁 Pattern Insight:
A triangle or consolidation is forming, shown by blue trend lines — potential breakout or breakdown zone.
If price fails to hold above 3,384.174, it could retest 3,338.913.
A confirmed break below that support opens a move to 3,325 or lower.
---
🧭 Summary:
Bullish Scenario: Hold above 3,384 and break out to retest highs above 3,425.
Bearish Scenario: Drop below 3,338 → target 3,325–3,300 zone.
Let me know if you'd like a trading strategy or confirmation indicators added to this analysis.

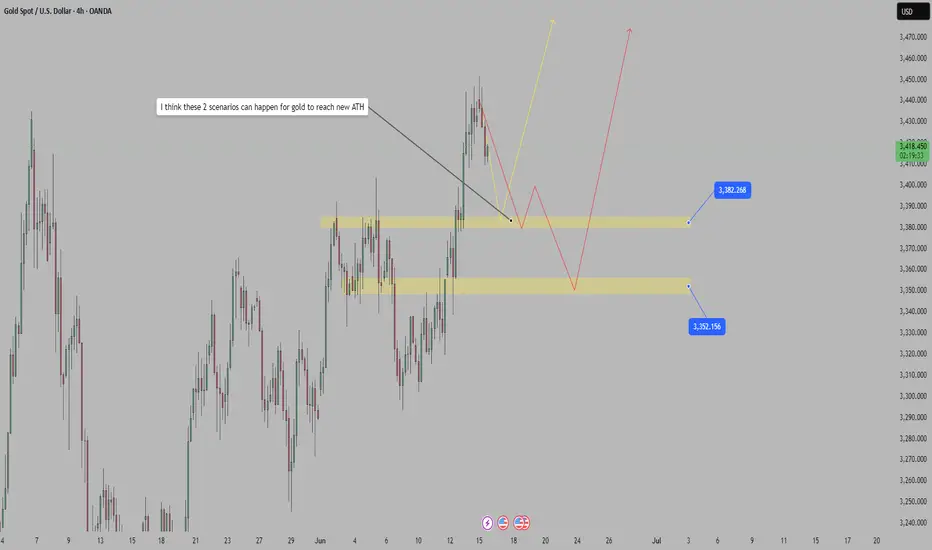
I think these 2 scenarios can happen for gold to reach new ATHGold supported by Israel-Iran conflict, US intervention in focus
Gold's sharp rise came late last week after Israel struck multiple targets in Iran, including Tehran's nuclear facilities.
The attack sparked fierce retaliation from Iran, which launched a barrage of missiles at key Israeli targets, including the financial capital Tel Aviv. Some of the Iranian missiles were also seen penetrating Israel's "Iron Dome" defense system.
What do you think?
Best regards, StarrOne !!!
XAUUSD Bouncing back to 3450?3380.27, 3383.94 and 3386.08 three daily consecutively candlestick patter with continuted series of higher low formed the daily support. Previous daily candle just closed at support with an ATR of 1.1ATR, which is quite large in the opposite direction of the major trend while the price is trading above 10ema in the daily.
In 4h there is also 3 ATR ( overall) bearish move is spotted giving a high probability for this market to bounce back to the daily resistance to the major direction of the trend.
We have a buy position at this level and will keep you posted for more updates!

Adjustments do not change the trend, continue to be bullishToday, gold opened high at 3448, and fell under pressure after reaching 3452. After repeatedly confirming resistance at high levels, it went down. We arranged short orders in the 3445-3450 area, successfully reached the target of 3330, and secured profits. Then the market fell back to around 3409 and stabilized and rebounded. We arranged long orders to stop profit near 3420. The current market is still in a bullish trend after the shock and retracement. Adjustment does not change the trend. Retracement is an opportunity. The key is to find the right entry point.
From a technical perspective, the support below focuses on the 3410-3405 area, and the key support is at 3400-3390. If the daily level stabilizes in the above area, the upward structure will continue, and the short-term is still expected to test the previous high. Short orders need to strictly control risks, and the trend of low and long is still the main theme.
Gold operation strategy: Buy gold when it falls back to around 3410-3405, and consider covering positions when it falls back to 3400-3395, with the target at 3430-3440.
For more real-time strategies, I will remind you at the key points as soon as possible,🌐 remember to pay attention!
If you still lack direction in gold trading, you might as well try to follow my pace. The strategy is open and transparent, and the execution logic is clear and definite, which may bring new breakthroughs to your trading. The real value does not rely on verbal promises, but is verified by the market and time.

Gold May Pull Back Short-Term📊 Market Overview:
After several strong bullish sessions, gold prices are under short-term pressure as geopolitical tensions in the Middle East temporarily ease and the US Dollar shows slight recovery.
While expectations for a steady Fed policy remain, traders are locking in profits after gold tested the $3,445 resistance zone.
📉 Technical Analysis:
Key Resistance: $3,445 – $3,460
Nearest Support: $3,394 – $3,380
EMA 09: Price has dropped below the 09 EMA, signaling a potential short-term bearish shift.
RSI/Candles/Momentum: RSI is pulling back from overbought levels. A red candlestick pattern has emerged after a strong rally, suggesting a technical pullback may be forming. Trading volume is starting to decrease.
📌 Outlook:
Gold may correct lower in the short term toward the $3,390–$3,380 support zone if it fails to reclaim the 09 EMA. However, the medium-to-long-term trend remains supported by safe-haven demand and dovish Fed expectations.
💡 Suggested Trading Strategy:
SELL XAU/USD at: $3,440 – $3,445
🎯 TP: $3,420
❌ SL: $3,455
BUY XAU/USD at: $3,390 – $3,395
🎯 TP: $3,410
❌ SL: $3,380

Short positions fall as expected, long opportunities reappearToday, gold maintained high and fluctuated repeatedly after opening, but the upper side has not been effectively broken through. After repeated pressure, the resistance signal was confirmed. We arranged short orders near 3445. The market fell back as expected and accurately hit the target position. The trend was highly consistent with the prediction, which once again confirmed the trading concept of "planning before the market, execution before emotion".
From the current trend structure, gold is still in a bullish trend as a whole, and short-term adjustments are normal. The support below focuses on the 3420-3415 area, which is the first defense position for short-term retracement; and the more critical bullish defense line is still at the 3405-3400 line. If this area stabilizes, it is still our core layout area for low-multiples with the trend.
The daily structure is still intact, and the long arrangement of the moving average system has not been destroyed. Short-term fluctuations do not affect the overall bullish logic. Therefore, the operation is still based on retracement and main longs, and following the trend is the kingly way. Short orders can only be participated in the short term, and stop when you reach the point, and do not hold against the trend. I will remind you of the specific operation strategy at the bottom, and pay attention to it in time. The key next is to pay attention to the stabilization signals below and wait for the market to provide new opportunities for momentum release.
If you still lack direction in gold trading, you might as well try to follow my pace. The strategy is open and transparent, and the execution logic is clear and definite, which may bring new breakthroughs to your trading. The real value does not rely on verbal promises, but is verified by the market and time. 🌐

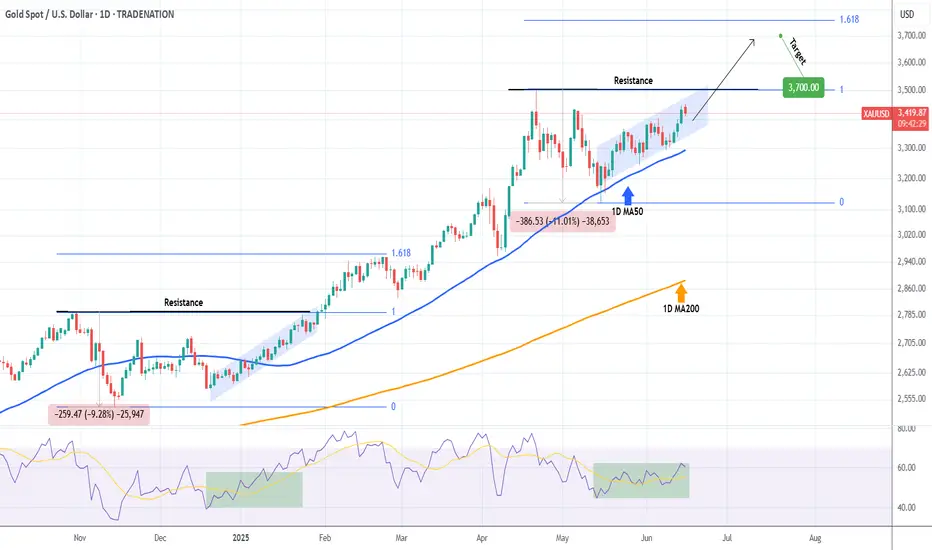
XAUUSD Strong break-out ahead to $3700.Gold (XAUUSD) is trading within a Channel Up, while being supported by the 1D MA50 (blue trend-line). This is similar to the December 19 2024 - January 30 2025 Channel Up, which when it broke above the previous Higher High Resistance, it rose straight to the 1.618 Fibonacci extension.
As a result, as long as the 1D MA50 supports, we are looking for a medium-term bullish break-out, possible by the end of July, targeting at least 3700.
-------------------------------------------------------------------------------
** Please LIKE 👍, FOLLOW ✅, SHARE 🙌 and COMMENT ✍ if you enjoy this idea! Also share your ideas and charts in the comments section below! This is best way to keep it relevant, support us, keep the content here free and allow the idea to reach as many people as possible. **
-------------------------------------------------------------------------------
Disclosure: I am part of Trade Nation's Influencer program and receive a monthly fee for using their TradingView charts in my analysis.
💸💸💸💸💸💸
👇 👇 👇 👇 👇 👇
THE KOG REPORTTHE KOG REPORT
In last week’s KOG Report we said we would want the lower level red box to be tested and rejected in order to give us the move upside into that 3330-35 region where we wanted to monitor the price for the short. We managed to get a pin point move, however, we had to exit the short trades early due to the support level holding us up. We then continued to follow Excalibur and the red box indi’s which were suggesting higher pricing and by the end of the week we had completed all our bullish above target levels, plus Excalibur trade targets and LiTE again performed at 100% accuracy.
A phenomenal week in Camelot, not only on Gold but the numerous other pairs we trade, analysis and post on.
So, what can we expect from the week ahead?
For this week we can expect some gaps on open which is going to make it difficult due to skewed data. We will however stick with the red box levels and the tools we have to make a plan for the two scenarios we may see potential of.
Scenario one:
Price opens and gaps upside, we’ll be looking for the levels of 3455-60 for a potential reaction in price, if achieved, an opportunity may be available to short there back down into the 3450, 3443 and 3435 levels.
Scenario two:
If we do open and gap downside, we’ll look for the levels of 3430-23 to hold us up, and if achieved, an opportunity to long there back up into the 3450-5 level and in extension of the move 3465 may be available.
It’s a difficult one again as no one knows how the market is going to open and what is going to happen. So we’ll update traders as much as we can during the day and the week with KOG’s bias of the day and red box target levels
KOG’s bias of the week:
Bearish below 3465 with targets below 3425, 3420, 3410 and 3406
Bullish on break of 3465 with targets above 3477, 3485, 3492, 3495 and 3503
Red Boxes:
Break above 3435 for 3443, 3448, 3465 and 3476 in extension of the move
Break below 3420 for 3410, 3406, 3397, 3385 and 3380 in extension of the move
Many of our followers and traders have seen the power of the red boxes, Imagine this on your own TV screen, 4H for swing trading, 1H for day trading and 15min for scalping. Any pair on any chart 23hrs a day. Add to that the Knights indicator giving you swing points, key levels and retracement levels and our custom volume indicator telling you when to long, when to short and when to stand back from your trades.
LEARN AND GENERATE YOUR OWN SIGNALS. You don't need any of us to guide you.
Please do support us by hitting the like button, leaving a comment, and giving us a follow. We’ve been doing this for a long time now providing traders with in-depth free analysis on Gold, so your likes and comments are very much appreciated.
As always, trade safe.
KOG

The golden opportunity comes again.This week, gold showed a slow bullish upward pattern, rising repeatedly and circuitously, and finally closed positive on the weekly line. On Friday, it was blocked twice at the high level of 3445, and the closing price remained sideways. The market is expected to continue the upward trend next week. If it breaks through 3445, it is expected to further challenge the 3500 mark or even set a new high. Combined with the recent fundamentals and the continued warming of the geopolitical situation, it provides solid support for bulls. However, the current market shock sweep is still the main rhythm, and it is not advisable to blindly chase highs in operation. It is still recommended to focus on retracement and long positions. The key support of the daily line refers to the top and bottom conversion position of 3403 and the low point of 3419 on Friday. If it falls back to the above area, you can rely on the support to arrange long positions at the right time. The overall trend is still inclined to bulls, and short positions can only be tried with a light position. Remember that strict risk control is required against the trend. I will remind you of the specific operation strategy at the bottom, and pay attention to it in time.
Operation suggestion: Gold is recommended to go long near 3405-3400, with the target looking at 3445 and 3465. If it is strong, rely on the support of 3420-3415 area and choose the opportunity to go long.
If you still lack direction in gold trading, you might as well try to follow my pace. The strategy is open and transparent, and the execution logic is clear and definite, which may bring new breakthroughs to your trading. The real value does not rely on verbal promises, but is verified by the market and time. 🌐

XAUUSD Analysis todayHello traders, this is a complete multiple timeframe analysis of this pair. We see could find significant trading opportunities as per analysis upon price action confirmation we may take this trade. Smash the like button if you find value in this analysis and drop a comment if you have any questions or let me know which pair to cover in my next analysis.

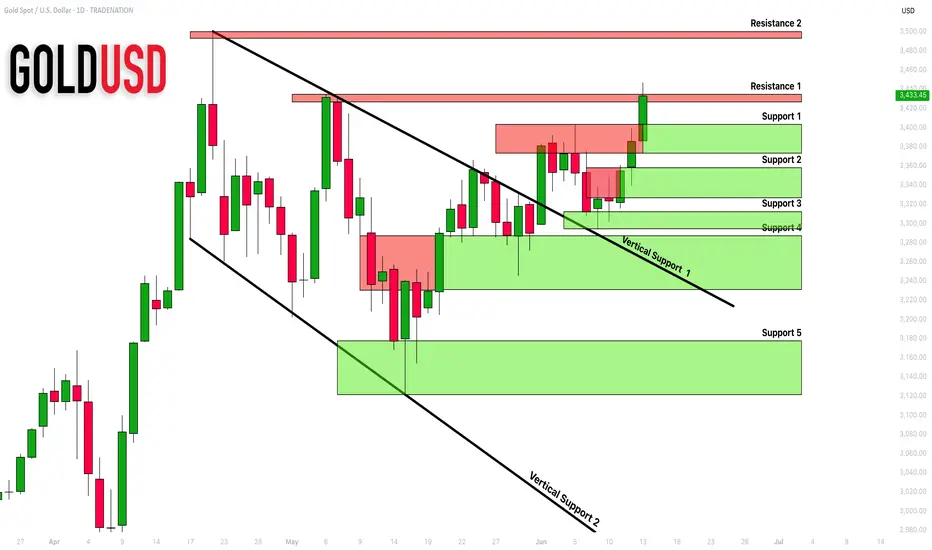
GOLD (XAUUSD): Support & Resistance Analysis For Next Week
Here is my latest structure analysis and
important supports & resistances for GOLD XAUUSD
for next week.
Consider these structures for pullback/breakout trading.
❤️Please, support my work with like, thank you!❤️
I am part of Trade Nation's Influencer program and receive a monthly fee for using their TradingView charts in my analysis.
Gold Extends Rally as New High Emerges📊 Market Overview:
Gold reached a new intraday high at $3,447 today, supported by a weaker USD and stable U.S. Treasury yields. Prices then pulled back slightly to $3,423 amid short-term profit-taking. Ongoing geopolitical uncertainty and expectations that the Fed may hold or cut rates continue to drive demand for safe-haven assets like gold.
📉 Technical Analysis:
Key Resistance Levels:
• $3,447 – Intraday high on June 13
• $3,465 – Strong Fibonacci extension resistance
• $3,480 – Next upside target if price breaks above $3,447
Key Support Levels:
• $3,423 – Current price and intraday congestion zone
• $3,410 – Minor support on the H4 chart
• $3,400 – Psychological support & 20-day MA
• EMA: Price is trading above the 09-day EMA → short-term trend remains bullish
• Candlestick / Volume / Momentum:
Strong bullish candle with high volume; RSI at 67 indicates further upside potential. Short lower wicks suggest limited selling pressure. MACD on both H4 and daily charts favors continued upside momentum.
📌 Outlook:
Gold is likely to continue rising if it holds the $3,410–$3,423 support zone. A break above $3,447 may open the path toward $3,480 or higher.
💡 Suggested Trading Strategy:
🔺 BUY XAU/USD:
• Entry: $3,420 – $3,425
• 🎯 TP: $3,480
• ❌ SL: $3,408
🔻 SELL XAU/USD
• Entry: $3,445 – $3,450
• 🎯 TP: $3,423 – $3,410
• ❌ SL: $3,457
