It’s the right time to make a golden layout!Gold opened at 3328 today and started the downward mode. After the European session, it continued to fall and broke the new low. The negative opening data of the US session also continued the downward mode. So far, it has reached the lowest point of 3255 and rebounded, but the strength is not very strong. After all, the upper pressure is still very strong. In the short term, we pay attention to the previous low point of 3295-3300, and focus on the upper 3305-3311. Today, the short-term operation of gold is mainly short-selling on rebounds, and long-selling on callbacks is supplemented.
From the 4-hour analysis, the upper short-term resistance is around 3295-3300, with focus on the important suppression at 3305-3311. The rebound will continue to be mainly short and look to fall back. The lower short-term support is around 3255-3245. Relying on this range as a whole, the main tone of high-altitude and low-multiple participation remains unchanged.
Gold operation strategy:
1. Short-selling in batches near the rebound of gold near 3295-3310, with a target of 3380-3370.
2. When gold falls back to around 3345-3455, go long in batches, with the target at 3370-3380.
Goldspot

Where will gold go?In 4 hours, it has fallen below the previous low of 3295, and will continue to fall. There are two supports below, namely 3280 and 3265. Don't expect a big rebound before going short in a negative market. If the rebound is large, it will not fall. This kind of negative decline is generally judged by the 15- and 30-minute patterns. When resistance appears in the big cycle, the market has actually fallen a lot.
Today, I think the pressure is mainly in the 3300 and 3310 areas. 3310 can be considered as the pressure of the top and bottom conversion. Pay attention to 3280 and 3265 below. If you consider going long, these two positions are the main positions. For the time being, the general direction is mainly short.

There are opportunities for both bulls and bears in gold!Gold fell back and closed lower yesterday. The daily line closed with a negative cross overnight. The overall market has not changed much. The short-term repeated tug-of-war is temporarily consolidating. Today is the closing of the weekly line, and we will continue to maintain the volatile thinking. In the 4H cycle, the Bollinger Bands closed, temporarily exerting pressure on the middle track. After rebounding to 3350 yesterday, it failed to continue and remained in a weak shock pattern. Therefore, today's operation is mainly short and supplemented by long. The upper pressure is at 3328 and 3336. Short according to the rebound strength, pay attention to the rise and fall of 3310 below. A breakthrough may see the previous low of 3295. If the support is not broken, you can consider going long.🔔For more specific operation details and strategy updates, please pay attention to the notification 🌐 at the bottom.
Gold operation suggestion: short gold around 3328-3338, target 3315-3310.

Gold shorting opportunity not to be missedGold hit the key resistance of 3350 and then fell under pressure, reaching a low of 3309, and was temporarily supported by the low point on Wednesday. The intraday showed a pattern of rapid decline after a volatile rise, highlighting the long-short tug-of-war pattern. The hourly line fell again after a pullback to 3328, indicating that there is still room for short-term retracement. The current operation needs to focus on key points: short orders can be entered again near the pullback of 3328-3335. If the market continues to decline, focus on the support range of 3300-3290, and long orders can be arranged if it stabilizes. The overall idea of oscillation is maintained. Before effectively breaking through 3350 or losing 3290, high-altitude and low-long are still the main strategy.
Gold recommendation: short near 3328-3335, target 3315-3305

Gold rebound is blocked and high-altitude strategy continuesGold continued its bullish correction yesterday, reaching 3336 in the European session, and continued to retreat in the US session, reaching a low of around 3312 before temporarily stopping, and started a second pullback correction, and finally closed around 3332. Today, it opened at 3333, rebounded to 3340, and then entered a shock consolidation. Currently, the upper side focuses on the suppression of the 3342-3350 area. If the price cannot effectively break through and stand firm in this area, gold still has room for further retracement. In terms of operation, it will continue to rely on this suppression range to maintain a high-altitude thinking during the day, and follow the trend to see a decline. The recent market trends are basically the same, bottoming out and rebounding. In terms of strategy, keep a sense of rhythm and mainly short at highs.For more specific operation points, please pay attention to the notification at the bottom🌐.

Gold is obviously suppressed, so we must go short!Yesterday, gold continued to fluctuate and fall under pressure at the 3360 mark. The US market further accelerated downward to break through the 3300 integer mark and reached a weak closing near 3295. The daily K-line closed with a suppressed fall and broke the bottom of the middle shadow. The overall gold price continued to fluctuate and fall in a weak rhythm. After reaching the lowest level of 3295, it rebounded and closed at 3323. Today, it opened at 3324. As of now, it has reached the highest level of 3337. At present, we are focusing on the suppression of 3340-3348. If the rebound is under pressure, we can still intervene in short orders. The recent market trends are basically the same - bottoming out and rebounding. In terms of operation, continue to keep shorting under pressure and long positions after bottoming out and rebounding.
From the current market trend, today's upper short-term resistance focuses on the 3338-3342 area. If it rebounds to this range and is under pressure, you can consider choosing an opportunity to arrange short orders. The lower support focuses on the 3315-3305 line. If it falls back and stabilizes, there is a possibility of a short-term rebound. The overall situation is still in a range-bound structure. It is recommended to focus on key points, buy high and sell low, follow the trend, and strictly control risks. For more specific operation points, please pay attention to the 🌐 notification at the bottom.

$XAUSD - Further sideways price action...The OANDA:XAUUSD price action seems to have morphed into a fourth-wave triangle. If true, we anticipate further sideways price action for the rest of the summer.

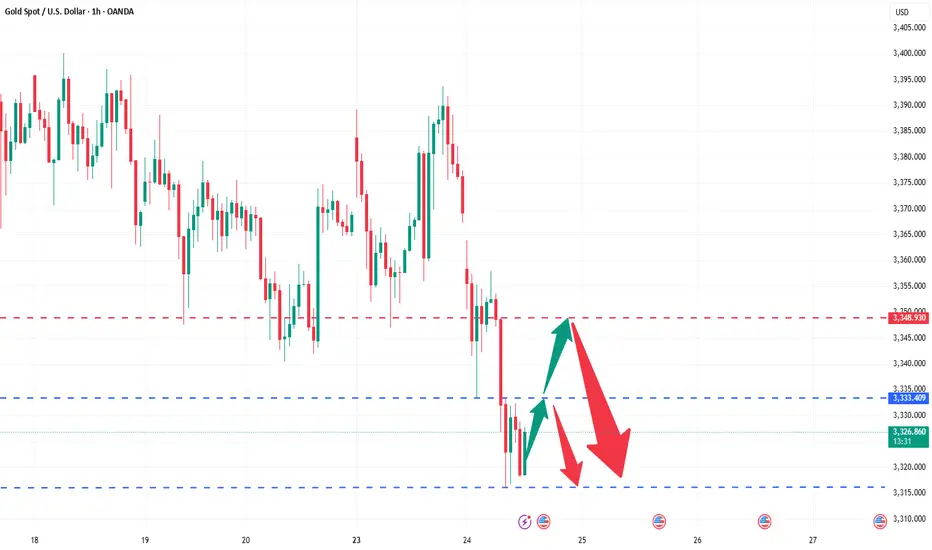
The golden storm is coming again, are you ready?Gold rebounded after falling back to 3333 in the first wave, and then rebounded to 3357 in the second wave before falling again, breaking through the previous low of 3333 and accelerating down to 3316. Currently, the short-term trend has stabilized in the 3316 area, which is also the support level for multiple rebounds in the previous period. After continuing to fall today, it has not broken through. We have arranged long orders in the 3316-3317 area in advance and have taken profits near 3331. Gold rebounded after stepping back again. Our long order plan is still in position. If the subsequent rebound breaks through the 3333 line, it is expected to further rise to the 3340-3348 area. We will try to short in this area.
In the short-term structure, the upper resistance focuses on the 3340-3348 area, and the lower support focuses on the 3310-3315 area. 3300-3305 is the watershed between the strength of long and short positions in the short term. The daily level is still under pressure as a whole, and the main idea of high altitude continues.
Gold operation strategy: short gold when it rebounds to around 3340-3348, target the 3330-3320 range.
Are you ready for the next wave of gold market?Gold fell back as expected after opening high. Today's strategy arranged long orders at 3350-3352, and successfully closed the market at around 3362 with profit. The subsequent three short orders also closed the market at a profit as expected. The points were perfectly predicted, and the long and short positions were perfectly grasped during the day. The strategic ideas were disclosed in advance and all were fulfilled.
At present, the overall trend of gold is still bullish, and it is in the adjustment stage in the short term. The large range this week is 3340-3405. Although there is a rebound, the upward pressure is still not small, and the gold price may continue the wide range of long and short fluctuations. Pay attention to the 3355-3340 area below. In terms of operation, long orders are arranged according to the strength of the retreat; pay attention to 3385 in the short term above. If it can effectively break through, look at 3395-3405. The strong pressure is still at the 3405 line. If it does not break, it will still fall under pressure. On the contrary, if it stabilizes, it is expected to hit last week's high.
Operation suggestion: When gold falls back to around 3355-3340, long orders can be arranged in batches, with the target at 3370-3380. Short orders will be adjusted according to the real-time market, please pay attention to the bottom 🌐 notification for specific points.

It’s the right time to make a golden layout!Last Friday, the overall gold price continued to be suppressed and fell back to fluctuate and adjust. Finally, it stabilized at the 3340 mark before closing and rebounded and fluctuated. The daily K line closed with a fluctuating number K. The overall gold price continued to be suppressed and fluctuated in the near term. However, the US military attacked Iran's nuclear facilities over the weekend, exacerbating geopolitical tensions in the Middle East, and the market's risk aversion sentiment heated up. Today, the gold price jumped high and fell back into a volatile state. In the short term, the gold price is likely to continue the wide range of long and short fluctuations, and continue to trade time for space. Although gold opened high and went low, it still did not break the bullish trend channel. Looking for opportunities to go long after stepping back is also the current trend.
From the current market trend, today's technical support below is around 3345-3355, focusing on the gains and losses of the 3340 line; the upper short-term resistance is around 3380-3385, focusing on the 3395-3405 line. Relying on this range to maintain the main tone of high-altitude low-multiple cycle participation during the day, the middle position is always more watchful and less active, cautious pursuit of orders, and patiently waiting for key points to enter the market.
Gold operation strategy: go long when gold falls back to around 3350-3355, and add to long positions when it falls back to 3340-3345. The target is 3370-3380.Counter-trend short orders will be entered at an appropriate time based on market changes, and the specific points will be subject to the bottom 🌐 notification.

Follow the trend and go short, and buy when the price falls backAffected by the situation in the Middle East, gold opened higher and lower again on Monday, and the trend was exactly the same as last Monday. After the opening, gold fell back to the 3352-3355 line and fluctuated. We planned to arrange long orders near 3350, but gold went up directly and did not give an entry opportunity. During the rebound, gold was blocked and under pressure at the 3366 line, and at the same time, there were signs of stagflation at high levels. Combined with the short-term adjustment needs, the strategy was to arrange short orders near 3364 and successfully stop profit at the target of 3350. Then we went long at the 3348-3350 line, which is also the preset long entry area. The current target continues to focus on the 3370-3380 area. So far, although gold opened high and went low, the overall bullish trend channel has not been broken, and the retracement to long is still the current mainstream direction.The specific points are subject to the bottom 🌐 notification.
From the current trend, the support below focuses on the 3340-3345 area. Combined with the stimulus of the Middle East situation over the weekend, the short-term upper resistance focuses on the 3380-3385 area. The expectation of breakthrough is still there, and the focus is on the suppression performance of the 3400-3415 line. The overall strategy continues to rely on the idea of buying on pullbacks. Watch more and do less in the middle position, chase orders cautiously, and wait patiently for clear signals at key points before intervening.
Gold operation strategy: Gold retracement near the 3340-3350 line to do more, the target is 3370-3380.

Hold on to the high point and go short decisively!Gold closed the weekly line today, maintaining the idea of oscillating downward. The 4H consecutive negatives tested the support of the lower Bollinger track. Although it was roundabout and saw-sawed, every decline would be accompanied by a new low. Therefore, hold the high point to see the bottom break and accelerate. The lower side will gradually look to 3338 and 3315. Among them, 3315 is a strong support for the weekly line. If it is not broken, you can consider going long; the upper rebound pressure is 3361 and 3375. In terms of operation, short according to the rebound strength, and the specific points are subject to the bottom 🌐 notification.
Operation suggestion: Short gold in batches near 3361-3375, with a target of 3350-3340.

Accurate operation, both long and short gains!Gold has experienced a typical volatile market today, first rising to 3400 and then falling back to around 3380 as expected. The short order plan we arranged in advance was successfully closed, and we successfully took this wave of callback profits. What is more worth mentioning is that we also accurately entered the long order in the previous round of retracement and steadily harvested the rebound profits. The rhythm of long and short switching is smooth, the strategy is clear, and the execution is decisive - this is what trading should be like. The market is repetitive, and opportunities are always there. Whether you can put the profit steadily into your pocket depends not on how many times you are right, but on whether you can execute it at the key points.
At present, the trend of gold shows that although there is a rebound after each decline, the strength is generally weak and it has never been able to break through the 3405 suppression level. The overall situation is still in a range of fluctuations, and market sentiment is still waiting for further guidance from the Fed. Therefore, short-term operations are still based on key points, and the market rhythm is slow, requiring more patience. In the case of no break at present, continue today's thinking to operate, unless there are sharp fluctuations in the short term or sudden news or geopolitical situations, then make adjustments.
Gold operation suggestions: 1. Gold short orders: short near 3397-3405, target 3385-3375. 2. Gold long orders: long near 3375-3370, 3365-3360 can cover positions, target 3380-3390-3400.
If you still lack direction in gold trading, you might as well try to follow my pace. The strategy is open and transparent, and the execution logic is clear and definite, which may bring new breakthroughs to your trading. The real value does not rely on verbal promises, but is verified by the market and time.

Perfect grasp of the high altitude and low multi rhythm!The current trend of gold continues yesterday's trend, maintaining a high rebound and volatile market. But don't panic, focus on the performance of the rebound. If the rebound fails to break through the upper resistance level, continue to focus on shorting. The upper suppression area is locked at the 3335-3345 line. Although the bullish performance has been strengthened, if it cannot effectively break through this range, it is still a short-term weak signal. From the current market, the upper pressure is obvious, and the rebound can rely on this range to layout the main short, focusing on the continuation of the decline. The lower support focuses on the 3293-3300 integer mark, and the overall long and short wide range of volatile market is maintained. Before the daily level fails to effectively break through and stand firm at the 3345 mark, it is difficult to say that the bulls will turn strong, and operations need to be cautious. If the market adjusts, the strategy will be updated simultaneously.
Operation strategy suggestion: Gold rebounds to the 3335-3345 first-line area to choose the opportunity to short, target the 3295-3306 range, strictly control risks, and follow the trend.

Gold fluctuates repeatedly, hiding great opportunities!After the opening of gold today, the bulls and bears played fiercely. In the early trading, it fell to 3293 and received temporary support, then stabilized and rebounded. It broke through the high point of 3320 in the Asian session and continued to rise above 3330. However, the price was under obvious pressure near 3330, and the momentum indicators (MACD, RSI) showed a top divergence at the same time, reflecting the exhaustion of bullish momentum and limited short-term upside space.
From the technical structure, gold has effectively fallen below the middle track support of the H4 cycle, and at the same time lost the upward trend line built since the low point in June. The two breakout positions are highly overlapped, constituting an obvious technical weakening signal. The current trend is trapped in the key resistance suppression area, and it is expected to enter a high-level shock and weakening stage.
The operation suggestions are as follows:
🔸Strategy direction: short-term thinking
🔸Entry area: 3335–3345 range
🔸Defense reference: stop loss above 3350
🔸Target expectation: look down to 3305, break to 3293 or even 3280 near the extension support
In terms of fundamentals, the US dollar index is under short-term pressure, mainly due to the decline in the US fiscal outlook and US Treasury yields; but the non-agricultural data boosted economic resilience, which cooled the market's expectations for a rapid rate cut this year, restricting the rebound space of gold prices. Although risk aversion has support, it has not yet become a dominant driver. The current market sentiment remains cautiously neutral.
Overall judgment: The short-term rebound of gold prices is limited, and the short-term trend is gradually released after the structural break. It is recommended to follow the trend and go high, control risks, and steadily execute trading plans.

XAUUSD (GOLD) | 4H | SWING TRADING Good morning, my friends,
Gold is currently at the 3355.0 level.
Even if gold makes a correction at this point, my target remains 3461.0.
This is a swing trading model, so there may be delays in reaching my target. However, I am confident that I will reach it eventually.
Once we hit that level, I will share an update for you all.
Dear friends, your likes are always my biggest motivation to keep sharing analyses. That’s why I kindly ask each of my followers to show their support—please don’t hold back on the likes.
I sincerely thank everyone who supports me with their likes. It truly means a lot

The key is whether the price can be maintained above 3044.61
Hello, traders.
If you "Follow", you can always get new information quickly.
Please also click "Boost".
Have a nice day today.
-------------------------------------
The April TradingView competition is sponsored by PEPPERSTONE.
Accordingly, we will look at the coins (tokens) and items that can be traded in the competition.
I will tell you about the XAAUSD chart.
--------------------------------------
(XAAUSD 1D chart)
It is continuously updating the new high (ATH).
Accordingly, the key is whether the price can be maintained above 3044.61 and rise to around the Fibonacci ratio 1.414 (3102.84).
Therefore, if the price is maintained above 3044.61 when the competition starts, a long position is expected to be advantageous.
-
(30m chart)
The areas marked with circles correspond to support and resistance areas.
Among them, the important support and resistance areas are around 3044.61, 3019.81, and 2998.08.
-
Thank you for reading to the end.
I hope you have a successful trade.
--------------------------------------------------

Gold ahead of Fed Rate decisionFundamental analysis: My earlier Selling signal was confirmed on Hourly 4 chart under prolonged weakness and Price-action respecting the trendline guarding the downtrend (very Bearish formation) as Hourly 1 chart is already an aggressive Descending Channel (width opened on Williams) that should reach it’s next Lower High’s (currently Trading slightly below Triple Top's formation) and Oversold state near my take Profit of #2,627.80 Support in extension. If the bands are widened Traders may witness #2,622.80 pivot point test on the correction back down after current upside extension but not Lower. In any case I will update my Targets or levels of Profit taking if I decide to exit earlier than #2,622.80 Support in extension to be in accordance with the Daily chart’s period.
My position: #2,648.80 was excellent re-Sell point and regarding Fed Rate decision, I expect Rate to be Lowered and hawkish stance on the aftermath which can make Gold suffer even more.

Long-Term Gold Price Channel Analysis (Gold Spot / USD)FX_IDC:XAUUSD
OANDA:XAUUSD
This is a candlestick analysis of Gold Spot (XAU/USD) for 6 months that goes through historical data from the 1930s . It makes use of a logarithmic scale and appears key support and resistance levels, as well as regression trendlines, that facilitate long-term price continuity.The purple trendlines depict varying channels in Fibonacci from -1 to 1.5 so that one can observe the key zones of support and resistance that gold has usually adhered to in the past.The center line (0) is represented in black and is the median of all the previous actions, where the price usually stays.Spring lines denote the significant price levels: $1,345.42 is a long-term lower support and $3,736.64 is an upper resistance level if we take into account the historical track record for a particular stock .The current price index is around $2,647.99 , with the stock having moved in a dominant upward trend (+13.82% this quarter).The vision of the future: If we are seeing a downtrend period in gold’s history, there is a fairly good possibility of a developing uptrend that will take gold near resistance price at the upper channel which is expected around 2030. This format is combined with historical trends and is a projection of the future price movements that all together provide a broader perspective to investors.

XAUUSD | Forecast | Day Time FrameThe daily time frame has already confirmed a bullish trend. The identified resistance zone is the current area of interest, likely to sweep the entire buy-side liquidity, and then the market may move into a bearish trend for a while until it grabs sell-side liquidity (at least until inducement).

XAUUSD | GOLDSPOT | New perspective | follow-up detailsWe dive deep into the recent movements of Gold (XAUUSD) following the release of the US Nonfarm Payrolls (NFP) data. On Friday, Gold initially surged to the $2,310 zone after the NFP numbers missed markets' expectations, signalling a cooling jobs market. However, bears quickly took control, pushing the price back into a demand zone identified on the chart.
The positive tone to market sentiment, driven by a rally in equity markets, may have contributed to Gold's decline, despite its safe-haven appeal during times of crisis. Additionally, the likelihood of the Federal Reserve cutting interest rates sooner than anticipated could weigh on the US Dollar (USD), as evidenced by sliding US Treasury yields.
Fed Governor Bowman's hawkish remarks, expressing willingness to hike rates if inflation stalls, and the solid US employment report further shaped market expectations. In this video, we analyze these developments and decipher the potential behavior of the XAUUSD market as we head into the new trading week.
XAUUSD Technical Overview:
In this video, we conducted a thorough analysis of the XAUUSD chart, integrating both technical and fundamental perspectives.
Our focus for the upcoming week centres around the $2,285 zone, which holds significant historical importance and is poised to influence next week's trading activity significantly. Sustained bullish momentum above this level could fuel continued buying interest, potentially driving prices to new highs. Conversely, a breach below the $2,285 level, accompanied by ongoing selling pressure, may indicate a resurgence of bearish sentiment.
Join me as we unpack the implications of these factors and explore possible trading opportunities in the Gold market. Don't forget to like, subscribe, and hit the notification bell to stay updated with my latest analysis and insights.
#GoldAnalysis #XAUUSD #NFP #ForexTrading #MarketAnalysis #TradingStrategy
#GoldMarket #SafeHavenAssets 📺🔔💼
Disclaimer Notice:
Please be aware that margin trading in the foreign exchange market, including commodity trading, CFDs, stocks, and other instruments, carries a high level of risk and may not be suitable for all investors. The content of this speculative material, including all data, is provided by me for educational purposes only and to assist in making independent investment decisions. All information presented here is for reference purposes only, and I do not assume any responsibility for its accuracy.
It is important that you carefully evaluate your investment experience, financial situation, investment objectives, and risk tolerance level. Before making any investment, it is advisable to consult with your independent financial advisor to assess the suitability of your circumstances.
Please note that I cannot guarantee the accuracy of the information provided, and I am not liable for any loss or damage that may directly or indirectly result from the content or the receipt of any instructions or notifications associated with it.
Remember that past performance is not necessarily indicative of future results. Keep this in mind while considering any investment opportunities.

$CNGRES- Gold Hunt China continues to purchase Gold,
adding 23 Tons of the precious metal just the last month,
according to the World Gold Council.
Since November,
China has accumulated more than 180 Tons of Gold,
equating its official Gold State Reserves to around 2,136 Tons.

XAU/USD | New perspective | follow-up detailsAmidst the revision of the Consumer Price Index (CPI) numbers to accommodate new seasonal adjustment factors, the XAU/USD faced bearish pressure, culminating in a 0.50% dip, closing the week around the $2,025 area. This development has heightened focus on the upcoming Consumer Price Index (CPI) figures from January, as market participants seek insights for potential Federal Reserve (Fed) decisions.
Market participants are closely monitoring the Fed's actions, particularly as the soft CPI revisions appear to have provided some respite for officials contemplating rate adjustments. However, the strong Q1 growth predictions in the US market and escalating wage pressures within a tight job market suggest potential delays in rate cuts. Currently, the market sentiment indicates a shift from anticipating a cut in March to potentially expecting one in May. The forthcoming inflation reading will play a pivotal role in determining the timing of the easing cycle. Should the data support a delay in rate cuts, it could lead to further downside for the price of Gold.
In this video, we delve into the current market conditions from a technical standpoint, providing insights into understanding and interpreting these developments.
XAUUSD Technical Overview:
In this video, we conducted a comprehensive analysis of the XAUUSD chart, utilizing both technical and fundamental perspectives. Our examination included an in-depth study of key levels, historical price movements, market behaviors, and the interplay between buyers and sellers, aiming to unveil potential trading opportunities.
Our focal point for the week is the $2,025 zone, characterized by historical significance, rendering it a pivotal level. The sustainability of bullish momentum above this zone could pave the way for continued buying pressure, potentially propelling prices to new highs. Conversely, a breach below the $2,025 level, coupled with persistent selling pressure, might signal a resurgence of bearish sentiment.
Immerse yourself in the latest dynamics of the Gold market! Stay well-informed to make strategic investment decisions.
#GoldMarket #SafeHavenAssets 📺🔔💼
Disclaimer Notice:
Please be aware that margin trading in the foreign exchange market, including commodity trading, CFDs, stocks, and other instruments, carries a high level of risk and may not be suitable for all investors. The content of this speculative material, including all data, is provided by me for educational purposes only and to assist in making independent investment decisions. All information presented here is for reference purposes only, and I do not assume any responsibility for its accuracy.
It is important that you carefully evaluate your investment experience, financial situation, investment objectives, and risk tolerance level. Before making any investment, it is advisable to consult with your independent financial advisor to assess the suitability of your circumstances.
Please note that I cannot guarantee the accuracy of the information provided, and I am not liable for any loss or damage that may directly or indirectly result from the content or the receipt of any instructions or notifications associated with it.
Remember that past performance is not necessarily indicative of future results. Keep this in mind while considering any investment opportunities.
