XAU SellThis is an idea, not a guide or advice
We are currently observing a move to the down side after reaching liquidity zone, which was too much resistance. However, the downwards shift will test the demand area. If it holds, we will look for a move up to the current resistant area again. If it does break through that demand zone , we will possibly be looking at previous weekly and monthly supports.
Goldspot


Gold is about to break the long time descending channelGold has been on a decline path within 6 months or so, now by getting support of Ichimuko and gathering strength from the previous bearish leg and also getting provided by enough support from lower boundary of the channel, IS READY to make a move and find its way up. So keep an eye on it and hope we'll see its drought come to an end.
Trade Safe ...

XAUUSD 4H EFC REVERSAL INDICATOREFC REVERSAL INDICATOR
Shows Long/Short ENTRY Signal
Shows Long/Short EXIT Signal


Gold Price 2021 Roadmap - EWTThe Gold spot started the bearish Elliott wave on the daily timeframe. Right now, it's making the 5th wave. It has to cross 1824 - 1800 - 1776 to complete the fifth wave. The fifth wave will complete around 1690 .
If there will be the upside breakout of wave 4 , then it's a failure of the Elliott wave pattern. And the target for the uptrend will be as following 1980 - 2000 .

GOLD in Long term, May Get bullish...the momentum Divergence's Tell Us a long term Buy on the way...

XAUUSD - Gold - Advantage in Weak Economy Gold is favorite tool for Hedge Fund managers and other big players, They discussing now if Stocks on peak and can get correction so they will join Gold to defend their portfolios.
Gold range 2200 for upcoming weeks and months.

Focus on Gold- retest trend, gain more or not ?Key level: 1900$, if the price break down key level, we can see gold at 1800$

GOLD: DOUBLE HARMONIC BAT PATTERN IN D1 TIMEFRAME! 🔔Welcome back Traders, Investors and Community!
Analysis of #XAUUSD GOLD
If you have found this useful then help us support my page by hitting the LIKE button.
If you are not subscribed yet then please feel free to follow my page for daily updates and ideas. Thank you
It means a lot to us!
***
Strategy: Bearish BAT With potential Max R/R 2.09 - We will be waiting for all the confirmations to enter in this trade.
A clear chart is Always the best business card for a trader.
***
Your support and feedback will always welcome
Thank you for your time.
The information contained herein is not intended to be a source of advice or credit analysis
Regards,
Walter

What is the Future for the Gold Spot?The Gold spot has started to fall from the 6th of August 2020 and still falling. But it's moving downside with fluctuation in trend. It started to rise for a short period from the 30th of November 2020. And now, the trend will fall up to hurdle by crossing 1876 - 1872 . After the breakout of the hurdle( 1872 ), the trend will hit 1866 - 1860 .
But if the trend takes reversal from the hurdle and crosses the resistance, it will hit the following levels 1900 - 1906 .

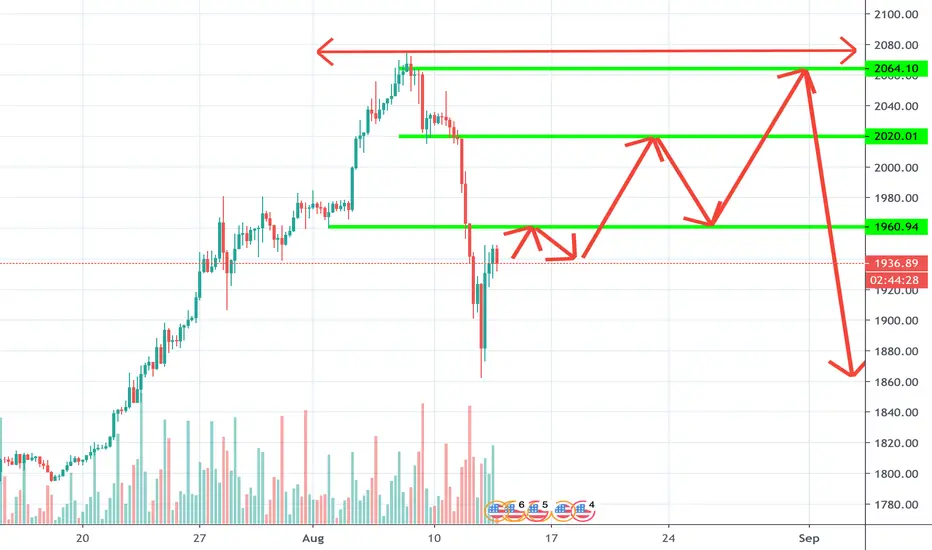
xauusdif price can pass the RED BOX and White line we can go up to 2069usd
but if price gets rejected from each level mentioned can back and test the support zone

I am bearish on GOLD WEEK OF 14TH DEC 2020I am bearish because, the pattern shifter over after hitting the 1875 area of support and reversing abruptly.
The potential area of bounce or TP1 and TP2 Zones are the marked rectangles.
Keep an eye on the false breakout area. It is possible but not mandatory.

THE BIGGER PICTURETesting triple support! This may help confirm an uptrend if we bounce off of 12D & 200D SMA.


GOLD Futures projectionThere has been 2 previous swings in Gold from the 50 weekly ma (Orange line), This looks like the 3 Swing IMO
According to the previous data this swing should be shorter in time than the previous 2 and may last between 60 to 85 days
Target area should be around +35% to +50% = $2400/$2700.
The trend is up and the fundaments haven't change at all. money printing and low interest rates.


GOLD - See What These Gann Fan & Fibonacci Retracement Value SayHere, I have used Gann Fan & Fibonacci Retracement to identify the next move of Gold Spot. Wherein, it is taking reversal from the 0.5 retracement value (highlighted by green square ). And now it's running under 3/1 & 4/1 Gann Fan value.
According to this chart, gold will keep drilling upward up to $1940 . After that, it can fall for 0.382 value of retracement. And a breakdown of this retracement means $1900 waiting ahead.
Overall we can see a bullish trend. That can be for $1960 - $1976 levels before Nov end.


Buying the Dip. The dip has been taken due to high risk reward risking almost 300 to 400 pips while targeting the reversal trend till 1945.
