The shot at the critical moment is the real trading opportunityGold bottomed out and rebounded yesterday, breaking the high slightly to touch 3390 before falling back. The daily line closed with a small bullish cross overnight, and the upward momentum has slowed down. Today it tends to fluctuate at a high level. In the 4H cycle, the Bollinger band is closing, and the overall bulls continue to run upward. The big positive line directly pulls up, which is relatively strong. The overall market is resistant to declines. Therefore, the big cycle does not expect a big drop for the time being, but the short-term trend fails to continue further. It is safe to maintain a pullback and go long. Pay attention to the support below 3365-3350. Go long after it stabilizes. First look at yesterday's high of 3390. If it breaks, there is a probability of going to 3400 or even around 3415, but be careful of a high rush and fall.
Goldtrade

Gold Struggles at Resistance – Indicates Lower Lows AheadGold has been in a clear downtrend after facing a strong rejection around the 3,438 level (main resistance zone). Price is currently moving within a descending channel, confirming the formation of lower highs and lower lows – a classic bearish market structure.
Currently, Gold is trading near 3,306, facing resistance at 3,339 (marked as a possible lower high). If price fails to break above this level and sustain, there is a strong probability of continuation towards 3,249 and even 3,216.
Key Technical Highlights
- Immediate Resistance: 3,339 – 3,353
- Support Levels: 3,301 (short-term), 3,249, and 3,216
A rejection near 3,339 can lead to another leg down targeting 3,249 and 3,216. However, a strong breakout above 3,339–3,353 could temporarily shift momentum towards 3,394.
Note
Please risk management in trading is a Key so use your money accordingly. If you like the idea then please like and boost. Thank you and Good Luck!

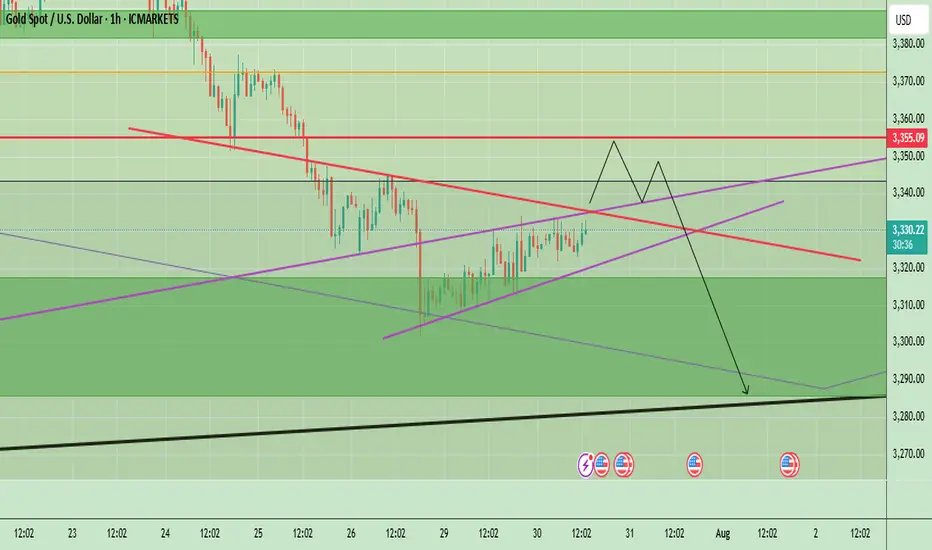
Gold Awaits Fed Rate Decision – Key Levels & Volatility AheadGold is currently trading near $3,332, showing a minor recovery after recent downward momentum. The price action on the 1-hour chart highlights a short-term ascending structure, which often acts as a corrective move rather than a strong bullish trend. The market previously saw significant selling pressure from above $3,355–$3,360, creating a short-term supply zone. Unless the price breaks and holds above this zone, the overall momentum remains bearish.
The chart also shows a projected price path where gold could push slightly higher toward $3,355, meet resistance, and potentially reverse downward again. Key support lies at $3,320, and if this breaks, we could see gold testing $3,290–$3,280 levels, aligning with the black trend line support. However, if bulls manage to break above $3,360, it would signal potential upside continuation toward $3,380–$3,400.
Key Points
- Key Resistance Levels: $3,355 and $3,360 (critical supply zone).
- Key Support Levels: $3,320 (short-term), followed by $3,290–$3,280 (major trendline support).
- Expected Short-Term Move: Possible push toward $3,355 → rejection → decline back toward $3,320 and possibly $3,290.
Bullish Breakout Scenario: A strong close above $3,360 could push price toward $3,380–$3,400.
Overall Bias: Bearish while trading below $3,360.
4hr Chart
Price remains under pressure below the descending trendline. A small pullback toward $3,345–$3,350 is possible, but as long as price stays under this resistance, the bias remains bearish with potential downside targets around $3,300–$3,280.
Key Levels:
- Resistance: $3,350 → $3,381 → $3,394
- Support: $3,324 → $3,281 → $3,254
Today’s FOMC interest rate decision is a key driver for Gold. Here’s the quick analysis:
- If Fed Hikes Rates or Maintains Hawkish Tone:
- Strong USD likely → Gold could face more selling pressure.
- Key support zones: $3,324 – $3,300, then $3,281 and $3,254.
- If Fed Pauses or Turns Dovish:
- Dollar weakens → Gold may bounce toward resistance zones.
- Upside levels: $3,355 – $3,360 and higher toward $3,381 – $3,394 (Fib levels).
Expect high volatility; $3,300 is a critical support to watch. A dovish Fed may give Gold short-term relief, but a hawkish stance could accelerate the downtrend.
Note
Please risk management in trading is a Key so use your money accordingly. If you like the idea then please like and boost. Thank you and Good Luck!
Gold Price Update – Bearish Flag Signals Possible Drop AheadGold is currently trading around $3,324, showing consolidation after a recent decline from the $3,345 region. The chart shows a bearish flag pattern forming after the sharp drop, indicating potential continuation of the downtrend. If gold fails to break above this region, sellers may push the price lower towards $3,301 and possibly $3,275.
The descending trend line adds further bearish pressure, limiting upside momentum unless gold decisively breaks and holds above $3,345. Overall, gold remains under short-term bearish sentiment, with the focus on support retests. Any bullish momentum will only be confirmed if the price closes above the flag and trendline resistance.
Key Points
Resistance Zones: $3,328 (0.618 Fib), $3,345 (flag top).
Support Zones: $3,301 (Fib base), $3,284, and $3,275 (bearish extension).
Trend Outlook: Short-term bearish unless price breaks above $3,345 with volume.
Bearish Targets: $3,301 → $3,284 → $3,275.
Bullish Invalidations: Break and close above $3,345 may shift bias to bullish.
Note
Please risk management in trading is a Key so use your money accordingly. If you like the idea then please like and boost. Thank you and Good Luck!

Gold rises strongly, aiming for a new high!Last Friday, gold continued to rise strongly, breaking through 3320 in the Asia-Europe session and accelerating its rise. The European session broke through the 3340 mark continuously. The US session broke through 3369 and then fell back. The daily line closed with a big positive line. It broke through the high for three consecutive days and returned to above 3360. The unilateral bullish pattern was re-established. Today, the gold price jumped high and broke through 3370 and then fluctuated at a high level. Although it rushed up, the strength was limited. It must be adjusted after a short-term retracement before it can continue to rise. Therefore, in terms of operation, we continue to maintain the main idea of retreating and multiplying. Pay attention to the 3340-3345 area for short-term support during the day, and look at the 3330 line for strong support. If it does not break, it will continue to be a good opportunity to buy low and do more. Taking advantage of the trend is still the current main tone. As long as the daily level does not break 3330, the bullish structure will not be destroyed.
🔹Support focus: 3340-3345, key support level 3330
🔹Resistance focus: 3380-3393 area
1️⃣ If the price falls back to 3340-3350, a light long position will be intervened, with the target of 3365-3370. A strong breakthrough can see a new high;
2️⃣ If the price rises to 3380-3393 and is under pressure, a short-term short position adjustment can be tried, with a short-term target of around 3360.
The specific real-time points and position arrangements will be updated at the bottom. Interested friends are advised to pay attention to my strategy tips in a timely manner and seize every opportunity reasonably.
The 3400 mark will be the key for next week!Gold has been up and down this week, and the shock wash has intensified. It bottomed out and rebounded at 3282, and then steadily pulled up. After a slow rise to 3368 on Friday, the retracement was limited, and finally closed at 3355. So can gold be expected to be strong? Is it possible to reach 3400 next week? From the trend point of view, it is too early to say that it will turn strong. 3400 is an insurmountable barrier. Only by breaking through 3400 can we see a stable strong bull. If it is suppressed below 3400, the bulls will not be stable and may fall back at any time. We can only see large range fluctuations. From the overall trend point of view, gold is currently fluctuating widely in the large range of 3250-3400. It is safe to buy below 3300, and it is easy to go up. After all, it is still upward in the long run. Next week, we will focus on the gains and losses of the 3400 mark. It is not recommended to chase the high position directly on Monday. On the one hand, the interruption of the market after the weekend holiday can easily cause discontinuous rise. In addition, after three consecutive positive lines on the daily line, there will either be a negative correction and a fall, or a large positive volume. Combined with the current trend and rhythm of gold, be careful of a high-rise fall, and it is easy to get trapped by chasing long positions at high positions. Don't feel that it will soar as soon as it rises, and the high point of 3500 seems to be within reach; don't feel that it will fall sharply as soon as it falls, and the 3000 mark is not a dream. We should stay away from those who sing long when it rises and sing short when it falls. The direction is not because you see it, so you believe it, but because you believe it, so you see it. There will always be a time when you chase the rise and sell the fall and you will return with nothing.
Moreover, the high point of 3365 has not formed a substantial break and stabilized. On Monday, we still need to focus on the gains and losses of this position, so we need to look at it from two aspects:
1. If it rises directly at the opening, pay attention to the pressure near 3370-3380 and you can go short, and the target is 3350-3340!
2. If the market falls back at the opening, go long around 3340-3330, with the target above the high point of 3360-3368.
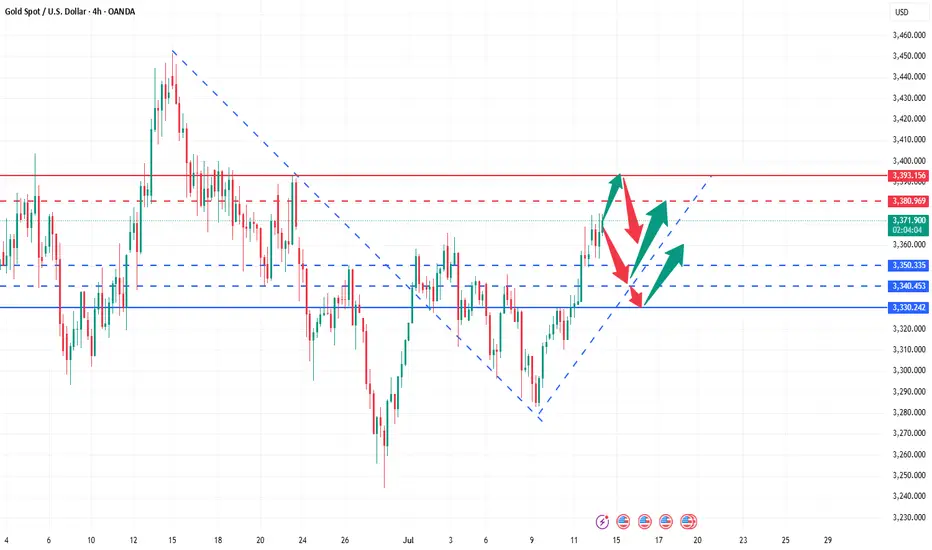
XAUUSD H4 Outlook – July 15, 2025After a sharp early-week move, gold is now pressing into H4 supply with clean CHoCHs and clear inducement in play. With CPI data and multiple FOMC speakers on deck, volatility is rising — and so are the opportunities. Let’s break down the current structure.
🔸 H4 Market Bias
Bias: Bearish unless we close firmly above 3420
Structure: Internal bearish flow remains → HL formed at 3210 → CHoCH → current move likely inducement
Context: Price has filled key FVGs and is testing unmitigated OBs in premium, with RSI approaching exhaustion
🔼 Zones Above Current Price:
3445–3465:
This is the weak high and final layer of buy-side liquidity. It includes an unfilled FVG and marks the upper limit of the premium range. If price reaches this zone, it’s likely to act as a trap before a deeper rejection.
3405–3420:
A clean imbalance zone left after the initial CHoCH push. It has already shown rejection once and is now positioned as the key area where a lower high could form. If price reacts here, it confirms continuation to the downside.
3360–3385:
This is the core supply OB, created from the CHoCH. It also aligns with the premium boundary and EMA21 resistance. Current price is already reacting here. Rejection confirms the bearish bias.
🔽 Zones Below Current Price:
3340–3355:
A minor wick-fill zone from past reactions. It may provide a small pause, but it’s structurally weak and more likely to break on momentum. Not a major support.
3300–3280:
This is the key intraday demand zone. It’s built from a previous BOS and sits at the 50% retracement of the last bullish leg. If this zone breaks, we open up deeper downside potential.
3240–3210:
The strongest demand OB on the chart. This is the HL origin and the 61.8% fib zone. If gold reaches here, expect a major decision: bounce or break.
3185–3160:
The final liquidity base under the higher low. If price sweeps this zone, it signals a major shift — potentially invalidating the June rally structure.
📊 Indicators & Flow Notes:
EMAs (5/21): Crossed bullishly, but testing overextension at 3360
RSI: Leaning overbought → potential for rejection at current zone
Volume: Bearish pressure expected if price fails to close above 3385
Fibonacci (last bullish leg): 50% sits at 3285; 61.8% near 3250
🧠 Trade Scenarios:
🔸 Bearish Setup (preferred):
→ Reject inside 3405–3420 → form LH under 3420 → clean drop toward 3300
→ Ideal confirmation = rejection wick or bearish engulfing on M30–H1
🔸 Bullish Breakout (less likely):
→ Break and hold above 3420 = potential squeeze into 3445–3465
→ Must be supported by CPI upside miss or dovish FOMC tone
→ But 3445–3465 remains weak liquidity — not a safe continuation zone
I appreciate every 🚀, comment, and follow I see on my plans.
If this breakdown helped sharpen your outlook, let me know below.
I post real levels with precision — no hype, just clean structure.
Keep following for daily sniper plans built from logic, not noise. 💼⚔️
--GoldFxMinds--
Chart and structure based on Trade Nation broker feed on TradingView. For educational purposes only — not financial advice.

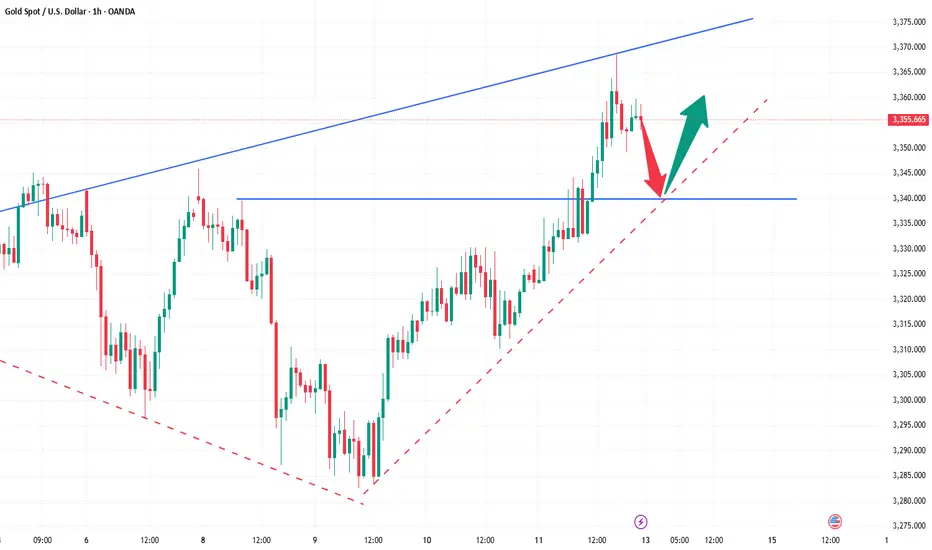
XAUUSD BREAKOUT TRADE (READ CAPTION)hi trader's. what do you think about gold
current price: 3318
gold is breakout bullish trade line gold retest down side. then gold taking support and jump upside
support zone: 3314,3295
resistance zone :3345,3365
stop loss: 3282 market low

How to accurately grasp gold trading opportunities?Gold rebounded as expected, and fell under pressure at the 3295-3296 line during the European session. This position was the key resistance level for the previous top and bottom conversion, and the range shock pattern continued. In terms of operation, the high-altitude and low-multiple ideas remain unchanged, and we will continue to pay attention to the short opportunities after the rebound.
📉 Operational ideas:
Short orders can be arranged in batches in the 3295-3311 area, and the target is 3280-3270 area;
If the support below 3260-3255 is effective, you can consider taking the opportunity to reverse long orders and participate in short-term.
📌Key position reference:
Upper pressure: 3295, 3311
Lower support: 3278-3275, 3260-3255
Gold strategy idea suggests shorting at 3291-3293, perfectly capturing the rebound high point! Smoothly reached the profit target of 3275, gaining 18pips! If you are not able to flexibly respond to the market in trading, and are not good at adjusting your trading ideas and rhythm in time with the market rhythm, you can pay attention to the bottom notification 🌐 to get more specific operation details and strategy updates. Let us work together to flexibly and steadily pursue more profits in the ever-changing market!

High-level fluctuations do not change the bullish trendThe 4-hour level shows that the gold price turned to high-level fluctuations after testing the upper track under pressure yesterday. There is still room for upward movement after the structure is completed. The 1-hour moving average system shows a golden cross divergent bullish arrangement, indicating that the short-term upward momentum is sufficient. The gold price continued to rise in the morning and hit a new high. The trend maintains a bull-dominated pattern. Although there was a correction in the US market yesterday, it stopped falling and stabilized at the key support level of 3330-3325 and broke through the previous high, further confirming the short-term strength. Therefore, once it pulls back to the upper area of 3335-3325, it will constitute a dip-buying opportunity. The intraday operation strategy recommends that the pullback be mainly long and the rebound short. The short-term support below focuses on the 3335-3325 range, and the upper short-term resistance level is 3365-3375.
Operation strategy: 1. Gold recommends long pullback near 3335-3325, with a target of 3350-3360.
2. It is recommended to short gold when it rebounds around 3365-3375, with the target at 3350-3340.

7.2 Gold price continues to fluctuate! Non-agricultural positionGold is still temporarily maintaining a wide range of fluctuations in the daily trend, and the price is temporarily under pressure around 3360. In the 4-hour level trend, after continuous high-level narrow fluctuations, the technical pattern has begun to weaken. The short-term moving average has gradually flattened from the previous upward divergence. After the continuous small-scale high-rise and fall back, the upward momentum in the short-term trend is insufficient. In the hourly level trend, the current running space is very compressed, but in the small-level cycle trend, after continuous fluctuations, the technical pattern has begun to weaken. The price has begun to slowly move out of the narrow range of fluctuations. Pay attention to the short-term adjustment and repair.

Gold encounters resistance at 3310-3320 and is about to fallAt present, gold has reached the 3300-3320 area as expected. As I mentioned in my previous article, we can consider shorting gold in batches in the 3300-3320 area;
Although gold once rebounded and stood above 3300, we can clearly see that when facing the short-term resistance area of 3310-3320, the bullish energy of gold has converged and began to show signs of stagflation, so the short-term resistance area of 3310-3320 is still valid.
Before gold breaks through 3310-3320, gold bears still have the upper hand. So as long as gold stays below 3310-3320 in the short term, don't be afraid of gold rebounds. Rebounds are opportunities to short gold. So I still tend to short gold at present, and have opened short gold positions according to the trading plan, hoping that gold can retreat to the target area: 3285-3275-3265. Do you think gold will fall as expected?

Gold (XAU/USD) Bearish Trade Setup – June 27, 2025Entry Point: Around 3,300.98 USD
Stop Loss (SL): ~3,312.20 USD
Take Profit (TP): 3,229.33 USD
Current Price: 3,286.15 USD
Risk-Reward Ratio: ~1:6.3
(Potential reward ≈ 71.65 pts; risk ≈ 11.22 pts)
Technical Breakdown:
Trend:
The price is in a short-term downtrend, supported by:
Lower highs and lower lows.
Price trading below both 50 EMA (red) and 200 EMA (blue), confirming bearish momentum.
Bearish Breakout:
Price broke below a key support-turned-resistance zone near 3,300–3,302, triggering sell pressure.
Resistance Area:
Strong rejection at 3,302–3,312 zone, which is now acting as resistance.
SL is placed just above this zone to protect against false breakouts.
Target Zone:
TP set at 3,229.33, aligning with a previous support zone — a logical area for price to react.
Strategy Notes:
Bias: Bearish
Entry confirmation: Already triggered.
Risk Management: SL placement is tight and strategic; RR ratio is highly favorable.
Next support below TP: If 3,229 breaks, further downside could follow.
Summary:
This setup shows a well-defined bearish continuation with a clean break of support, a controlled SL above resistance, and a strong RR ratio. A suitable trade for trend-following strategies, but price must not retrace above 3,312 for this idea to remain valid.

Gold may continue to rebound to 3350-3360If gold can stand above 3330 today, it will stimulate long trading behavior to a certain extent, especially the self-rescue behavior of trapped longs. Gold may continue to rebound and is expected to reach the 3345-3355 area. So there is no need to risk shorting gold near 3330 for the time being; although gold may continue to rebound, it is still under pressure in the 3350-3360-3370 area; and gold is still weak overall, so we can consider shorting gold in the 3350-3360 area and look at the target area of 3325-3315.
The Premium privilege of my account will end on June 26, and it will stop updating here from tomorrow. Friends in the channel have already made a lot of money by following my trading strategy. Friends who have not joined yet can join and receive the latest trading strategies and trading signals as soon as possible to escort your trading!

Gold XAU/USD Bullish Reversal Setup – Targeting $3,454.65Price: $3,384.41
Strategy: Buy/Long
🟦 Key Levels:
Entry Zone: Around $3,345.76
This level aligns with a previously tested support zone marked in purple.
Stop Loss: $3,331.56
Below the support zone, providing downside protection if the setup fails.
Target (TP): $3,454.65
Marked as EA TARGET POINT, suggesting a potential upside of 3.16% (~$105.83 gain).
📊 Technical Indicators:
Moving Averages:
200 EMA (blue): Near the entry level, adds strength to the support zone.
50 EMA (red): Recently crossed below price, indicating early bullish momentum.
Price Action:
Sharp bounce from support suggests buying interest.
Potential inverse head and shoulders pattern forming, which is a bullish reversal pattern.
🧠 Trade Idea:
Buy near $3,345.76,
Stop Loss at $3,331.56,
Take Profit at $3,454.65
Risk/Reward Ratio ≈ 1:3.3 — favorable setup for long positions.

Gold bottomed out and rebounded, continue to go longAffected by the situation in the Middle East, gold opened high and fell again on Monday, just like last Monday. At present, it has fallen back to the 3352-3355 line and fluctuated. Although it is under short-term pressure, the bull channel has not been broken, and the retracement is still a long opportunity. The support below is 3340-3345, and the short-term resistance is 3380-3385. It is only a matter of time before it breaks through. The key suppression is still in the 3400-3415 area. In terms of strategy, continue to arrange long orders around the retracement, be cautious in chasing orders in the middle oscillation zone, and wait patiently for key position signals. The specific points are subject to the bottom 🌐 notification.
Gold suggestion: arrange long orders around 3340-3350, and the target is 3370-3380.

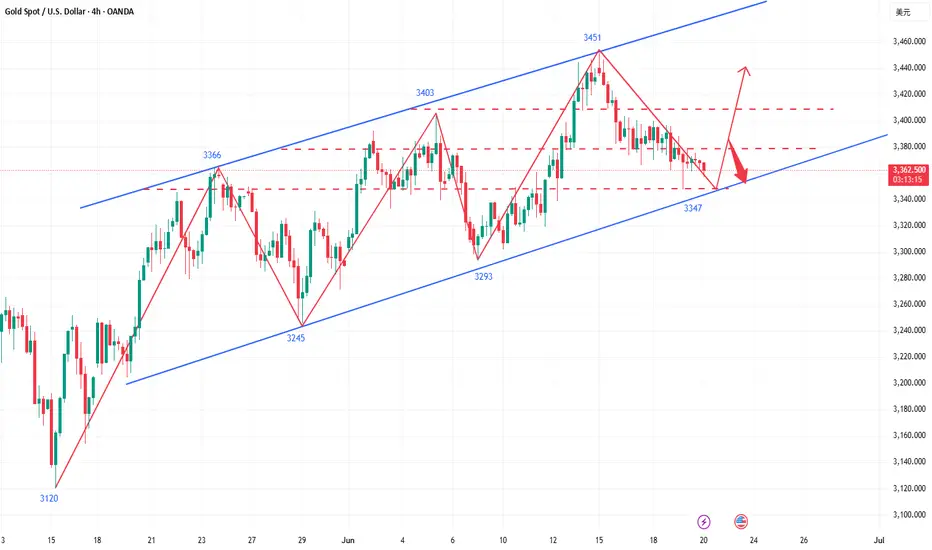
The bulls are not dead yet, it’s time to ambush at low levels!Gold only opened higher and rose on Monday this week, and then reached the highest level of 3452, and then started the road of shock and retracement this week. As of today, Friday, gold is still oscillating and adjusting in the lower range, but from the 4-hour market trend, the trend of gold is still dominated by bulls. In the short term, gold is oscillating and adjusting at a low level. Today, Friday, we will first focus on the support level of 3347-3353 below, which is also the starting point of the rebound yesterday. If this position is not broken today, Friday, we will mainly rebound and close.
From the 4-hour analysis, the support below focuses on 3347-3353, and the short-term resistance above focuses on the 3378-3385 level, with a focus on the 3408-3415 level. Continue to rely on this range to maintain the main tone of high-altitude low-multiple cycle participation unchanged, and the middle position is always more watchful and less active, cautiously chase orders, and patiently wait for key points to enter the market.
Gold operation strategy: Go long when gold falls back to 3347-3355, with a target of 3370-3380.
If you still lack direction in gold trading, you might as well try to follow my pace. The strategy is open and transparent, and the execution logic is clear and definite, which may bring new breakthroughs to your trading. The real value does not rely on verbal promises, but is verified by the market and time.
Gold continues to fluctuate, and range operations are effective!Gold opened high on Monday and then fell sharply. On Tuesday, it fluctuated and corrected with a cross-yang line. On Wednesday, the overall trend was also volatile. However, after the Fed's interest rate decision was announced on Wednesday, the price of gold fell to around 3362. The low point of this decline was just supported by the 10-day moving average. From a technical point of view, the support of the 10-day moving average at 3350 has become a key point. If this support can be effectively maintained, the gold price is expected to maintain a volatile pattern; once it breaks down, the short-selling force may continue, and then it will be necessary to look at the support of the 20-day moving average near 3350. In terms of upper resistance, the 5-day moving average is currently near 3390, which will suppress the upward movement of gold prices. Further resistance depends on the gains and losses of 3405.
There is not much change in the 4-hour chart. The lower track has not opened, and the support of 3360 is strong. It is still a bullish trend. However, it is worth noting that in the continuous rebound, the Bollinger middle track suppression point has not been broken. Relatively speaking, gold is weak and volatile in the medium term. Under the trend today, if it continues to rise, we must pay attention to the gains and losses of the dense suppression point 3405. If 3405 is broken, the trend strength will come out and we can see the high point of 3430. For intraday trading, we still maintain high-altitude and low-multiple, waiting for the trend strength to break through the space, and we are bullish above the support of 3350 during the day.
Gold operation strategy: It is recommended to short at the rebound of 3385-3390, with a target of 3370-3365; gold falls back to 3350-3355 and buys, with a target of 3375-3385;

Range oscillation, strategy remains unchanged!The Federal Reserve kept the interest rate unchanged. Gold did not break through the range we gave after all. The important support below is still at 3365-3360. Today, we continue to operate in the range and keep high and low as yesterday. Gold touched the lowest level of 3362 without breaking through, and still rebounded. The long orders of 3372 and 3363 that we arranged have successfully stopped profit at 3380, so we continue to operate in the range.
From the current analysis of gold trend, gold continues to focus on the important support of 3365-3360 below, and focuses on the short-term suppression of 3400-3415 above in the short term. The operation is mainly carried out in the range for the time being, and there is a high probability of continued volatility in the short term.
Gold operation strategy: Go long when gold falls back to 3375-3370, and cover long positions when it falls back to 3365-3360, with the target of 3380-3390-3400.

Have you seized the golden opportunity again and again?Today, the strength of gold is very weak. It only rushed up at the opening, and quickly fell below the 3400 mark. Keeping above the key point of 3400, gold continues to be bullish. Now that it has fallen below 3400, the short-term has gone out of the small-level top, and the market is no longer so strong. For our short-term operations, the short-term correction of gold prices focuses on the daily cycle MA5 support, and the weekly MA5 support is long. The rebound focuses on the 3403-3408 resistance card. The rebound can be followed by the short-term! Although gold has fallen below 3400, the short-term direction has changed, but the general direction has not changed. It is still bullish. In the future, we still have the opportunity to look at the high point of 3500, but we have to wait for the bottom to stabilize. Now we can only follow the trend. We will do what the market does.
From a technical point of view, the current macd high dead cross in 4 hours has a large volume, and the smart indicator sto is oversold, which represents the 4-hour shock trend. The current bollinger band three-track shrinkage in 4 hours also represents the range compression. At present, the upper pressure of 4 hours is located at the adhesion point of the middle rail and the moving average MA10 at 3404-3409, while the support corresponds to the moving average MA30 and MA10 near the 3380-3363 line. From the current 4 hours, if the price is to fall directly, the rebound will not exceed the 3420-3422.5 line. The current macd dead cross of the gold 1-hour line is shrinking and sticking, and the smart indicator sto is running downward, indicating that the hourly line continues to fluctuate weakly. What we need to pay attention to now is the adhesion pressure of the upper moving average MA60 and MA30 corresponding to the 3412 line. Pay attention to the resistance of 3403 in the short term. Today's short-term operation of gold recommends rebound shorting as the main, and callback long as the auxiliary, and pay attention to the support of 3380-3370 in the short term.

Short gold, it needs to retreat to the area around 3350!Gold is currently testing the support near 3380 again. According to the current trend of gold, gold is likely to break through 3380, and gold has stopped near 3400 many times during the rebound process, and the rebound strength of gold is lacking. If gold really wants to rebound, then after testing near 3380 many times and getting support at 3390, it should have rebounded to the 3410-3420 area, but it is obvious that gold has not yet touched the 3410-3420 area. Therefore, gold's performance is relatively weak and its correction trend should continue for now.
In terms of fundamentals, Iran is not decisive in its retaliatory behavior, so if the conflict in the Middle East does not escalate, gold may find it difficult to continue to rise. So according to the current trend and performance of gold, we should not be stubborn in long gold trading for the time being, and adjust our trading plan reasonably according to the market and price behavior. If gold continues to retreat, the first thing we need to pay attention to below is the 3355-3345 area, followed by the area near 3330. So for the next short-term trading, we can try to short gold in the 3395-3405 area.

Gold will inevitably fall after risingGold has risen sharply due to the violent geopolitical conflicts and the surge in risk aversion. It once reached around 3445, but in the process of falling back, it only touched 3408 and rebounded again, stabilizing above 3400. It is obvious that due to the changes in fundamentals, the sentiment of gold bulls is high; although the upward momentum of gold near 3440 has weakened, there is no clear signal of peaking yet!
For short-term trading, it is relatively difficult to participate at present. To be honest, I naturally don’t want to chase gold at a high level; but there are no more signals to support me to short gold for the time being. However, with the rebound of gold, the current short-term support below is in the 3425-3415 area, followed by the psychological support of the 3400 integer mark; and the short-term resistance above is in the 3455-3465 area, followed by the area near 3480.
Compared with the profit and loss ratio, I prefer shorting gold for short-term trading, because gold has performed relatively strongly in the London market. Logically, gold will have the inertia to rise in the New York market, so I think gold may rise and then fall in the New York market, so my current plan is to try shorting gold starting in the 3455-3465 area.
Because the changes in gold's fundamentals are more extreme and complex, you must set up SL when participating in transactions.

Have a nice BUY GOLD !!Dear traders you can get long on 3382$ Now on GOLD and enjoy.
Huge benefit is waiting for you.
Take care, relax and enjoy
