gold buyGold retreated to the $2,180 area after facing rejection near $2,200 during the European trading hours on Wednesday. With the benchmark 10-year US Treasury bond yield edging lower toward 4.2%, however, XAU/USD regained its traction and rose above $2,190.
On the flip side, any corrective decline is likely to find some support near the $2,164-2,163 area ahead of the $2,156-2,155 zone and the $2,147-2,146 region. A convincing break below the latter might prompt aggressive technical selling and drag the Gold price further towards the next relevant support near the $2,128-2,127 region en route to the $2,100 round-figure mark. The said handle should act as a strong base for the XAU/USD, which, if broken decisively, will suggest that the XAU/USD has topped out in the near term and will pave the way for deeper losses.
gold buy now 2193
target 2220
resistance 2160
Goldtrade

GoId - UPDATE - 28 - 03 - 2024"Investors are eyeing an opportunity with a target price (TP) set at 2209, coupled with a stop-loss point at 2177.500, indicating a strategic approach to managing risk and maximizing returns in the market. This vision suggests a calculated investment strategy, where traders are aiming to capitalize on potential gains while mitigating losses. The decision to buy is influenced by not only technical price levels but also the fundamental strength of the asset, possibly reflected in its price-to-earnings (PE) ratio. This approach reflects a blend of technical analysis and fundamental research, highlighting a comprehensive approach to trading or investing."

gold buy chartFollowing a quiet Asian session, Gold turned north and advanced to $2,180 in the American session. Although the benchmark 10-year US Treasury bond yield stays in positive territory above 4.2%, the selling pressure surrounding the USD supports XAU/USD.
The daily chart for the XAU/USD pair shows that bulls retain control. The bright metal develops above all its moving averages, with the 20 Simple Moving Average (SMA) heading firmly north below the current level while above also bullish 100 and 200 SMAs. At the same time, technical indicators have turned flat within positive levels after correcting extreme overbought conditions, reflecting absent selling interest.
Gold has been considered a highly valuable commodity for millennia and the gold price is widely followed in financial markets around the world. Mostly quoted in US Dollars (XAU/USD), gold price tends to increase as stocks and bonds decline. The metal holds its value well, making it a reliable safe-haven. It's traded constantly based on the intra-day spot rate. Improve your technical analysis of live gold prices with the real-time XAU/USD chart, and read our latest gold news, expert analysis and gold price forecast.
gold buy now 2174
TP1 2180
TP2 2190
TP3 2200
SL 2150

A sure-win trade: Shorting goldDear friends, gold fell back again after hitting near 2181 during the rebound, and is currently trading near 2175. My trading idea today is very simple. First of all, the rhythm of short trading is still maintained overall, but the short-term level constitutes a head and shoulders bottom pattern, so in terms of trading, we first go long gold, and then short gold. For specific details, you can refer to my previous article. First, go long gold near the 2165 position; second, short gold in batches in the 2175-2180 area.
Judging from the current trend, although gold touched near the 2181 position during the rebound, the upper shadow line on the candle chart has grown, proving that there is still very strong resistance above, and the trend has surged higher and fallen back, with an obvious peaking callback signal. If gold fails to break through the key area of 2180-2185, then gold is expected to usher in a correction phase and continue to fall under pressure.
In terms of trading, even though our gold short position has not yet hit TP, we currently have a pretty good profit, and we can continue to hold it and wait for the profit to increase significantly. I will share detailed trading ideas and trading signals every day to help everyone grasp the rhythm of market trading. If you are currently losing money, I am confident that I can help you turn losses into profits in a short period of time; if you are currently making profits, I am more capable of helping you increase profits. If you want to seize more trading opportunities and profits, you can follow the channel at the bottom of the article to get detailed trading signals and trading strategies in the first time.

Still maintain the trading rhythm of shorting goldDear friends, gold reached a record high of 2222 after the interest rate decision last week. However, as the U.S. dollar index rose again, gold fell off a cliff. Judging from the candlestick chart, although gold touched a high of 2222, we can see that the entity closed below 2195 on the daily chart, so this is obviously a sweep. Then there is no reason for gold to reach a new high, and it is even difficult to break through the 2195 position.
From the perspective of the general trend, gold's mid-term decline has basically been confirmed, and it will be difficult to reach new highs later. And now we are mainly confirming the rhythm at which gold will fall. From the current point of view, the energy of gold bulls still exists to resist the decline of gold, so it is difficult for gold to fall to the bottom in one step. Therefore, gold is likely to continue its volatile decline, and there may be a possibility of a partial rebound during the correction. This will add some difficulty to our trading rhythm. If we cannot control the transaction price well, we are likely to suffer losses in the transaction. Gold is currently trading at 2165. You certainly cannot short gold directly at this position. We first focus on the 2175-2180 resistance area above.
I will share detailed trading ideas and trading signals every day to help everyone grasp the rhythm of market trading. If you are currently losing money, I am confident that I can help you turn losses into profits; if you are currently making profits, I am more capable of helping you increase profits. If you want to seize more trading opportunities and profits, you can follow the channel at the bottom of the article to get detailed trading signals and trading strategies in the first time.

GOLD road to $2200+ BATTLING INFLATIONGold , known as "the safest hedge against inflation" is looking promising with the current banking crisis occurring. People are scared of banks and see Gold as a safest investment as a store of value without relying on the banks or without having USD.
Some economical factors that influence the price of GOLD with the current inflation at 5%:
-Inflation hedge: As I mentioned earlier, gold is often viewed as a hedge against inflation. When inflation rises, the value of fiat currencies can decrease, but gold tends to retain its value. This can make gold an attractive investment in times of high inflation, as it can help investors preserve their purchasing power.
-Weak US dollar: When the US dollar is weak, the price of gold in US dollars tends to rise. This is because gold is priced in US dollars on global markets, so a weaker dollar makes gold relatively cheaper for investors using other currencies. In other words, a weak US dollar can support demand for gold and increase its price.
-Geopolitical risks: Gold is often seen as a safe haven asset in times of geopolitical uncertainty or market volatility. If there are concerns about political instability, trade tensions, or other risks that could disrupt global markets, investors may seek out gold as a way to diversify their portfolios and reduce risk.
-Central bank policy: If central banks engage in policies that devalue currencies or reduce interest rates, this can increase demand for gold as an alternative store of value. For example, if the Federal Reserve were to keep interest rates low for an extended period, this could support the price of gold.
-
Supply and demand: Gold is a finite resource, and new sources of gold production are becoming harder to find. If demand for gold increases while supply remains relatively constant, this could support the price of gold.

GOLD BUY SHORTGold has been considered a highly valuable commodity for millennia and the gold price is widely followed in financial markets around the world. Mostly quoted in US Dollars (XAU/USD), gold price tends to increase as stocks and bonds decline. The metal holds its value well, making it a reliable safe-haven. It’s traded constantly based on the intra-day spot rate. Improve your technical analysis of live gold prices with the real-time XAU/USD chart, and read our latest gold news, expert analysis and gold price forecast.
On the flip side, the $2,175-2,176 region now seems to have emerged as an immediate strong barrier, which if cleared should allow the Gold price to challenge the record peak, around the $2,195 area touched last week. Some follow-through buying beyond the $2,200 mark will set the stage for the resumption of the uptrend witnessed since the beginning of this month
GOLD NOW BUY 2152
TP1 2156
TP2 2160
TP3 2165
TP4 2170
SL2140
Gold short Gold retreated marginally from all-time highs as US T-bond yields edged higher. Near-term technical outlook shows XAU/USD is still overbought. The Fed will announce policy decisions and publish the dot plot this week.
On the flip side, the $2,178-2,180 region now seems to have emerged as an immediate strong barrier, which if cleared should allow the Gold price to challenge the record peak, around the $2,195 area touched last week. Some follow-through buying beyond the $2,200 mark will be seen as a fresh trigger for bullish traders and set the stage for the resumption of a well-established uptrend witnessed since the beginning of this month. Confirm signal
Gold now buy 2155
Target 2160
Target.2165
Target 2170
Target 2180
Target 2190
SL 2135

GOLD H1 / Potential Small Retracement / Looking for a Long 💡Hello Traders!
This is My idea related to Gold H1. The bearish sentiment is still strong for short positions, that's why I will look for a long entry after I see a small retracement. I expect a confirmation of closing a FVG on a smaller timeframe.
Traders, if my proposal resonates with you or if you hold a divergent viewpoint regarding this trade, feel free to share your thoughts in the comments. I welcome the opportunity to hear your perspectives.
____________________________________
Follow, like, and comment to see my content:
www.tradingview.com

XAUUSD weekly Target confirm Gold retreats to $2,160 as US yields rebound
Gold lost its traction and retreated to the $2,160 area. Following a downward correction in the European session, the benchmark 10-year US Treasury bond yield recovered to 4.3%, making it difficult for XAU/USD to hold its ground.
On the flip side, the $2,178-2,180 region now seems to have emerged as an immediate strong barrier, which if cleared should allow the Gold price to challenge the record peak, around the $2,195 area touched last week. Some follow-through buying beyond the $2,200 mark will be seen as a fresh trigger for bullish traders and set the stage for the resumption of a well-established uptrend witnessed since the beginning of this month.
Gold News: Read the Latest Analysis on XAU/USD
Gold has been considered a highly valuable commodity for millennia and the gold price is widely followed in financial markets around the world. Mostly quoted in US Dollars (XAU/USD), gold price tends to increase as stocks and bonds decline. The metal holds its value well, making it a reliable safe-haven. It’s traded constantly based on the intra-day spot rate. Improve your technical analysis of live gold prices with the real-time XAU/USD chart, and read our latest gold news, expert analysis and gold price forecast.
GOLD NOW BUY 2156
TP1 2180
TP2 2200
TP 2240
SL 2110

GOLD BUY Gold lost its traction and declined toward $2,160 in the early American session on Thursday. The benchmark 10-year US Treasury bond yield is up more than 0.5% on the day above 4.2% after producer inflation and Retail Sales data from the US, weighing on XAU/USD
From a technical perspective, any subsequent move up is more likely to confront some resistance near the $2,195 region, or the record peak touched last Friday. Some follow-through buying beyond the $2,200 mark will push the Gold price to uncharted territory and be seen as a fresh trigger for bulls, setting the stage for an extension of the recent blowout rally witnessed over the past two weeks or so.
On the flip side, the $2,155-2,150 area now seems to protect the immediate downside, below which the Gold price could slide to the next relevant support near the $2,128-2,127 zone. The corrective decline could extend further towards the $2,100 round figure, which should act as a strong base for the XAU/USD. A convincing break below might prompt some technical selling and pave the way for deeper losses.
GOLD NOW BUY 2163
TP1 2167
TP2 2171
TP3 2195
SL2150

XAUUSD BUY CONFIRM SGINAL Gold Price: Current Pricing, Prices Chart & Rate Graph
Gold has been considered a highly valuable commodity for millennia and the gold price is widely followed in financial markets around the world. Mostly quoted in US Dollars (XAU/USD), gold price tends to increase as stocks and bonds decline. The metal holds its value well, making it a reliable safe-haven. It’s traded constantly based on the intra-day spot rate. Improve your technical analysis of live gold prices with the real-time XAU/USD chart, and read our latest gold news, expert analysis and gold price forecast.
gold now buy 2158
TP1 2162
TP2 2166
TP3 2170
TP4 2200
SL 2140

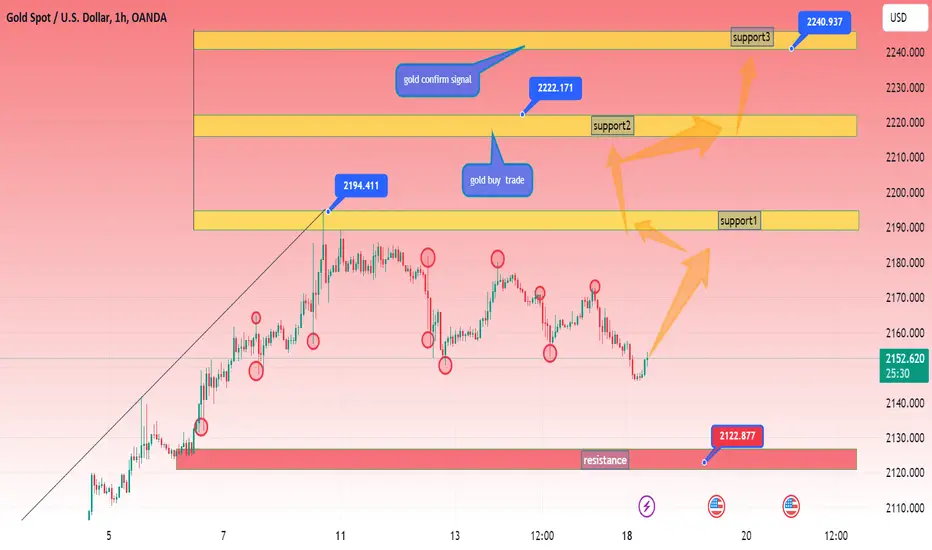
gold buy confirm signal Gold Price: Current Pricing, Prices Chart & Rate Graph
Gold has been considered a highly valuable commodity for millennia and the gold price is widely followed in financial markets around the world. Mostly quoted in US Dollars (XAU/USD), gold price tends to increase as stocks and bonds decline. The metal holds its value well, making it a reliable safe-haven. It’s traded constantly based on the intra-day spot rate. Improve your technical analysis of live gold prices with the real-time XAU/USD chart, and read our latest gold news, expert analysis and gold price forecast.
Gold price shot to a fresh record high on Friday after the US jobs report showed a spike in the unemployment rate and bolstered expectations that the Fed will start cutting rates in June. The momentum, however, stalled ahead of the $2,200 round-figure mark amid a late US Dollar bounce.
GOLD NOW BUY 2180
TP1 2185
TP2 2190
TP3 2200
SL 2160

Xauusd Long Gold prints an all-time high near $2,200
Further upside sees prices of the yellow metal advance past the $2,190 mark per troy ounce at the end of the week against the backdrop of the weaker Dollar, marginal moves in US yields and rising bets of an interest rate cut by the Fed at its June event.
Gold price (XAU/USD) extends its upside around $2,165 after reaching a record high during the early European session on Friday. A weaker US Dollar (USD) and a decline in US Treasury bond yields provide some support to the gold price. Furthermore, the rising expectation for the first rate cut by the Federal Reserve (Fed) in the June meeting boosts the demand for gold price.
Gold has been considered a highly valuable commodity for millennia and the gold price is widely followed in financial markets around the world. Mostly quoted in US Dollars (XAU/USD), gold price tends to increase as stocks and bonds decline. The metal holds its value well, making it a reliable safe-haven. It’s traded constantly based on the intra-day spot rate. Improve your technical analysis of live gold prices with the real-time XAU/USD chart, and read our latest gold news, expert analysis and gold price forecast.
Gold Now buy 2179
Target confirm 2200
SL 2165

XAUUSD I am looking for a sell here Hello guys! I am looking a good sell from here on xauusd my take profit which I am looking at was 2088. Let's rock
together I want you all guys win just win just in blueeeees!

GOLD BUYGold gained traction and advanced to its highest level since early February above $2,040 on Thursday. The benchmark 10-year US Treasury bond yield drops toward 4.2% after US PCE inflation data, providing a boost to XAU/USD.As I wrote on Wednesday, “Gold is trading sideways as XAU/USD has failed to break above the $2,035 psychological resistance level for the last 12 days.” Nevertheless, XAU/USD prices cleared that level and are testing a downslope resistance trendline drawn from the highs of the year near the $2,040-$2,050 region. A breach of the latter will expose the February 1 high at $2,065.60, ahead of the December 28 high at $2,088.48. GOLD NOW BUY 2044 TP1 2048 TP2 2052 TP 2066 SL2030

GOLD H1 / Short Trade Opportunity / Target Price 1975 ✅💲Hello Traders!
This is my idea related to GOLD H1. I see that we are in a bearish channel and at the moment, I would like to see a retracement from the resistance level. I will look for a short entry if I will see a confirmation of a bearish market structure. I expect that we will reach the PWL and my target is 1975.
Traders, if my proposal resonates with you or if you hold a divergent viewpoint regarding this trade, feel free to share your thoughts in the comments. I welcome the opportunity to hear your perspectives.
____________________________________
Follow, like, and comment to see my content:
www.tradingview.com

Xauusd sell confirm signal Gold price continues its winning spell for the fourth straight trading session. The precious metal attempts to deliver a decisive break above the 20 and 50-day Exponential Moving Averages (EMAs), which trade around $2,020.
Gold price (XAU/USD) extends its bullish streak for the fourth straight trading session on
The triangle could breakout in either direction, however, the odds marginally favor a move in the direction of the trend prior to the formation of the triangle – in this case up. A decisive break above or below the triangle boundary lines would indicate a breakout was underway
Gold Price Forecast: Fed policy will remain key to the outlook for XAU/USD in the months ahead – ING
Gold has been trading in a narrow range awaiting clues on the prospects for US interest rates. Economists at ING analyze the yellow metal’s outlook
Xauusd sell confirm

GOLD H1 / Potential Short Trade / Valid Entry in Supply Area❗️💲Hello Traders!
This is my idea related to Gold. My previous forecast hit the target of 5R, now I expect a retracement, to the FVG and I will look for a confirmation in the supply area. The structure is still bearish, and my bias is for short entries.
Traders, if you liked my idea or if you have a different vision related to this trade, write in the comments. I will be glad to see your perspective.
____________________________________
Follow, like, and comment to see my content:
www.tradingview.com

GOLD M30 / LONG TRADE EXECUTION ALERT ❗️💲Hello Traders!
This is my idea related to Gold M30. I expect a bullish move to close the FVG. The bearish sentiment on the market is still bearish, and I consider this indicator a good chance to look for long entries.
My target is under the OB level.
Traders, if you liked my idea or if you have a different vision related to this trade, write in the comments. I will be glad to see your perspective.
____________________________________
Follow, like, and comment to see my content:
www.tradingview.com

🟢🟢 ( gold short analysis signals)Hello traders what do you think about Gold)?
Technical analysis 🟢
Traders are you doing gold CPI inflation short 2057 2025) gold moving down trandline my trade position selling zoon 2037 2000 1999)🟢
Support 2024 2006 1999
Resistance 2037 2050 2065
Safe trade ❤🙏 plaes like ❣️ and comments follow next analysis 😀

GOLD SELLHello, according to my analysis of the gold market. There is a good opportunity to sell with the break of the ascending channel as shown by the analysis. We also notice the formation of a falling peak towards the bottom, which indicates further decline in the coming days. I recommend selling from the 2070 area, where the red triangle is located. Good luck everyone.

🔃🔃 ( GOLD first Long) and short) technical analysis 👍Hello traders 💯 what do think about Gold moving this week?
I think 💭 gold moving this week first Long 2030 + 2040 Breakdown fullback down 👇
2000+ 1980
Technical analysis 👍👇
TVC:DXY FXOPEN:XAUUSD
DXY INDEX FULLBACK Up this week 105.000 FXOPEN:XAUUSD TVC:DXY
Technical analysis 👍👇
Safe trade ❤ plaes like ❣️ and comments FXOPEN:XAUUSD TVC:DXY
