Gold buy confirm signals Gold price defended the rising trendline support at $1,978 on Monday. But sellers have flexed their muscles, teasing an ascending triangle breakdown on the daily chart early Tuesday.
If Gold price manages to yield a daily closing below the rising trendline support, now at $1,981, a downside break from the ascending triangle will be confirmed.
Immediate cushion is seen at a November 1 low of $1,970. A failure to resist above the latter will target a bullish 21-day Simple Moving Average (SMA) at $1,966.
Gold buy now 1973
Target 1977
Target 1981
Target 1991
SL 1963
Goldtrade

💡GOLDOZ: Anxiously waiting for NonfarmThe positive sentiment in the stock market is a significant obstacle for gold prices. Conversely, declining US Treasury yields, a weakening US dollar, and the expectation that the Federal Reserve will not raise interest rates further could support an increase in gold prices. Furthermore, the ongoing conflict between Israel and Hamas and global economic conditions are factors that favor a bullish outlook for safe-haven gold.
Gold appears poised to continue its recent recovery and gain momentum on Thursday. Additionally, the MACD histogram and double line on the H4 chart seem to be forming a double bottom. Although higher interest rates can negatively impact gold due to increased opportunity costs, some investors may still choose to hold gold as a hedge against uncertainty.

GOLD: Bullish Wave 5 in Play?While waiting for completion of our impulsive structure (see chart below), from a technical point of view, it is possible to follow some speculative trade. In this case, we can try to take a long position with a stop loss somewhere below yesterday's low. This is a high risk trade, so it would be a good choice to use a small size.
(Click and Play on chart below)
Trade with care
Like | Share | Comment

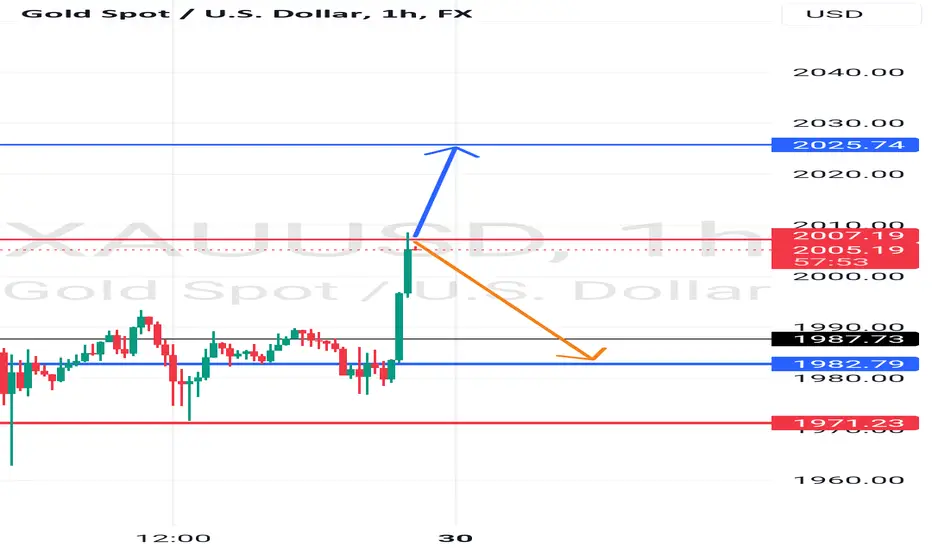
Well placed our mentioned area 2007#GOLD... marker just placed our upside mentioned area 2007,
It's market first resistance above 2k
Keep close it because next 10 to 15 points ride will start from here.
It's your key level now..
Trade wisely
Good luck
💡GOLDOZ: Signs of decline are forming?Gold had its second consecutive day of price decline after the news Employment Cost Index q/q and CB Consumer Confidence were announced.
The H1 gold price push down has broken through the accumulation price range above to go down, but has not created a new low price bottom and broken the latest bottom, so it has not created a downtrend. With the current downward pressure on prices, H1 gold can wait for a rebound to sell. If the price is pushed up to the old peak, it is a sign that H1 gold is stronger again, then you can wait to buy.

XAUUSD:26/10 Today’s Trading StrategyGold prices rose rapidly in the short term on Thursday. Although the U.S. 10-year Treasury bond yield climbed 13 basis points to 4.95% on Wednesday and the U.S. dollar index rose 0.24% to 106.79, the gold price seemed unaffected by the recent strength of the U.S. dollar. Hitting a one-week high above 1985. According to the description of gold's K-line chart yesterday, it can be seen that the price of gold closed with a long lower shadow line and was close to a cross star pattern, which indicates that gold has certain support at the low of 1953. Generally speaking, after this pattern appears, the shadow line will often be covered the next day and the bullish move will continue. The gold market showed a volatile long and short trend in yesterday's trading. When the price hit 1962, gold bulls rose rapidly. After the highest point hit 1987, it came under pressure and finally closed at 1979.
At the daily level, a physical small positive line was included, further responding to the previous long lower shadow line rising pattern. The price of gold has broken through the previous high at a high price, which is undoubtedly a manifestation of a bullish pattern. On the 4-hour chart yesterday, the price of gold fluctuated back and forth between the upper and lower Bollinger Bands. It consolidated and transitioned during the Asian and European trading sessions, and showed a trend of rising first and then falling during the US trading session. Despite the tug-of-war between the upper and lower Bollinger Bands, the price still recovered to a higher position at the end of the session. The current opening price is at the upper track of Bollinger Band, and the lows are constantly rising. The 4-hour chart shows that bulls are trading sideways, waiting for further gains. We need to pay attention to the resistance of 1997-2000 at the top; we focus on 1977-1970 at the bottom.
SELL:1995-1997
SL:2002
TP1:1900
TP2:1885
BUY:1977-1979
SL:1972
TP1:1986
TP2:1992

XAUUSD:27/10 Today’s Trading StrategyYesterday, the price of gold rose to an intraday high of 1993.52 during the European trading session, but then fell back, finally closing up 0.26% at 1984.74. From a fundamental perspective, the trend of spot gold prices is affected by multiple factors. On the one hand, global economic instability, geopolitical tensions and uncertainty in financial markets will drive investors to seek safe-haven assets, thereby increasing gold prices. On the other hand, the trend of the US dollar index also has an impact on the price of gold.
Gold bulls once again tested the 1990 pressure level, but were unable to break through further due to the impact of unfavorable GDP data. Although it encountered resistance above 1990, strong support appeared in the 1970 area when it fell back, showing that the power of bulls cannot be underestimated. The market continues to observe pressure conditions around the 2000 mark, but the overall trend remains bullish. The bulls gradually took advantage, the lows continued to rise, and the highs gradually rose, showing a positive trend in market sentiment.
The gold 1-hour level shows obvious bullish rising characteristics, and the K-line continues to run above the moving average. Each correction can be supported by the moving average and rebound quickly, forming an effective trend line support. Gold is still operating according to this law. After stepping back on the moving average support in early trading, you can continue to go long, and secondly, you can continue to go long near 1980. We need to pay attention to the pressure level above, which is the high point of 1997. Once it breaks through, it will start a new band of rise. Then it is recommended that the short-term operation idea of gold during the day is to mainly pull back and go long, and then consider selling at a high level. The resistance at the top focuses on the 1997-2000 line, and if the level breaks, we will continue to look at 2020. The support at the bottom focuses on the 1980-1982 line.
SELL:1997~2000
SL:2003
TP1:1990
TP2:1985
BUY:1980~1982
SL:1975
TP1:1990
TP2:1996

💡 GOLD: Forecasts continue to increase❤️ Hello all traders. Hope you have a nice weekend. Here is some gold information next week
➡️ The ongoing surge in gold prices is likely to persist, given the persistent tensions in the Middle East. Commodity strategist Daniel Ghali from TD Securities Company has pointed out that the potential for increased gold acquisitions remains high if the Middle East conflict escalates further, as gold has traditionally served as a reliable "safe haven" for preserving capital, especially in the face of a strengthening USD and escalating geopolitical concerns.
➡️ Consequently, numerous forecasts anticipate a continued uptrend in gold prices for the upcoming week. In a survey conducted by Kitco News involving 11 Wall Street analysts, 6 of them expressed optimism about gold's price increase. Meanwhile, 3 analysts anticipate a decline in precious metal values, and 2 expect gold to remain relatively stable.

XAUUSD:25/10 Today’s Trading StrategyGold rebounded near the four-hour lower track support yesterday. It once touched the $1977 line during the session, then retreated to $1970, and finally closed with a cross line. From a disk perspective, the daily chart shows a double cross pattern, indicating that the market is repeatedly reaching tops, but the bullish power has not completely subsided. Last night's rebound also confirmed this.
Well, today gold started to rebound after falling to the 1970 line at the opening. The gold price is currently fluctuating near the 1974 line. Judging from the current trend, the upper pressure on the 1982 line is the key resistance level, while the rebound and downward trend line is suppressed on the 1977 line. In addition, the daily closing line for two consecutive trading days showed an inverted hammer positive line shape, and the negative closing line overnight also indicated that the market may be weakening. Gold broke through yesterday and fell. The rebound failed to return above 1980. The market began to fluctuate. The current rebound is close to pressure. In early trading, it relied on the pressure of 1980 to fall! The downward trend in the gold market remains unchanged. 1975 is exactly at the Fibonacci 50% division position on the hourly chart, and is also the suppression point of the upper trend line on the hourly chart.
Looking at the 1-hour level, gold has started to fall from the 1997 position. It has already experienced two downward trends, and the K-line directly fell below the moving average support. Yesterday's rebound failed to return above the moving average, and the moving average is about to form a dead cross! This has never happened before in gold’s rise! This means that the rise in gold is over and the adjustment has begun! Gold's rebound in the U.S. market yesterday was a little bigger. The market first returned to volatility, and it shot up to 2,000 points and fell back. This shows that it is still a bit difficult to win 2,000 points in one fell swoop without special stimulation in the short term. Observing the previous trend, after the first double top pattern appeared, gold corrected downward by $10. After the second double top pattern appeared, gold fell by $20. According to this rule, the third correction should correspond to a decline of $30. If the calculation is based on $1,977, the price of gold may fall further to around $1,947 in the future. In terms of operation ideas, it is recommended to mainly go short on rebounds, and then go long on the position. The top short-term focus is on the 1980-1982 first-line resistance, and the bottom short-term focus is on the 1950-1947 first-line support.
BUY:1959~1961
SL:1954
TP1:1968
TP2:1974
SELL:1977-1980
SL:1985
TP1:1970
TP2:1964

Bitcoin, GOLD, and SLV Rose Sharply from Israel-Hamas WarCommodities and Bitcoin experienced significant increases in value around October 7, which is the date that the Israel-Hamas War started. Commodities and Bitcoin experienced significant increases in value around October 7, which is the date that the Israel-Hamas War started. GOLD had a bullish bounce off the light blue trend line at $1,808 on Friday October 6 (marked by the orange circle). The Israel-Hamas conflict started on Saturday, and on Monday GOLD opened with very bullish price action that started the rally.
Key Price Levels:
GOLD has breached a key $1,989 yellow resistance level on this move up, and $2,073 is the next key resistance target if GOLD continues to trend upwards. The $1,989 resistance level has been suppressing GOLD's price since May 2023, and GOLD managed to finally breach this level in just a few weeks. It seems that the war is contributing to bullish price action for GOLD, SLV, and Bitcoin.

XAUUSD (Gold) Shorts towards 1980.000 and below.For gold, I have two possible scenarios that could play out this week. As we've seen a huge impulsive move to the upside recently, we are now expecting price to drop in order to fill in the imbalances and take out the liquidity that was left below. Currently, it's in a very good daily supply zone that caused a CHOCH to the downside on (may 23rd.) Hence why I am expecting price to distribute and sell off down towards the levels of 1980 and below.
As of now, we are looking for imminent sells towards the 8hr demand zone as that's a good zone that could respect the bullish trend in order for price to keep going bullish. So from there, I would be looking for a buy opportunity. However, As we have too much liquidity underneath that 8hr demand zone i.e. engineering liquidity, untouched asia lows and swing lows. We won't be surprised if price pushed further down all the way to 1920.000 or even 1880.000. As we will find a lower time frame confirmation for the sell I would personally take out at 1980 to see if price wants to respect it or violate the demand completely.
Scenario (B) is that the daily supply zone that it is currently in will fail and mitigate the extreme (9hr) Supply zone above it in order to then sell off from there towards 1980. To add, there is an untouched Asian high within the current zone so I can see that being taken before price wants to start reversing. Regardless as of now, we are looking for sell opportunities from the current price or the 9hr supply above to target the 1980.000 region, to then ultimately see if price wants to break or respect that POI.
My confluences for XAUUSD shorts are as follows:
- Price has tapped into a daily supply zone that has caused a change of character to the downside.
- Rejection from the POI has started to become visible due to the small consolidation where price has initially entered.
- Lots of liquidity to the downside in the form of trendlines, untouched Asian lows and imbalances.
- Price has been bullish for quite some time and the impulsive move requires some sort of pullback that I am expecting currently.
- Price has also swept lots of liquidity on the higher time frame that was gathered since couple months ago.
- Bottom side of the consolidation left around 1952 needs to be swept as well as its just swept the top side of it.
P.S. We have to be ADAPTIVE in all scenarios as the more angles we can look at something the more prepared we can be when price makes its decisions. Hence why in this detailed analysis we are looking at more than one way of what XAUUSD forecast might look like.

GOLD ( XAUUSD ) Long Term Buying Trading IdeaHello Traders
In This Chart GOLD HOURLY Forex Forecast By FOREX PLANET
today Gold analysis 👆
🟢This Chart includes_ (GOLD market update)
🟢What is The Next Opportunity on GOLD Market
🟢how to Enter to the Valid Entry With Assurance Profit
This CHART is For Trader's that Want to Improve Their Technical Analysis Skills and Their Trading By Understanding How To Analyze The Market Using Multiple Timeframes and Understanding The Bigger Picture on the Charts

XAUUSD: This week's summary and next week's trading ideas
Recent spot gold trend is strong, the situation in the Middle East brought about by the risk aversion to the gold price constitutes obvious support, gold bulls stood on Friday 2000 US dollars, once on the 2008 US dollars.
On the evening of the 28th, Israel again bombed a house in Gaza. On the 27th, the United Nations adopted a draft resolution on the Palestinian-Israeli issue, calling for a truce. In addition, Friday's events between India and Pakistan, northern Myanmar, and the US air strike on Syria have brought new variables to the geopolitical risk.
However, the US economy remains strong, the data released in the week showed that the US GDP grew by 4.9% in the third quarter, and the pressure on the Federal Reserve to raise interest rates further remains, which has a certain pressure on gold prices. Gold has recently shown a strong upward trend, although it has retreated in the short term, but the overall trend remains upward.
It is expected that the market will usher in a large probability of continued rise in the future. Next Monday's operation is recommended to be mainly low.
Gold:buy@2000-2002 tp 2015-2023
If you are confused about trading, please join me, I believe you will have a great harvest!

XAUUSD setup for the weekOANDA:XAUUSD for the week, I expect price to be bullish to about 2048, so for everyday of the week, I look to go long. My idea

Xauusd yearly setupMY analysis on GOLDUSD
this could take a year or so to actualize.
However, this is what I see price doing
anytime soon.

💡 GOLDOZ: Show Resilience with Second Consecutive Gain🟢Gold saw its second consecutive day of gains today, following yesterday's positive performance. On the daily chart (D1), the price exhibited significant upward momentum, with a wide trading range, but it closed approximately halfway between the high and low, forming a spinning top candlestick pattern. This pattern, known as a Spinning Top, typically indicates a market in balance, with supply and demand levels closely matched throughout the trading day.
🟢Notably, the previous day's D1 candle closed above the upper boundary, suggesting the possibility of overbought conditions and potential for a downward correction. The price faces a strong resistance near the 2,000 zone, which may prove challenging to surpass. Nevertheless, the overall daily chart structure for Gold remains bullish.
🟢Turning to the hourly chart (H1), Gold is currently trading within a relatively narrow price range, indicating a period of sideways movement. The formation of higher highs and higher lows on the H1 chart suggests upward pressure. Given the overbought condition observed on the D1 chart and the presence of significant resistance, traders monitoring the H1 chart may consider waiting for a pullback before considering long positions.
🟢However, should the H1 price break below recent lows and start trending lower, a downtrend on the hourly chart could emerge, providing an opportunity to explore short positions.

🚨GOLD PREMIUM REVERSAL 🚨Last week ⚜️Gold⚜️managed to trigger the Bearing daily Order Block.
The Order Block mitigation✅ took place between the 0.71 and 0.79 OTE.
Starting from tomorrow 30 October 2023 traders should be prepared for⏬ SELL⏬ Opportunities.I advice traders to wait for the Reversal Structure to form at the 15m timeframe.
Target Pips: 195 ✅(3.3RR)
🚨Caution 🚨
Stoploss Pips : 59 ❎

Gold weekly forecast 30.10 - 03.11This week will be a very tricky one. My long term bias is still bullish but I am very cautious about the current price and we will see why later. In my opinion it is too high to buy and too bullish to sell. The last few days of the month are very manipulated, so the price could move very strangely. Banks may use the NFP to take profits and create a bearish week.
Gold reached 1H reaction area and could retrace from the current area, but 2030 area (grey area) is a strong manipulation on almost any time frame, telling me that the zone is very strong and the real retracement can happen from there.
Macroeconomics
This week I will not be watching the FOMC, employment or recession. Not because they are not important, but at the moment the geopolitical risk (war between Israel and Hamas) is too strong push gold higher, regardless of other factors.
On Friday, Israel started ground operations against Hamas and gold went to the moon. Over the weekend, Hamas struck back. In such a scenario gold may open with a bullish gap.
Top-Down Analysis
Monthly
As I said last week, gold is forming a strong bullish manipulation on the monthly TF. For me, this means that the metal will rise in the coming months.
Weekly
On the weekly TF I see the 2080 area as a target. We targeted this liquidity last time when gold reached it, but gold could not break through.
8H
Price has reached the first reaction zone and the second one is 2030. Because of the strong geopolitical factor, I cannot say which zone will be respected, but in my opinion we will see a retracement.
Benchmark
Although gold is rising very aggressively against all currencies, the sector is not moving. This is why the benchmark indices are also ranging.
This chart tells me that gold is outperforming the sector, which means there is no reason to buy another metal instead of gold.
The second thing is the divergence between gold and the other metals. If the sector is not moving in the same direction, gold is very likely to be overbought.
The first week we had a strong move from the banks. They wiped out the professional traders and bought.
In the second week, the professionals stepped in and bought.
In the third week, the crowds are coming. They see that the war does not stop and everyone buys.
When the crowd steps in, banks usually take profits. They need liquidity to cover their positions.
COT Reports
No change in positions - still bullish.
US Yields
Yields have reached the 5% level where Interest rates are.
There is also news that big players such as Bill Ackman are taking profits on their bond selling positions.
That is why I think that yields will pause for a long time or fall. In any case, this is a bullish factor for gold.
XAUUSD vs GDX
For the second week, the GDX is not rising and is diverging with gold. Something is going on and as always the retail traders will understand it too late.
Gold vs Silver
The second SMT divergence after the GDX. It is very strange that silver is not moving - not at all.
Volume Spread Analysis - Wyckoff patterns
Big rejection after the high was taken. Doji day on the futures market, made with a lot of volume.
And this is the 3d SMT divergence.
This chart is another signal that the price may be overbought.
Momentum
Gold is very overbought. As I said earlier, it is too high to buy.

XAU IN DAILY TIMEFRAME The gold trend will continue to rise, but we will need a correction to continue the route, and the demand zone is where the price will throw up.

GOLD BUYING ON DIPS MORE WAR TENSIONS AHEAD !!!HELLO TRADERS,,
As you see see our previous analysis on gold is running according to our analysis
i am expecting more bullish trend will continues if Israeli & Gaza war spread day by day
and here as we can see we are going to closing of monthly & daily candle near a resistance zone
fundamentally Gold is showing us clear view that traders and investors are betting on safe haven
UN parliament has voted in favour of Humanitarian Cease Fire but here now case is different...
Fundamentally+Technically more bullish moves are coming up i am expecting Gold will hit 2100$ any time in coming weeks
next week high impact data ahead
-- Fed Interest Rates Decisions
--Initial Jobless Claims
--NFP
this is a trade idea only not a financial advice
we appropriate Ur love & comment us to share Ur ideas on Gold Trade
Stay tuned for more updates

💡 XAUUSD: Next predictionGold saw an increase in value yesterday, but it formed a Spinning Top candlestick pattern. This pattern, known as a Spinning Top, indicates a balance between supply and demand throughout the trading day. The D1 candle closed above the upper boundary, possibly signaling an overbought situation, which could lead to a potential downward correction. Additionally, there is a significant resistance zone above, comprising the psychological level of 2000 and a previous peak. Given the overbought conditions, it is not advisable to pursue buying opportunities at this moment.
On the H1 chart, gold is currently testing the resistance represented by the previous peak. Considering the overbought conditions on the D1 timeframe and the confluence of resistance levels, it is prudent to exercise caution when considering buying or chasing the price higher on the H1 chart. It may be more reasonable to wait for a potential price decrease before considering a buying strategy.

GOLD ANALYSIS OCTOBER 27: TRADING CAUTION💯GOLD PLAN UPDATE DAILY: October 27
👉 Gold prices increased slightly during Thursday's trading session. Data from the US “paints a picture of a very strong economy”, raising the possibility that the Fed could raise interest rates again, putting gold at a disadvantage but the problem of Middle East risks let go of the pressure from this data.
👉 Many investors believe that the stability of the economy means the Fed may have to keep interest rates higher for longer to bring inflation to its 2% target. Such an interest rate outlook is likely to cause 10-year US Treasury bond yields to continue to rise in the coming sessions, putting downward pressure on gold prices.
👉 After the US GDP report, investors' focus will turn to new US inflation data, with the personal consumption expenditure price index (PCE) expected to be announced by the Ministry of Commerce this evening. now.
👉 Yesterday's plan had AE winning the Sell bet of 190 pips. Today I will still give priority to Buy orders, AE, gold is now strongly influenced by news of geopolitical instability.
📌Today's trading plan:
🔽 Sell Gold Entry: 1994x – 1997x
SL 1999
TP 1985 - 1978
🔼 Buy Gold Entry: 1978x – 1976x
Sl 1973
TP 1983 – 1992 -2010

Consolidation before 2000The chart is pretty explanatory.
Price is currently selling , and there's a zone at 1983-1979, if Price breaks below it, we would see Price gun for 1968-1966 but if it rejects Price, the journey to 2000 would resume.
Risk management is advised
I would love to hear your thoughts 🤔 on this, so feel free to leave a comment ✍.
Please like 👍❤ this idea 💡 if you agree, and follow me for more updates ❕❕❕
