Gold: Rebounding from U.S. highs and entering short positions
Gold is now rebounding from the pressure position, and the market is encountering resistance! The current trend is consistent with Dukang's prediction in early trading. If it encounters resistance at the 1927 pressure position, it will be difficult for the market to rise! Then just empty it! The European market has already indicated that the current price of 1928 is short, and now it continues to be short and bearish. Those who have not entered the market will continue to be short at the current price!
The trend is completely in line with expectations, and it is carried out according to the script written by Du Kang, so just go short now! Gold is now expected to fluctuate within the 1928-15 range. Shorting at pressure positions is bearish! More after getting support below!
Shocking trend, sell high and buy low! After the data, the market has not gone out of the trend. Now the probability is even smaller, it is a wide range of shocks, so make sure the shocks are done well, and just operate in the opposite direction at the key pressure support position! In volatile market conditions, it is most taboo to chase the rise and kill the fall! Empty, the U.S. market 1928 is directly empty!
Goldtrade

Short With PMIThe price started to rise from the beginning of the day and broke yesterday's ceilings and completed its pullbacks
My main area will be 1930
After the price reaches this area and collect liquidity, I will enter a sell position and my target will be today's opening price.
Price recovery requires high liquidity and I will wait for the New York session
Don't forget today we have PMI news on the dollar and it will provide the necessary liquidity

GOLD 4H OUTLOOK GOLD
if the direction stabilized under 1920 will touch 1915 then 1908 then 1901
but if the direction stabilized above 1928 will touch 1937 then 1945 then 1951
resistance line : 1937,1945,1951
support line :1915, 1908 , 1901

XAUUSD: 22/9 Today Trading StrategyGold rebounded slightly on Friday after yesterday's heavy losses, and the price of gold is now around 1925. The Federal Reserve kept interest rates unchanged as scheduled on Wednesday. There is still the possibility of the Federal Reserve raising interest rates in the future, pushing the US dollar higher, which will put pressure on gold prices in the short term. Gold prices fell to their lowest yesterday, near 1913. Today is the last transaction of the week. Today, gold's fluctuations this week can be described as twists and turns. Yesterday, the gold market continued its decline. It opened at 1930.8 in early trading, and then the market rose slightly to 1931.5. Then the market began to fall back, with the daily minimum reaching around 1913. Afterwards, the market consolidated, and the daily line finally closed at 1919, and then the daily line closed at 1919. The line closes with a big negative line with a long lower shadow. After finishing in this form, today's market still has certain technical needs for adjustment. On the 4-hour chart, there has been a wave of negative declines, and it has returned to a wide range of shocks. There is still support close to the 1900 mark. Judging from the closing situation at the end of the day, it is not a unilateral weak decline.
Gold operating strategy:
BUY:1912-1915
SL:1908
TP1:1920
TP2:1925

XAUUSD - GOLD Short term Sell or Continuation of Uptrend?Likely scenario for short-term sell before the continuation to the upside.
1915 to 1920 is a strong Buy area with a likely target to hit 1950 next week or so.
Trade with care!

Gold Post FOMC Update Witness the astonishing power of Gold as it defies all odds! 🌟 After a jaw-dropping surge in the wake of the FOMC, hitting a resilient resistance zone at 1983, things took a wild turn. The FED's interest rate hike left many traders trapped in sell positions, leading to an insane and horrifying market situation. But guess what? We were ready! 💪 Armed with keen foresight, we stood tall in the sell zone, anticipating the inevitable drop.
Our signal proved to be spot-on as Gold gracefully tumbled from 1983, and we seized the moment, booking stellar profits near 1948! 📈🤑 Now, the price retraces to 1955, testing the waters around a crucial trendline support, which, alas, succumbed to the pressure and transformed into a formidable resistance overnight. The bearish bias on higher timeframes strengthens our resolve to make the most of this golden opportunity.
As we embark on this thrilling journey, our sights are set on the next targets: 1942 and 1925! 🎯🎯 The path ahead may be challenging, but we embrace it with unwavering confidence and a strategic approach. Join us as we navigate the twists and turns of the market and unlock the untold potential of Gold! 🌌💰"

XAUUSD: 21/9 Today’s Trading StrategyGold opened on Thursday and continued to fall lower, continuing yesterday's decline. The U.S. dollar index and U.S. bond yields also continued to strengthen at the opening due to the Federal Reserve's hawkish expectations, putting pressure on its gold price. Overall, the interest rate meeting was biased towards the hawkish side. This may limit gold price gains in the short term. However, gold in the Asian market fluctuated slightly and rose, and it is not expected to have a big trend. There will be data to pay attention to later.
Judging from the structure of yesterday's trend, gold fluctuated sideways at first, and was also the calm before the storm. The U.S. market once crashed and pushed the pressure up to the 1947 line. This was the market's early reaction to the Federal Reserve's expectation of suspending interest rate hikes. However, In the early morning, the Federal Reserve's interest rate meeting was biased towards the hawkish side, which caused gold to peak and fall, completely swallowing up all the gains during the day, and finally closed at the inverted hammer line near 1930.
At the daily level, gold was suppressed at the 1947 line and formed a double top suppression pattern. This may indicate that gold prices will be limited in their gains in the coming period. In the daily K structure, after the gold price breaks through, the lower support is still at the 1920 line. This also suggests that gold prices will find support near this area and may rebound or correct here. At the 4-hour level, the stochastic indicator crosses downwards and the MACD double-line top divergence indicates that gold prices may experience a short-term rebound adjustment. Therefore, during the day operation, Jiesse is still optimistic about the trend of falling from the high level. Then consider going long at a low position
Gold operating strategy:
SELL:1934-1937
SL:1941
TP1:1930
TP2:1925
BUY:1920-1923
SL:1916
TP1:1927
TP2:1931

Today's Gold Bearish Final Target: 1916 and 1903Yesterday, we saw that XAUUSD went up a lot until 1947. After that, the market has come down in FOMC News and is constantly coming down.
So far, the xauusd has broken much support. So far, if we see, the market can go up a little because, at present, the market has been running since 1924.
The rest of our goals have been completed; now our targets are 1916 and 1903.
As we mentioned in our last two or three analyses, the market target is 1903, so let's see that the final market is moving towards our target.
If you like our analysis, then you can boost our posts. You can leave a comment in the comment section.
Good luck and best wishes to everyone.

Gold trading strategy: daily profit of more than $20KYesterday and today I have made it very clear to everyone about gold trading ideas. We mainly focus on shorting gold at high levels. We shorted gold in batches above 1936 yesterday, and made very good profits this morning, with daily profits reaching more than $20K.
According to the current structural trend of gold, gold will maintain a downward trend in the short term. I predict that the vicinity of 1914 is not the lowest point of this round of gold decline, and gold will continue to fall.Therefore, my current trading rhythm will continue to maintain the view of shorting gold at high levels. Of course, in trading, we must grasp the appropriate trading position in order to maximize profits. At present, we still hold a short position in gold, and with part of the profit, we can continue to hold it to maximize profits.
In fact, as long as you grasp the rhythm, it is easy to profit from gold trading. If you don't know the accurate trading rhythm, you can follow my trading ideas. I post my trading ideas every day and I also post free trading signals on a regular basis. Many friends have given feedback that it is very helpful. If you want to learn market trading logic, or you want clear trading signals and get more profits, I can satisfy you. Be sure to follow the bottom of the article to view the details!

XAUUSD SHORTGOLD has reversed from its Supply Zone, you guys can go short. Use proper lot sizes and keep trailing your stop losses. First TP is the last Higher Low at TF-1H. Happy Trading.

XAUUSDthe possible path is drawn on the chart. i suspect the price to go a little down following last hours of Friday's around 1920 then more uptrend to 1930+ . after that a pullback onto 1915 area and again continuing to raise around and above 1930 resistance zone. (now the actual path is definitely more complicated than the depicted and each zone could have more reactions.)
keep it in mind that this is just a possible analysis and might go wrong so the invalidity level for me is 1909 and through a strong bearish candle the price can go lower around 1897

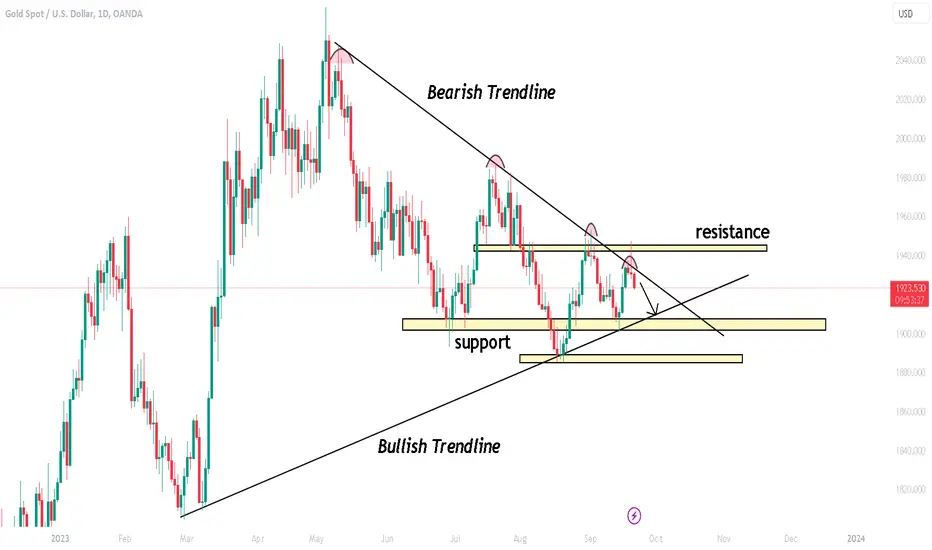
Gold Possible 200 pip MoveHello traders , After yesterday news :
gold once again Rejected the strong bearish trendline
formed an inversed hammer on the daily time frame.
We are on a bearish trend .
and the DXY dollar index is still strong.
these are our bearish clues.
i believe we are going to see gold back on the 1905-1908 level very soon.
XAUUSD: 20/9 Today’s Trading StrategyIn today's Asian trading on Wednesday, gold suddenly fell sharply in the short term, and the price of gold once fell below 1930. Yesterday, the U.S. dollar index showed a V-shaped trend. It fell to an intraday low of 104.81 before the U.S. market, and then strongly recovered all losses, finally closing up 0.06% at 105.13.
Gold prices retreated from fresh two-week highs ahead of the Federal Reserve's interest rate decision, with the outlook currently remaining neutral. The Federal Reserve will present new economic forecasts at the same time as it announces its monetary policy decision. Yesterday, spot gold fluctuated within a narrow range above the $1,930 mark. It once rose to an intraday high of 1,937.43, then gave up all gains and turned lower, finally closing down 0.13% at 1,931.31. Gold rose slightly after the opening yesterday, but its performance was weak during the European and American trading hours. The top-bottom transition we mentioned earlier was around 1930 and was temporarily broken through. However, the bulls did not forcefully continue before this action was completely completed. The rise began to show lack of momentum near 1935.
On the 4-hour trend, the continuous high fluctuations caused the short-term moving average to gradually diverge downwards. The K-line began to slowly come under pressure on the short-term moving average, and the short-term trend showed signs of weakening. Although the current price is still running near the previous support band around 1930, the rebound is not too strong and the short-term trend is weak.
So today’s gold operation idea, Jiesse recommends going short on the rebound and then consider going long on the low!
Gold operating strategy:
SELL:1935-1937
SL:1942
TP1:1930
TP2:1925

Major Ethereum Holder Shifts $20 Million to Binance Amidst SpikeA notable Ethereum whale address moved 8,000 ETH ($13.24 million) to Binance, following previous transfers of 4,000 ETH, totaling $20 million in 20 days. The address initially received 64,000 ETH worth $106 million, raising speculation about its connection to czsamsunsb.eth.
Additionally, a surge in Ethereum call options trading on Deribit was reported, with contracts valued at $150 million. This heightened activity suggests significant interest from large traders (whales) in Ethereum price movements.

GOLD Price Hovers Around $1,930 Amid Fed's Hawkish Stance and...Gold Price Hovers Around $1,930 Amid Fed's Hawkish Stance and Rising US Yields
Gold price remains steady around the $1,930 mark as investors shift their attention to upcoming US economic data following the Federal Reserve's recent policy decision. However, the Fed's hawkish stance on interest rates and rising US bond yields are putting pressure on the precious metal's prices.
Here's a breakdown of the key factors influencing the gold market:
1. Fed's Hawkish Stance: The Federal Reserve, as expected, decided to maintain the current benchmark policy rates at 5.5% during its recent meeting. This decision, combined with the Fed's projection of slightly higher inflation, has led to expectations of an additional rate hike in 2023. Notably, the Fed revised its projected interest rates for 2024 upward, from 4.6% to 5.1%. This stance has bolstered the US Dollar (USD).
2. USD Index at Six-Month High: The US Dollar Index (DXY), which measures the USD's performance against major currencies, has reached a six-month high around 105.50. The USD's strength is partly attributed to the Fed's hawkish stance.
3. Rising US Treasury Yields: Higher yields on US Treasury bonds are contributing to the USD's strength while simultaneously weakening the appeal of non-yield-bearing assets like gold. The yield on the 10-year US Treasury note has surged to 4.43%, reaching levels not seen since 2007.
4. Fed's Commitment to Inflation Target: In a post-rate decision press conference, Federal Reserve Chair Jerome Powell reiterated the Fed's commitment to achieving its long-term inflation target of 2%. Powell also suggested that the central bank may be nearing the peak of its interest rate hike cycle, but emphasized that future policy decisions would be data-driven.
Upcoming US Data Releases: Investors are closely monitoring forthcoming US data releases scheduled for Thursday. These include the weekly Initial Jobless Claims, the Philadelphia Fed Manufacturing Survey, and the change in Existing Home Sales. These reports will provide insights into the US labor market, manufacturing sector, and real estate market, all of which play significant roles in shaping economic sentiment.
In summary, gold's price stability around $1,930 is influenced by a combination of factors, including the Fed's hawkish stance on interest rates, the strength of the US Dollar, and rising Treasury yields. The outcome of the upcoming US data releases will be closely watched for further market direction as investors assess the health of key sectors within the US economy.
Our preference
Short positions below 1950.00 with targets at 1912.50 & 1905.00 in extension.

GOLD 4H OUTLOOK we have two scenario
if the direction stabilized under 1920 will touch 1910 then 1902 then 1896
but if the direction stabilized above 1928 will touch 1937 then 1945 then 1951
resistance line : 1937,1945,1951
support line :1910,1902,1896

Will Gold fall after the FOMC event?Hello traders, Gold is currently at a very interesting level.
Strong moves could happen after the FOMC event which is coming
up in a few hours.
📌You can notice a price channel in the daily chart and price
is currently at the top of the channel.
📌You can also see the formation of a bearish daily candle in the
100-day exponential moving average level, which is crucial.
📌If the FOMC statement is hawkish, it will lead to USD strength,
thereby a sharp decline in Gold price would take place.
My recommendation is not to rush with your trades. Instead, it would
be better to wait and observe.

Untested area of goldGold has an untested area in the time frame where the price tends to rise and collect liquidity in that area
Since the price formed a strong trend and broke its previous ceiling, I expect the price to continue its growth after a pullback.

Gold Prices Consolidate as Markets Await Fed Decision...Gold Prices Consolidate as Markets Await Fed Decision
Gold prices (XAU/USD) have entered a period of consolidation, trading around $1,930 during the Asian trading session on Wednesday. Market participants are adopting a cautious "wait-and-see" approach ahead of the Federal Reserve's (Fed) interest rate decision and FOMC press conference, events that could inject volatility into the market. In this article, we examine the factors influencing gold prices, including the Fed's anticipated interest rate decision and the performance of the US dollar.
US Dollar and Treasury Yields
The US dollar, as measured by a gauge against six major currencies, is holding steady near 105.10 after rebounding from a weekly low of 104.81. One significant factor contributing to the dollar's resilience is the US 10-year Treasury note yield, which has reached its highest level in 16 years, currently hovering around 4.365%. The elevated yields may limit the downside of the US dollar (USD) as it attracts investors seeking higher returns.
Fed's Monetary Policy Decision
The Federal Reserve is scheduled to announce the results of its two-day monetary policy meeting, with widespread expectations that interest rates will remain in the range of 5.25% to 5.50%. According to the CME Fedwatch Tool, the probability of the Fed keeping rates unchanged in September stands at 99%. However, the odds of another rate hike have diminished for the November and December meetings, according to the same tool.
Market participants will closely monitor the post-meeting press conference led by Fed Chairman Jerome Powell. During this conference, analysts and investors will seek hints about the "dot plot" (the Fed's projection of future rate hikes) and inflation expectations. Rising interest rates tend to increase the opportunity cost of holding non-yielding assets like gold, potentially casting a shadow on the precious metal's outlook.
Impact on Gold
The upcoming Fed interest rate decision, scheduled for Wednesday at 18:00 GMT, holds significant importance for gold traders. The outcome of this decision is likely to provide clear directionality to gold prices. Furthermore, later this week, the Bank of England (BoE) will announce its benchmark rates on Thursday, followed by the Bank of Japan's (BoJ) monetary policy meeting on Friday.
Conclusion
Gold prices are currently consolidating as market participants adopt a cautious stance in anticipation of the Fed's interest rate decision and the subsequent press conference led by Fed Chairman Jerome Powell. The performance of the US dollar, driven in part by rising Treasury yields, remains a critical factor to watch. The outcome of the Fed's decision and the associated commentary could set the tone for gold prices in the near term. While forecasts for gold remain bullish, the market's reaction to the Fed's actions and guidance will be pivotal in determining the precious metal's future trajectory.
Our preference
Long positions above 1924.00 with targets at 1940.00 & 1945.00 in extension.

GOLD Bearish Head And shoulder in formation hello traders , i am very very bearish on gold today i spotted a head and shoulder formed am waiting for a retest of the trendline for my entry before the news.
part of my plan if i am 30-40pips in profit i will secure and wait for news else i will close and wait for news .
todays news can change everything make sure you are well prepared , tight SLs and Secure secure secure dont risk and dont 50/50 with news anything can happen today

very well holding of 1929 now focused 1935#GOLD.. well guys market very well hold your downside area as we discussed in my last idea that 1929 is support line and now you can see how smoothly market hold it.
FOMC day
we have same area, now keep close 1935 to 37 area it can change the overall story ,
if market hold 1935 not again downside we have 1929 and after that 1922 as next support line,
trade wisely
good luck

GOLD 4H The FED decision will affect the marketGOLD
The FED decision will affect the market
reminding you that, consolidation under 1920 is important to achieve the suggested targets as breaching it will push the price to build a bearish wave to reach 1910 , 1902 , and 1896
As for renewing bullish attempts, consolidation above 1928 will support the price to rise up again and recover its positive momentum to retest again to 1937 , 1945 , and 1945
Support line: 1910, 1902 , 1896
Resistance line:1937 , 1945 , 1945

Gold little flutuated ahead of Fed and other rate decisionsThe gold market is currently in a holding pattern as investors await monetary policy updates from the Federal Reserve and other central banks this week. Gold prices are relatively stable, with the most active futures contract settling just slightly higher and spot gold showing a small decline.
Market analysts suggest that gold traders are cautious and waiting for these central bank decisions, including the Fed, Bank of England, Bank of Japan, and People's Bank of China. The focus is on the Fed's decision, and any signals regarding interest rate hikes could impact gold's direction. If there's optimism that central banks are done raising rates, it could be positive for gold, but uncertainties remain.
The European Central Bank recently raised rates to 4%, signaling it might be the last hike for a while. The Fed is not expected to raise rates during its upcoming meeting, but investors are eager to hear Chairman Jerome Powell's comments for clues about the rest of the year. The possibility of a hard economic landing could drive safe-haven flows into gold.
In summary, gold markets are on hold as traders await central bank decisions, with a focus on the Fed's announcement and Powell's remarks. The recent increase in U.S. consumer prices adds complexity to the inflation outlook.
