XAUUSD:5/9 Today Gold Trading StrategyDuring the Asian market on Tuesday, spot gold maintained a slight decline during the day, and then fluctuated within a narrow range, now around 1936. Yesterday, the price of gold continued to fall back under pressure after rising high. It rebounded slightly during the Asian and European trading periods, and then accelerated to rise but fell back due to the resistance of the 1946 line. The U.S. market experienced a continuous decline and continued to decline below the 1939 mark, the morning's rising point, and finally closed around 1936.
Gold's cross K-line was basically flat yesterday, and the second test of highs fell slightly. The overall space is not big. It is not so much a fall, but a horizontal correction. The daily chart has closed the cross K-line for three consecutive trading days, which is the end of the rebound. It remains to be seen whether it will turn back down or continue to rise after a partial correction. At present, the bullish trend remains unchanged and gold’s performance remains strong. Therefore, we cannot easily say that it is time to place short orders at high positions. Our resolutely bearish signal has yet to appear. Therefore, gold is likely to continue to fluctuate at high levels this week, either waiting for bulls to continue rising or waiting for bulls and bears to turn around and get out of a downward trend. This week's gold trend is not expected to be obvious until after Wednesday, so everyone needs to wait patiently. Regarding the shock at the beginning of the week, we need to pay close attention to the market changes on the day, so in terms of operation, we can just follow the trend and operate within the range.
Gold operating strategy:
SELL:1945-1947
SL:1952
TP1:1941
TP2:1938
Goldtrade

Gold- Potential higher lowAs you know, I was bullish Gold all week and also bought around 1930.
Unfortunately, my buy trade was closed with a low when XauUsd dropped under 1920 2 days ago.
At this moment, I'm out with no trade running, but my bullish bias remains.
However, for opening a long trade I need more confirmation and this comes with a break back above 1935, which at this moment is confluence resistance given by the falling trend line and the horizontal level.
In conclusion, at this moment there is a potential higher low in place, and confirmation for this comes with a break above 1935.
Also, a positive day close will give us a Morning Star candle formation on the daily chart and a week close above 1940 will give us a Pin Bar on the weekly chart.
So, for now, wait and see is my approach.

Gold 1919-1920 short, short-term followed
There are a thousand kinds of waiting in this world, but the best one is called the coming day, and I am willing to stand here and count down from this second, waiting for the encounter in many years. Life is just to come to the world to taste sweet and sour, bitter and spicy, and then leave with all the happiness and sadness! All we can do is not disappoint ourselves!
Gold, yesterday retraced again, and broke the 20 line, closed in the pattern pattern of the mid-black line, then this week even the negative retracement, the daily line has broken the support of the short-term moving average, but also broke the previous support point 20 line, this action is also likely to directly illustrate that the short-term bears still have a continuation, and the current gold continues to maintain below 20 finishing, then the European market before you can directly short wait, and the support below will continue to move down around 1900, at the same time, From the multi-hour line can be seen that the short-term downward trend is more obvious, are after a certain shock after the secondary downward momentum, and the current short-term support below the daily line will also pin on the support of the medium-term moving average, the weekly system suppression perfect, the short-term average has broken, the 10-day moving average will also do the final struggle, and in the continuous retracement of the market, the trend of the European market is more important, once the European market breaks, the US market can continue to short, on the contrary, the European market is relatively strong, The probability of the U.S. market continuing to fall is not large, then intraday gold we still follow the market for short order layout, then directly short around 19-20, the target is around 05-00, loss 26.5.
GOLD 4H (Pivot Price: 1922)GOLD
if it is below 1922 the direction downwards going until it reaches 1917 and 1912 then 1905
if it falls above 1922 the direction is going to touch 1926 again and 19232
Pivot Price: 1922
Resistance Price: 1926 & 1932 & 1938
Support price: 1917 & 1912 & 1902
timeframe: 4H
❤️Please, support my work with like, thank you!❤️

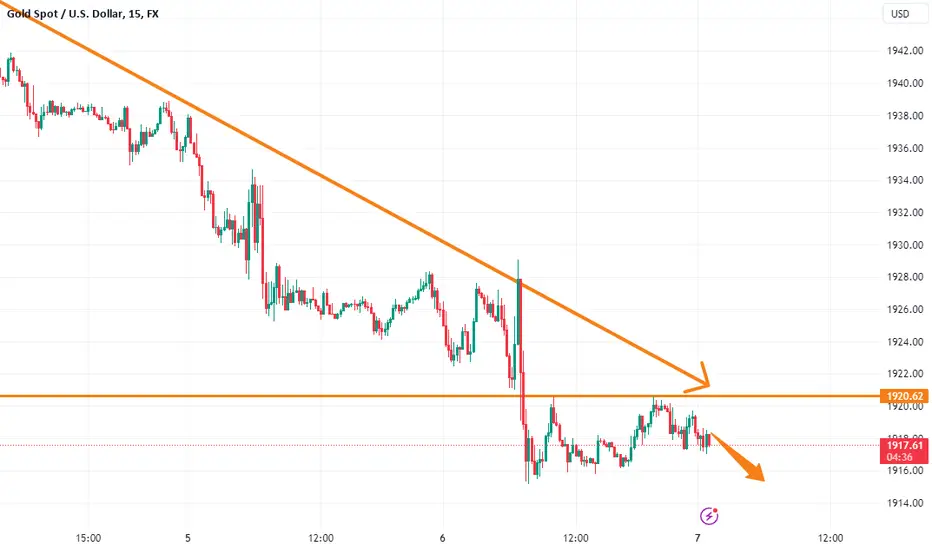
🥇Gold🥇 is Ready to ⚔️Attack⚔️ to Downtrend line⏰(15_Min)⏰🏃♂️Gold is moving near the 🟢 Support zone($1,914.520-$1,910.640) 🟢.
🌊Theoretically, Gold Elliott Waves can complete its 5 descending waves in the support zone. This is while wave 3 is Extended.
🔔I expect Gold to attack the Downtrend line from 🟢 Support zone($1,914.520-$1,910.640) 🟢.
Gold Analyze ( XAUUSD ), 15-minute time frame ⏰.
Do not forget to put Stop loss for your positions (For every position you want to open).
Please follow your strategy; this is just my idea, and I will gladly see your ideas in this post.
Please do not forget the ✅' like '✅ button 🙏😊 & Share it with your friends; thanks, and Trade safe.

Analysis of the latest gold trading signals
The probability of the Fed leaving interest rates unchanged at 5.25%-5.50% in September is 93.0%, while the probability of resuming rate hikes in November has decreased
The strong rise of the US dollar, suppressing gold prices to fall, short-term in the shock to choose the direction, gold prices have recently fallen to 1915, the market is gradually approaching the daily medium-term support line, but the decline is slowing down, the short-term focus on the 1928-1930 line of resistance, short-term may appear a certain degree of rebound demand
Gold Trading Strategies:
xauusd:@buy1909-1914 tp1923-1927
Join me for more free accurate trading signals

XAUUSD: 4/9 Today’s Trading StrategyIn the early trading of the Asian market on Monday, spot gold maintained a slight rebound trend. Gold opened at 1940. Last Friday, the U.S. non-farm payrolls report triggered violent fluctuations in the gold market. The spot gold price once exceeded 1950, and then fell sharply to around 1935. Then the gold price increased. Rebounding, gold prices closed at 1939.80 last Friday, almost unchanged during the day.
After the impact of Friday's non-agricultural data, the daily line closed the doji on Friday, and closed below the Bollinger Band. Obviously, temporarily suppressed by the technical side, gold may come out of the shock and decline space in the current form, and fall effectively. The strength can be seen below the daily Bollinger track of 1890. However, the current bull trend has not changed and the performance is still strong. The focus is on whether last week's high can be effectively broken. Therefore, there is a high probability that it will fluctuate at high levels this week, either waiting for the bulls to continue rising, or waiting for the bulls and shorts to turn around and exit the decline.
The 4-hour chart is still running above the upward trend line after testing high and falling back. It has not fallen below the trend line yet, and the short-term upward trend has not changed. Today, the short-term relies on 1936 as a reference for long-term defense. Hold this level to be bullish, and if it falls below, it is bearish. At present, the US dollar is going strong, and gold is still holding on to the bullish trend line for the time being, making the room for a fall uncertain, and the short-term may still fluctuate at this level. Although the non-farm payrolls broke through 1948 last Friday, it was only a virtual break. Now you can refer to this position to go short. The lower support will focus on 1936 for the time being. If the decline is not strong enough, you can backhand and go long.
Gold operation strategy:
BUY:1935-1938
SL:1930
TP1:1943
TP2:1948

XAUUSD Parallel Channel Breakout TradeNASDAQ wait for breakout and trade in the direction of breakout or place your but and sell stop.
Manage your risk according to account size!

XAUUSD Sell IdeaXAUUSD breaks its bullish trend. After the bullish trendline breaks and starts making LH and LL.
1926.10 was the support which now becomes resistance.
We will take our entries when the price reclaims this resistance area then it will continue a bearish structure toward our support which is at 1903.81

XAUUSDPrice is expected to be bullish in coming days due to economic side favoring majorly as investors are feared of USD.
What we are looking here is to wait for price to come to 1945-46 region and then take a sell entry with stop loss of 60-70 pips. Take profit should be somewhere 1930.00.

GOLD:Trading strategy
In the short period of gold, the RSI indicator on the 1-hour chart has entered the oversold zone, and the MACD entry is formed, and there is a possibility of rebound and repair during the day.
Short-term fast trading
Gold:buy1920-1923 TP:1929-1934 SL:1914
If you want to make money, join me, keep up with my strategies, and I will share my ideas every day.

Insist on long gold and win profitsGold fell to around 1915 today, and I have reminded senior members that around 1917-1915 will be a good time to do long gold again. When gold pulls back around that area, I'm definitely going long gold ahead.
From two aspects, the first gold is currently in a five-wave rising structure, and there is support at the 1910-1912 position below, so it is feasible to do long gold near the 1915 position;In addition, the rise of the US dollar hit the resistance at 105, and is in a staged top area. If it continues to rise, it will face strong resistance, so the pullback of the US dollar will support gold to a certain extent. So we do long gold in batches in the 1917-1915 area. At present, we still hold long gold positions in our hands. I believe that very good profits will be made soon, and time will verify everything!
I post my trading ideas on a daily basis and also post free trading signals on a regular basis. Many friends have given feedback that it is very helpful. If you want to learn the logic of market trading, or you want clear trading signals and get more profits, I can satisfy you. Be sure to follow the bottom of the article to view the details!

Expected range in tomorrow, breakout expensive#GOLD... market drop below 1924 and placed 1914 arround low..
And day closed arround 1916 17
Well closing on this level is shaky closing for sellers actually,
According to me I was not expecting day closing at this level,
Anyways it's market and it can change your mind anytime.
We have range in-between 1921 and 1916 for tomorrow
Cash the untill market trade in-between these areas.
Eitherside breakage will leads you towards 5 to 8 points.
Trade wisely
Good luck

Central Banks Gold Purchases in July: An Opportunity to ConsiderCentral banks worldwide have continued to increase their gold reserves during July, which could indicate their preparations for potential economic challenges ahead.
Over the past few years, central banks have been actively accumulating gold as a strategic move to diversify their reserves and safeguard against various risks. However, the notable surge in gold purchases during July raises questions about what these institutions may anticipate. While it's essential to approach this topic cautiously, it is worth considering the potential implications for individual investors.
Central banks, custodians of their respective countries' monetary policies, possess valuable insights into the global economic landscape. Their recent gold acquisitions could suggest that they are bracing themselves for a negative turn of events or seeking to protect their economies from potential shocks. As astute investors, we must consider such indicators and evaluate our investment strategies accordingly.
Considering the historical stability and store of value that gold has provided over time, it might be prudent to assess our portfolios and consider allocating a portion towards this precious metal. By doing so, we can hedge against the uncertainties ahead and protect our wealth from potential economic downturns. However, evaluating your financial situation and consulting with a trusted financial advisor before making any investment decisions is essential.
While we cannot predict the future with certainty, it is always wise to be prepared for various scenarios. Central banks' continued gold purchases could serve as a reminder to reassess our investment strategies and consider the role that gold can play in our portfolios.
If you are interested in exploring gold as a potential investment avenue, I recommend conducting thorough research, seeking advice from trusted financial professionals, and considering reputable investment options available in the market. Remember, knowledge and careful consideration are essential when making investment decisions.
I hope this information proves valuable as you navigate your investment choices. Please feel free to comment if you have any questions or want to discuss this topic further. Together, we can ensure our financial well-being in the face of potential challenges.

XAUUSD Top-down analysis Hello traders, this is a complete multiple timeframe analysis of this pair. We see could find significant trading opportunities as per analysis upon price action confirmation we may take this trade. Smash the like button if you find value in this analysis and drop a comment if you have any questions or let me know which pair to cover in my next analysis.

Expensive area 1924 , keep close #GOLD.... market still trade above our supporting area 1924.
It's market key as I told you in morning,
Weakness below that area will be very expensive guys.
Trade wisely
Good luck

Gold Shortestablishing the Short Position:
Given the stable gold prices during this period, it would have been a challenging environment for shorting gold. Traders would need to identify specific technical or fundamental indicators that signaled a potential price decline within this range.
3. Setting Stop Limits:
To manage risk in a short position, it's essential to establish stop limits that protect against potential losses. In this case, you've set the stop limit above 1957. This choice could be based on several factors:
a. Technical Resistance: 1957 might be a level at which gold previously faced resistance, and breaking above it could signal a potential bullish trend. Therefore, placing a stop just above this level makes sense to limit losses if the trend reverses.
b. Risk Tolerance: The specific stop level should align with the trader's risk tolerance and the amount of potential loss they are willing to accept. A stop above 1957 is a prudent choice if the trader wants to minimize losses in case of an unexpected bullish breakout.
Risk-Reward Assessment:
Before entering the short position, traders should calculate the potential risk-reward ratio. In this case, the risk is the distance between the entry point and the stop level above 1957, while the reward is the expected decline within the range from 1947 to 1950.
Continuous Monitoring:
Once the short position is initiated, it's crucial to continuously monitor market conditions and any developments that could impact gold prices. If the price approaches the stop level, traders should consider whether it's appropriate to exit the position to limit losses.
Flexibility:
In trading, flexibility is essential. If new information or unexpected events emerge that suggest a change in the market's direction, it may be necessary to adjust the stop levels or exit the position early to protect capital.

XAUUSD\GOLD - AnalysisXAUUSD\GOLD
W1 - is in the phase of a flat / sideways direction in the price section 2037 - 1678, as it is clear that the price twice after the implementation of two waves approached the price of 1814, and then after the correction - movement to the price of 1678
What can be expected now?
Presumably, the correction after the 3rd wave begins to end, which may lead to the implementation of the 5th wave and the price drop to 1814 and below.
Short
Long term - goals 1814–1678
Medium term - goals 1918-1899-1871

Gold ShortsGold is currently maintaining support 1923
After a daily retracement in 1936
We should be looking for bearish reversals

GOLD ( XAUUSD ) Long Term Trading IdeaHello Traders
In This Chart GOLD HOURLY Forex Forecast By FOREX PLANET
today Gold analysis 👆
🟢This Chart includes_ (GOLD market update)
🟢What is The Next Opportunity on GOLD Market
🟢how to Enter to the Valid Entry With Assurance Profit
This CHART is For Trader's that Want to Improve Their Technical Analysis Skills and Their Trading By Understanding How To Analyze The Market Using Multiple Timeframes and Understanding The Bigger Picture on the Charts

XAUUSD: Price down!Greetings, valued readers! At present, the value of gold is exhibiting a downward trajectory for the second consecutive day on Tuesday, despite not showing any significant follow-through and staying within the well-known range that has been maintained over the previous week. GOLD is currently situated slightly below $1,940, undergoing a decrease of less than 0.10% within a single day and facing pressure from various factors such as the US dollar.

1924 neeed your focus, stay sharp#GOLD... market at his today supporting area 1924
Guys it's your key level in today, any weakness below that area will leads you towards next supports n areas.
Don't be lazy here,
Don't hold your longs below that area.
Trade wisely
Good luck

Go short gold first, then long gold,and still keep making moneyToday we made a good profit on gold trading. Today I remind everyone to short gold above 1935. Obviously, we made another big profit. We left the market with a profit around 1928. Because I would like to remind everyone again that gold fell today, but from a technical point of view, it is difficult for gold to form a trend decline, and it is also difficult for gold to fall below 1925, so we are long gold in batches in the 1930-1925 area.We still have a long position in gold at the moment, and I believe that very good profits will be made soon.
I post my trading ideas on a daily basis and also post free trading signals on a regular basis. Many friends have given feedback that it is very helpful. If you want to learn the logic of market trading, or you want clear trading signals and get more profits, I can satisfy you. Be sure to follow the bottom of the article to view the details!
