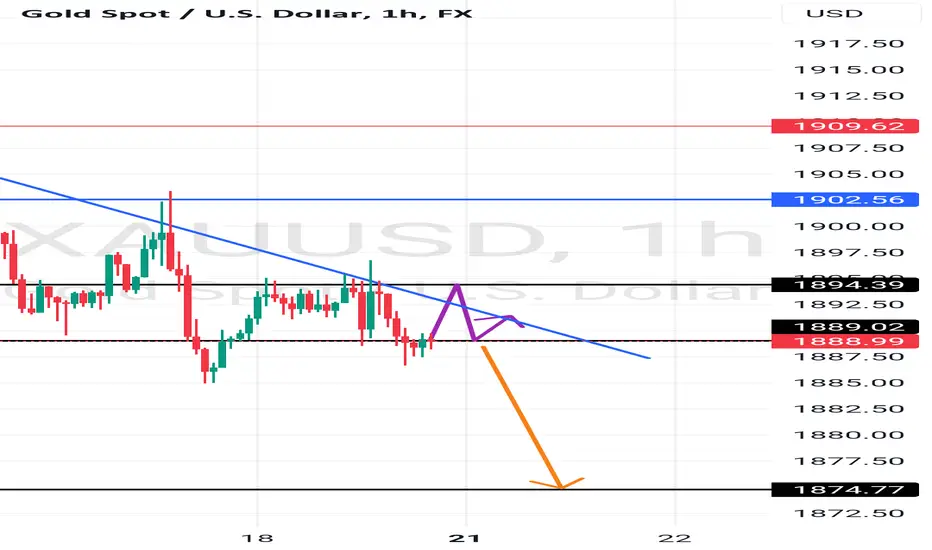
Gold Short IdeaPossible continuation of the short trend. Gold will see bear pressure soon. We take the risk. manage your risk.
Goldtrade

Trading strategy: Successfully profit by buying gold!Yesterday, I gave you the trading strategy of doing long gold, and it has successfully touched our profit target 1902 line. Congratulations here to friends who followed yesterday's trading strategy.
At present, the highest gold has rebounded above 1904, and the energy of bulls has begun to counterattack. As long as gold stabilizes above 1900 within a day, the gold rebound is not over yet. Judging from the current gold structure trend, gold should continue to rebound upwards, even it may take a rebound to the 1925-1930 area to have room to fall again. However, for the short-term within the day, the high point of the gold rebound may only appear in the 1905-1910 area. So for short-term traders, first focus on the resistance of 1908-1910 at the top, and the support of 1898-1896 at the bottom.
There is no fluke in the market, we need more time to look for opportunities and be good at seizing them. And I spend a lot of time every day researching the market and profiting from it. Similarly, I also make more detailed trading plans and trading signals based on the market every day. The article has a certain lag. In order to grasp the market dynamics and trading plan in time, you can follow the bottom of the article to master the wealth code and create your own wealth!

GOLD SHORT SIGNAL 30 MINDear traders,
Gold in the 30-minute time frame can experience a price correction.
Until it breaks above the level of 1912, we cannot say that the trend is definitively bullish, despite the price showing a tendency to rise.
You can enter buying positions at lower levels and also consider selling positions based on your trading style.
I would appreciate it if you could share your opinion with me.

Today's gold forecast is 1889~1903, sell high and buy lowAnalysis of the gold layout: won on Monday with a complete victory. The current trend of gold has rebounded strongly last night since it repeatedly attacked the bottom 1885-1884, but then began to fall back, and finally fell to the 1886 line to stabilize and fluctuate. From the perspective of the trend, it is a weak slow-rising pattern, and it has broken through to the vicinity of the 1901 line above. From here we can see that this is completely different from the previous trend. After breaking through the 1884 line yesterday, it started to rebound. Now that the bulls are about to move, our operating thinking must be changed immediately, and we cannot chase the short in the main. Instead, go back to our old thinking, just sell high and buy low. While stable, it can also avoid many risks. Today, focus on the breakthrough of 1905. As long as this position is not broken, it is still a short-term idea.
Back to the topic, since gold fell below the 1884 line yesterday, it has obviously stopped falling after rebounding. Today, let’s look at the 1901-1903 line above, and reach this range to find a high point to enter the market and open short
Near SELL1903, SL:1908, TP:1890
Europe and the United States fell below the 1892-1889 line to do more gold
BUY1889~1892, SL:1884, TP:1900

GOLD:Trading strategy
Today I judged in the channel that as long as gold does not fall below 1883, there will be a chance of a rebound.
Gold was suppressed by the daily line today, rising first and then falling, but it can be seen that gold has an upward demand at this point. As long as gold does not fall below 1883 tomorrow, it can be judged that gold has been supported in the short term. If it falls below 1880, then gold will continue to fall.
So I give the following trading strategy in the channel:
Gold:buy 1883-1885 TP1890-1898 sl:1878
If you want to make money, join me, keep up with my strategies, and I will share my ideas every day.

GOLD ( XAUUSD ) Long Term Selling Trading IdeaHello Traders
In This Chart GOLD HOURLY Forex Forecast By FOREX PLANET
today Gold analysis 👆
🟢This Chart includes_ (GOLD market update)
🟢What is The Next Opportunity on GOLD Market
🟢how to Enter to the Valid Entry With Assurance Profit
This CHART is For Trader's that Want to Improve Their Technical Analysis Skills and Their Trading By Understanding How To Analyze The Market Using Multiple Timeframes and Understanding The Bigger Picture on the Charts

XAUUSD Top-down analysis Hello traders, this is a complete multiple timeframe analysis of this pair. We see could find significant trading opportunities as per analysis upon price action confirmation we may take this trade. Smash the like button if you find value in this analysis and drop a comment if you have any questions or let me know which pair to cover in my next analysis.

1930 could be next for GoldAs I explained in my yesterday's post, although Gold is still contained in large a descending channel, the small descending channel started at the beginning of the month could represent a warning for bears.
Yesterday, XauUsd tried twice to make a new low and failed, another indication that an upside move could follow.
At the time of writing, Gold is trading at 1899, above the falling resistance of the narrow channel and above yesterday's high.
In conclusion, as long as 1883 is intact, I favor gains and the most obvious level for the target is 1930.

Gold next possible moveGold in 15 min chart, if it breaking 1897 and retesting from 1899 then go for long toward 1905 and if breaking 1893 and retesting from 1891then go for short toward 1875.

Long XAUUSD...Broken falling channel and triple bottom says that gold can goes up again.
Target is around 1920 and stop is under triple bottom zone. Nice R_R.
Trade safe.
Good luck.

Try to go long gold in batchesHello, my name is Antonio. I have been using TradingView, but today is the first time to officially share my understanding and views on the market on this platform. I am very happy to discuss and research the market with like-minded friends here.I also hope that my trading logic and thinking can help some friends know and understand this market to a certain extent.
In terms of trading, I will not write too complicated and too long text, I just want to explain my point of view in a simple and clear way, and formulate a corresponding trading plan. As far as trading is concerned, I can look at every transaction objectively and correctly. There must be profits and losses during the transaction process, which is the charm of trading. My goal is simple, to consistently achieve at least $20K in profit per week.
Closer to home, as far as the gold market is concerned, after the continuous decline of gold, the current downward momentum has slowed down, but overall, gold is still weak in the short term. According to the current trend structure of gold, there is no structural low point in gold, but gold is currently rectifying, which is conducive to the structural low point in gold. Then gold is likely to tentatively fall below the 1885 position next time, so at this time, you can try to do long gold in batches below 1885. The upper part first focuses on the resistance at 1896, and secondly the resistance at the upper 1902 position.
There is no fluke in the market, we need more time to look for opportunities and be good at seizing them. And I spend a lot of time every day researching the market and profiting from it. Similarly, I also make more detailed trading plans and trading signals based on the market every day. The article has a certain lag. In order to grasp the market dynamics and trading plan in time, you can follow the bottom of the article to master the wealth code and create your own wealth!

If it's fake breakout upside, then ?#GOLD... As I told you about range trade and you can check now in 4 hours chart market is still in range ..
A fake brewkout happen in morning,
Now if market hold you range top them again drop expected towards bottom of the range...
Upside and downsides areas are mentioned chart...
Trade wisely
Good luck

Gold 85-84 to do more; short-term try to do more
Gold, after the opening of the day, first retreated at the 84 line, and continued to compete around 90, but in the U.S. market, it unexpectedly rose above the 98 position and then began to retreat, and continued to touch around 85, forming a three-bottom pattern , and in terms of the weak form in the near future, this action does not perfectly explain the signs of the bulls' rebound, but when the market continues sideways and there is no sign of breaking the position, we can continue to consider whether the reversal of gold is coming, At present, the daily line continues to be under pressure on the negative line, and the short-term moving average has also achieved the effect of short resonance. The multi-hour line has a perfect downward channel. According to the simplest operation idea, just let nature take its course and follow the market, but the intraday surge , In terms of the support effect achieved below, we can still consider trying to release a certain amount of energy from the bulls, while the first target above is maintained at the 1900 integer level. Once this position is broken, there will be a continuation in the later period At present, we can go long on gold around 85-84, the target is around 95-00, and the stop loss is 79. If we break the 80 line as follows, we can consider shorting.

Today's gold forecast is 1882~1897, sell high and buy lowOn Monday, the Asian market fluctuated greatly. From the perspective of the gold trend structure, the intraday is weak and volatile. It basically runs above 1885. It broke through the 1885 line in the morning and quickly rebounded to the 1894 line to fall back and fluctuate. Judging from this trend, the upward momentum of bulls is still not good, and the overall trend is more biased towards bears. At present, there is still a large downside space below, and the 1870 gap has not been filled, so we still have to be biased in terms of operations. Long orders can only enter the market by grasping the rebound. Now that gold has been in a downward trend for two consecutive weeks, if you want to reverse the bulls, you need the help of the data. Otherwise, bears will continue to suppress bulls. It is very simple to say so much, whether you are long or short, you should change your thinking when it is time to change your thinking, and don't be confused by superficial phenomena, so that you can see clearly the changes in the overall situation.
Back to the topic, gold continues to operate weakly. Although the market has given the bulls a rebound in the morning, it is still difficult for the bulls to gain a firm foothold under the overall bearish trend. Therefore, the operation idea is still based on shorting.
Today, let's look at the top 1897-1900, and rise to this range to find a high point and enter the market to open short.
SELL1897~1900
SL1905
TP1885
European and American markets fell below 1882-1878, you can participate in long positions
BUY1882~1878
SL1875
TP1890

Possible CRAZY Gold DOWNTREND? (read FULL analysis)TVC:GOLD OANDA:XAUUSD PEPPERSTONE:XAUUSD EIGHTCAP:XAUUSD BLACKBULL:XAUUSD OANDA:XAUUSD FOREXCOM:XAUUSD VANTAGE:XAUUSD EASYMARKETS:XAUUSD TVC:DXY CAPITALCOM:DXY NASDAQ:DXYN
-
After breaking trough multiple resistances, and rejecting all of the key levels until the previous market close (last friday), GOLD seems to be going for a continuation of a strong bearish market.
According to my anaylsis, I protected my SL be placing it above the previous strongest Support Level, making it a safe but smaller risk trade.
Also, in accordance to my understanding of how the market moves, I targeted a almost 10 R.R.R (at 9.89 exactly), simply because, with all of the technical analysis I have made, I believe that the market already created it's Intention , then Pulled Back by rejecting key levels continuous times, and will now perform Continuation, which means reaching my Profit Target at the 1804.653 level.
As well, as the DXY is indeed moving upwards at it's own pace, making equal highs and aiming for higher highs.
-
With all of this information put together and analyzed, what do you think could be the possible scenario for GOLD?
Let me know your thoughts below, and I wish you all an amazing day!

Gold: Strategies are bullish today
Gold runs within a narrow range, the same rhythm as before, the Asian and European markets adjusted, and the US market fell to a new low! In the early trading, it has been suggested that the pressure of 1896 is empty, and those who have entered the market continue to hold the empty order. The current price of 1892 that has not entered the market continues to be empty, and 1887 continues to rise a few points
The trend is down, and the ladder is going down continuously, expanding the space below! After the shock, there will be another new low, and the gap below 1870 may be the position where the market stops falling! Before this position is touched or a strong rebound breaks through the current downtrend suppression line, continue to be bearish to the end!
1887 The current price continues to rise, enter when the bullish point is reached
1892 The current price continues to be empty, bearish! Continue to look at new lows!

XAUUSD SHORTXAUUSD The Big Short is on the way expecting more down trend on gold thıs comıng week after a pullpack

GOLD:summary
This week, gold is still the same as last week, continuing to fall along the five-day line, but this week is more deceptive, making many people think that this will be the bottom.
Therefore, let's not guess whether it will reach the bottom here. Only when gold rises above the five-day line and stands firm can we judge whether it will reach the bottom. If it wants to rise, it will not directly rise. We need more patience.
From now on, if you judge that it will rise, then you need to trade quickly and lock in profits to ensure that your account will not lose money. It is most important to follow the trend to make more money, but because it has fallen too much, gold will definitely have a rebound demand, so we must be more cautious and wait for the market to come out.
Don't be impatient, the market will always be there, and there will always be opportunities to make money.
If you want to make money, join me, keep up with my strategies, and I will share my ideas every day.

Again hold your range top, now?#GOLD... so market in first session of today again placed a high arround your range top and specially ignore the trend line but not the range..
We have still valid upside range top arround 1894 and downside range bottom still arround 1889 and still a valid areas for downside breakage..
Ingore the trend line and focused on your range top and bottom in 4 hours chart..
Am sharing hourly chart for batter understanding but you can check my first idea regarding current range was shared on 4 hours chart ..
Any weakness on 4 hours chart below 1889 will leads you towards 1875 n 70
Trade wisely
Good luck

The Unyielding Nature of Gold: A Call to Long Gold!Introduction:
Have you ever wondered why gold has stood the test of time as a reliable store of value? Gold's unique characteristics make it a steadfast investment choice, unlike any other asset. In this article, we will delve into the remarkable properties of gold, highlighting its inability to be downgraded or be anyone's liability. Join us on this exploration as we uncover why long-term traders should consider adding gold to their portfolios.
Gold: An Unassailable Asset:
Gold has long been regarded as a haven asset, offering stability and security during economic uncertainty. One of the key reasons behind its resilience is that gold cannot be downgraded. Unlike currencies or stocks, which can be devalued due to economic or political factors, gold maintains its intrinsic value regardless of external circumstances. This exceptional quality ensures that gold remains a reliable store of wealth, safeguarding against inflation and market volatility.
Furthermore, gold is not subject to the liabilities associated with other assets. When you invest in stocks or bonds, you are essentially trusting the stability and performance of the issuing entity. However, with gold, you eliminate the risk of dependent on another party's financial health. Gold is no one's liability, making it a truly independent and self-reliant investment.
The Timeless Appeal of Gold:
Gold has been revered for its beauty, rarity, and durability throughout history. Its allure spans cultures and civilizations, making it a recognized symbol of wealth and prosperity. This timeless appeal further strengthens gold's position as a valuable asset transcending borders and generations.
Call to Action: Long Gold!
Considering the unyielding nature of gold, it is prudent for traders to consider adding gold to their investment portfolios seriously. By doing so, you can benefit from its inherent stability and protection against economic uncertainties. Here's a call to action for all traders: embrace the potential of gold and make it a cornerstone of your long-term investment strategy.
1. Diversify Your Portfolio: Introduce gold as a diversification tool to balance the risk associated with other assets. Its low correlation with traditional investments can help shield your portfolio from market downturns.
2. Hedge Against Inflation: Inflation erodes the purchasing power of fiat currencies, but gold has historically proven to preserve value over time. Including gold in your portfolio can act as a hedge against inflationary pressures.
3. Long-Term Wealth Preservation: Gold's ability to retain value over extended periods positions it as a reliable wealth preservation asset. Holding gold can protect your purchasing power and secure your financial future.
Conclusion:
As traders, it is crucial to recognize the unparalleled qualities of gold. Its inability to be downgraded and its detachment from liabilities make it a resilient and independent investment choice. By embracing gold as part of your long-term strategy, you can fortify your portfolio against uncertainties and potentially unlock new avenues for wealth preservation.

Gold analysis next week
Gold's current trend seems to be, this round of decline is a continuous shock fall, the amplitude of the shock has contracted, in the upward adjustment, there is no breakthrough of the high, the upper resistance point gradually moved down, the trend is very simple, which brings certain convenience to our short-term operation layout, relying on the previous day's trading day above the resistance point trading. Friday's movement was the least volatile day, and without the participation of news and data, the market volatility became smaller. For next week's market trend, Friday's rebound high of 1897 is our reference trading position, and you can choose the resistance point for a new short-term layout. At the same time, in the big cycle, we follow the short rhythm, follow the overall trend of gold, and choose to go short
Join me for more free accurate trading signals

At your range bottom, what's next?#GOLD... As we discussed in Friday about market range and you can see hows market exect hold your range bottom and top as well.
And market closed at your range bottom.
A trend line is also placed..
If market break range then further dropexpect d otherwise not...
Trade wisely
Good luck
XAUUSD Top-down analysis Hello traders, this is a complete multiple timeframe analysis of this pair. We see could find significant trading opportunities as per analysis upon price action confirmation we may take this trade. Smash the like button if you find value in this analysis and drop a comment if you have any questions or let me know which pair to cover in my next analysis.
