Gold next weekIn the previous week, the price crossed our target of 1900, and fell to the important support of 1885. As long as the price is involved in the support zone (1902-1885), a definite decision regarding the future cannot be made.
The support of 1880 can be the appropriate point for the price to return. Although the price chart has lost important supports, but for the price of gold to rise, it must break the trend line A and B strongly, so in the coming week, traders should carefully consider the price movement. so that they are not harmed.
The long-term price target on the downside could be 1825, but a short-term correction is not out of the question.
Goldtrade

UPDATE of Previous GOLD Analyze look at the ingulf in the important FL, so it means we will have retrace here it may be large and take 1-2 weeks, so be careful to avoid stop hunting.
Do you like this tips?


GOLD:Trading strategy
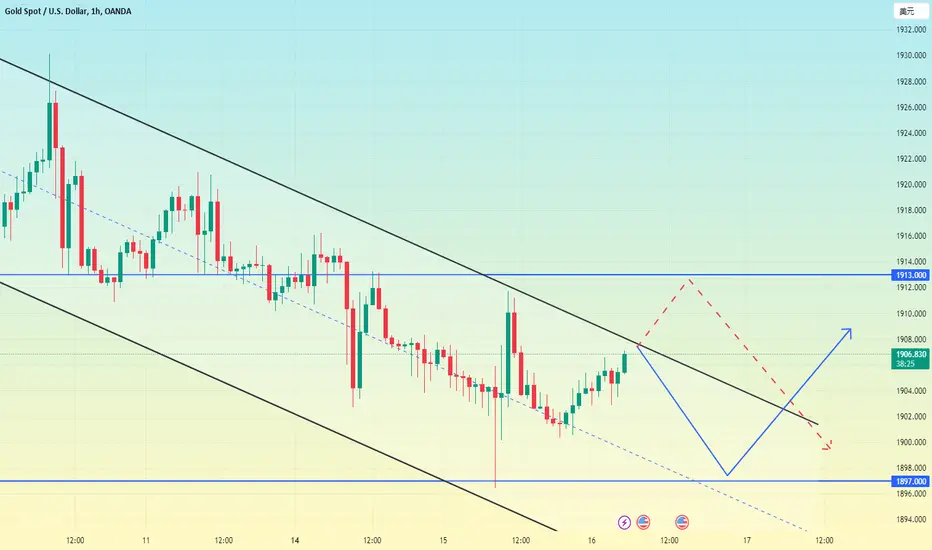
Gold fluctuates very little today, and it is still in a downward trend. Then the current rebound can be sold, but the stop loss must be strictly set, because each decline will not directly fall.
Only when gold can rise above 1900 and stand firm can it be judged that gold will not fall again, so that trading will be safer.
Gold trading advice today:
Gold:sell1897-1900 TP:1892-1887 sl:1903
Today is Friday, the last trading day of the week. Today's volatility is relatively small. If you can't find a more suitable opportunity, you can choose to wait. Sometimes it's better to wait than you are in a hurry.
If you want to make money, join me, keep up with my strategies, and I will share my ideas every day.

Gold continues the short trend, the key point today is 1890Gold continues to maintain a downward trend at present, and the white market has rebounded, but the position after the rebound also indicates that it is difficult for the bulls to gain an advantage in a short period of time. Therefore, in today's operation, first look at the position below 1890. If you hold the line of defense and do not break it, it will be near this position Go long, if you can’t hold it, gold will fall to the 1880 position in the next step
BUY:1890, SL1885, TP:1897
If the European and American market rises to 1898-1900, you can participate in short selling
SELL:1898-1900, SL:1905, TP:1890

How low will Gold go???Fibonacci extension tool is showing a 1.41 level inside of a 4 hr demand zone. We also have a measured move on the previous down leg. I suggest to watch this level and not just buy it at this level. Let's see if we get a reaction off the level that we can work with and THEN go through our process to take the trade long.

no data from US, range expected ..#GOLD... in today no data from US side, we expect a range trade now inbetween expected range,
upside we have 1894 arround and downside 1889
untill market trade in range you should cash the range..
if market trade in further range then range will be in these lines,
trade wisely
good luck..

XAUUSD: 16/8 Gold Trading StrategyDXY was flat on Wednesday (August 16) after data showed that U.S. retail sales rose more than expected in July; gold prices stabilized, boosted by a retreat in the U.S. dollar, although the Fed may remain on hold for longer after strong U.S. data was released. Expectations of higher interest rates kept gold prices near six-week lows. Gold reached a new low of 1896 yesterday. The oscillating movement of one step at a time seems to be weak, but it has not yet penetrated the low of 1893. A blunt shock fell, accompanied by a low rebound, and the daily line still harvested a small Yin K line. Since the daily chart was under pressure from the high point of 1987, there has been a wave of unilateral weak declines, directly giving up room for rebound. As it approaches the thousand-track mark and the low point of 1893, the short-term began to enter into repeated see-saw. It seems to be weak, but the strength of unilateral breakout is lacking, one low point and one reverse draw, whether it is brewing breakout or a steady recovery remains to be confirmed.
The 4-hour chart is weak and downcast with a rebound correction. The low level was still recovered in the late trading yesterday. The short-term quickly reversed the pressure on the middle rail 1911 line and then retreated to the 1900 mark. Repeatedly testing around the low point. It needs to be further confirmed in combination with the form whether it is poised to break down during the consolidation or to start a steady recovery. At present, it is repeatedly approaching the low point, but it lacks a certain strength to break the position. The short-term changes in the tug-of-war. From the perspective of the downward trend of the small-cycle step, as long as the short-term does not regain 1916, the short-term bearish thinking will be maintained for the time being.
Gold operation strategy:
SELL: 1912-1916
TP1:1908
TP2:1902
BUY:1898-1902
TP1:1906
TP2:1910

XAUUSD Sell setupSORRY guys I mistakenly marked wrong resistance in previous idea here is the new marked resistance

XAUUSD Sell setupXAU is respecting a parallel bearish channel and mostly rejecting from the point which is marked target is mentioned.

XAUUSD Top-down analysis Hello traders, this is a complete multiple timeframe analysis of this pair. We see could find significant trading opportunities as per analysis upon price action confirmation we may take this trade. Smash the like button if you find value in this analysis and drop a comment if you have any questions or let me know which pair to cover in my next analysis.

Will gold continue to fall? Today's Trading StrategyAt present, gold has been fluctuating and rising. After 1900 was broken yesterday, it only fell to the 1896 line. It did not continue the downward trend, but quickly rebounded and corrected, closing above 1900.
The current trend is basically similar to the previous trend, and a double bottom has been formed below. The counterattack trend of bulls is ready to enter the market at any time, and now we can be sure that the space for shorts to fall is limited, and we cannot blindly chase shorts. At present, we are waiting for the establishment of the bull signal, and the bears will not be able to continue the decline unless they continue to break low, otherwise all the declines are just a signal to establish the bulls' entry.
Back to the topic, the downtrend of gold is not over yet, the operation needs to be treated with caution, today we will first look at the 1900-1897 line below, reach this range to find the low point and enter the market to do long
BUY: 1900~1897,
SL:1894,
TP1:1905
TP2:1910
The European and American market rose to 1911-1913, which can be shorted
SELL:1911~1913
SL:1920
TP1:1908
TP2:1905
Gold continues to fall, can it bottom out tonight?Gold layout analysis: From the perspective of the gold trend, the overall situation is bearish. Recently, the highs have been moving down, and the lows have been broken. The lowest point fell to the 1902 line and then began to pull back. Strength is still good. The empty orders laid out yesterday did not give a chance to enter the market. I really did not expect the gold bulls to be so weak. Gold is still bearish on the main body today. However, when the monthly sales rate is announced in the evening, you can’t blindly chase short positions. You still have to make corresponding adjustments according to the specific trend of the European market in the afternoon. Judging from the current disk, the trend of short positions has not changed. What we have to worry about now is whether gold will bottom out at night and rebound. We followed the trend and waited for the rebound to reach a high point before going short.
Back to the topic, it is already a certainty to be short on gold. Under such a trend, it is the most stable to go short when gold rebounds, and the integer mark below 1900 is close at hand.
BUY1900-1903, SL1897, TP1910
SELL1911-1913, SL1918, TP1900

Gold bulls are weak, continue to be shortGold layout analysis: The highest rose to 1906 yesterday and began to short. After we made a profit, we rebounded to 1905.5 and shorted again to make a profit.
Looking at the daily line, gold has fallen below the 1890 line. According to the expected trend, it will definitely rebound and fall again to find the bottom support. But tonight there will be the release of initial data and the Fed meeting speech. The bulls may go the same way as before, directly rising without giving any room for reversal. In addition, there will be data released tonight, so the operation is still based on high altitudes, and more orders will be laid out for everyone based on the actual trend. However, according to yesterday's forecast, I believe that gold will continue to fall and continue to approach the 1870 gap below. We just need to control the entry position.
Back to the topic, the current gold bull trend has been in a very weak state. The rebound position is not strong enough, we can't give us a point to enter the market and open a short position, so we will continue to wait and see.
In today's operation, first look at the 1900-1903 line above, and reach this range to find a high point to enter the market and open short.
SELL:1900~1903,
SL:1908
TP:1890~1895
The long signal will be arranged and shared with you according to the actual trend.

XAUUSD: 15/8 Trading Strategy of the DayOn Tuesday (August 15th), the U.S. dollar index stood strongly above the 103 mark. Spot gold fell to a low of $1,902.46 overnight, dragged down by higher U.S. dollar and U.S. Treasury yields, its lowest level since July 7. The dollar climbed to its highest level in more than a month on worries about the Asian economy, making dollar-denominated gold more expensive for overseas buyers, while the benchmark 10-year U.S. Treasury yield held above 4%. This week, the Federal Reserve will release the minutes of its July meeting, which may reveal the willingness to raise interest rates. The Fed's decision in July was in line with expectations, raising interest rates by 25 basis points as scheduled. Federal Reserve Governor Bowman said that the Fed may need to raise interest rates further to suppress inflation and fully restore price stability. He supported the decision to raise interest rates at the Fed meeting last month and expressed a more hawkish view. The annual rate of U.S. CPI without seasonal adjustment in July recorded 3.2%, ending 12 consecutive months of decline, but lower than the expected 3.3%; the annual rate of core CPI without seasonal adjustment in July recorded 4.7%, the lowest since October 2021. Tonight, we will focus on the monthly retail sales rate in July in the United States, which is known as "horrible data", which is expected to have a big impact on the market.
Gold yesterday fluctuated and closed down on the small negative line, continuing its weak downward trend. The highest was 1916, and the lowest was close to the 1900 mark. Although it did not break below, it still closed at a low level after rebounding in late trading. It is expected to fall below the 1900 integer mark today, maintaining a small step weakness fall. The daily line follows the short-term moving average and goes down weakly. Below, pay attention to the conversion near the 1893 low. Whether it is a weak position directly breaking the position, or holding on to the circuitous shock at this position, there may be repetitions in the short term. The analysis given yesterday is to do more at 1903-06. Those who pay attention to me believe that they can also grasp the profit. The current trend is consistent with my analysis, so we can keep it down in operation. Today, we mainly focus on whether the 1900 mark below can be smooth broken position. Gold weakened at the opening today, unlike last week. Last week, it was a white market rebound, and the European and American markets fell. The rhythm has changed but the trend is the same, so there is no problem in staying bearish. Today's suppression level has moved down to around 1915. The lower support level depends on the strength of the decline. There is a high probability that 1900 will not be able to bear it. If it has not broken through 1900 many times, we can go long around 1902.
Gold operation strategy:
SELL:1910-1913
TP1:1907
TP2:1902
BUY:1900-1903
TP1:1907
TP2:1913

XauUsd could drop to confluence supportTwo days ago I said, that in the medium term (2-3 weeks) XauUsd could drop to very important 1820 support if 1900 zone support isn't holding.
In that days, Gold failed to stay above this important figure and made a new local low.
This new low confirms the 1880 high as a lower high and we can consider now trading in a channel.
The bottom of this channel is in fact confluent with the horizontal 1850 support and could represent the target in the shorter term (one week or so)
In conclusion, rallies above 1900 should be sold and, considering a negation level above the 1930 zone a 1:2 risk: reward could be achieved and a more than 500 pips gain for such a trade

GOLD next possible moveGold overall bias short. Yesterday we seen very good down retracement of gold from 1903 to 1886, 170 pips around. Today I'm expecting range market between 1890 to 1894, if it breaking 1894 and retesting then go for long and if it breaking 1890 and retesting the go for short.

Same yesterday area 1893, keep close #GOLD... In yesterday we find a level of 1893 and market hold it in hour chart but after that market break it and placed 1902 03 in day chart..
We have again same area 1893 as today resistance..
If market hold it then further drop expected otherwise not..
In case of breakgae upside areas are mentioned as well,
Trade wisely
Good luck

Gold trend analysis
The role of the Federal Reserve is to keep plundering global wealth, so the U.S. dollar must fluctuate at a high level, at least it cannot collapse and depreciate, so the interest rate hike is suspended, the balance sheet is still shrinking, and the high interest rate is still there. After yesterday’s decline in gold, the current pressure has moved down to the 1905 area. Basically, after breaking through 1940, the support in the densely traded area below is the 1865 position, of course there is a 1880 in the middle
trading signal:
sell 1898-1896 tp1888-1883
Share free trading signals every day, if you need, please join me

GOLD Going close to last LLMy analysis suggests that the price might approach the last Lower Low .
However, it's important to exercise caution around the 1903 level. There's a notable FVG that could impact price dynamics within the same supply zone, potentially you can take order sell here.
On the daily chart, the downward momentum for gold persists following its breach of the ascending support trendline originating in February. This breach has signified a significant departure from the prevailing uptrend that characterized the period from the latter part of the previous year until early April. Considering this, the technical outlook is becoming notably bearish.
The immediate support level resides at the 38.2% Fibonacci retracement level, positioned at 1903. Should there be a conclusive close below this juncture, it would bring into play the midpoint at 1848.
My goal for this idea is 1897.77

Gold -> Missing The All Time High ChanceHello Traders and Investors ,
my name is Philip and today I will provide a free and educational multi-timeframe technical analysis of Gold 💪
Looking at the overall picture you can see that Gold retested the previous all time high which was roughly at the $2060 level and from there just once again rejected towards the downside.
With this week's candle it also seems like Gold is breaking a major previous weekly structure level towards the downside so there I as higher chance that we will now see more bearish pressure on Gold.
And over the past couple of days there was a quite harsh sellof on Gold without any bullish rejection so there was no bullish setup as I was expecting - I didn't enter any long position and I am just waiting for new structure on Gold before I will look for new potential setups.
Keep in mind: Don't get caught up in short term moves and always look at the long term picture; building wealth is a marathon and not a quick sprint📈
Thank you for watching and I will see you tomorrow!
My previous analysis of this asset:

Divergence in 4H and 1H = entry for a big TPafter price ingulfed FL, and performed divergence in RSI, so we can expect here can be a major pivot to change the sentiment of the market, in other hand tomorrow is last day of the market and there is not any important news for GOLD and USD, with your money management you can be in long position of RR: 1/6.

XAUUSD(GOLD): Short opportunity!
Based on our daily TA:
We expect more fall.
You can see all the details on the Gold chart.
Please pay attention to the details!
Feel free to ask questions.
💡Wait for the update!
🗓️17/08/2023
🔎 DYOR
