GOLD ROUTE MAP UPDATEHey Everyone,
This is a follow-up update on our 1H chart and what can I say, another amazing result!
After hitting our bullish target at 3370 earlier this week, we confirmed the EMA5 cross and lock above 3370 confirming 3392, which I continued to highlight and remind as we bought the dips throughout the week. And today, we finally completed 3392 to perfection.
Next, we’ll be watching for an EMA5 lock above 3392 for a potential continuation. If that fails to lock, we may see some range play between 3392 and 3370.
We will keep the above in mind when taking buys from dips. Our updated levels and weighted levels will allow us to track the movement down and then catch bounces up.
We will continue to buy dips using our support levels taking 20 to 40 pips. As stated before each of our level structures give 20 to 40 pip bounces, which is enough for a nice entry and exit. If you back test the levels we shared every week for the past 24 months, you can see how effectively they were used to trade with or against short/mid term swings and trends.
The swing range give bigger bounces then our weighted levels that's the difference between weighted levels and swing ranges.
BULLISH TARGET
3370 - DONE
EMA5 CROSS AND LOCK ABOVE 3370 WILL OPEN THE FOLLOWING BULLISH TARGETS
3392 - DONE
EMA5 CROSS AND LOCK ABOVE 3392 WILL OPEN THE FOLLOWING BULLISH TARGET
3416
EMA5 CROSS AND LOCK ABOVE 3416 WILL OPEN THE FOLLOWING BULLISH TARGET
3429
EMA5 CROSS AND LOCK ABOVE 3429 WILL OPEN THE FOLLOWING BULLISH TARGET
3439
BEARISH TARGETS
3348
EMA5 CROSS AND LOCK BELOW 3348 WILL OPEN THE FOLLOWING BEARISH TARGET
3328
EMA5 CROSS AND LOCK BELOW 3328 WILL OPEN THE FOLLOWING BEARISH TARGET
3313
EMA5 CROSS AND LOCK BELOW 3313 WILL OPEN THE SWING RANGE
3296
3281
As always, we will keep you all updated with regular updates throughout the week and how we manage the active ideas and setups. Thank you all for your likes, comments and follows, we really appreciate it!
Mr Gold
GoldViewFX
Goldtrading

GOLD (XAUUSD): Technical Analysis Ahead of Trump
One of the important news for today is Trump speech during
the late New York session.
Here is my brief technical outlook for Gold ahead of that.
As we discussed on the yesterday's live stream, the price
is now coiling on a recently broken rising trend line that serves
as a vertical resistance now.
A bullish breakout of that and a daily candle close above
will provide a strong bullish confirmation and push the prices to 3430.
Alternatively, very bearish news today may trigger a retracement
to an underlined horizontal support.
Let's see how the market is going to react tonight.
❤️Please, support my work with like, thank you!❤️
I am part of Trade Nation's Influencer program and receive a monthly fee for using their TradingView charts in my analysis.

GOLD (XAUUSD): Road to 3430
Quick update for my yesterday's analysis for Gold.
The price broke through the trend line with a local Break of Structre BoS,
updating an intraday-high.
The road to 3430 is now empty, and the market will most likely
continue rising steadily to that.
❤️Please, support my work with like, thank you!❤️
I am part of Trade Nation's Influencer program and receive a monthly fee for using their TradingView charts in my analysis.

Grasp the trend accurately and have a crazy weekend!After testing the 3380 support level several times in a row today, gold maintained an oscillating upward trend. Today's layout of 3380 repeatedly went long, and 3400 shorts were all successfully closed with profits, with a total profit of 580pips. Currently, gold is oscillating at a high level in the 3404-3380 range. The possibility of a direction choice cannot be ruled out in the evening. If the market continues to be bullish in the evening, it is necessary to pay attention to whether the price will fall below 3380 when it tests the support level for the third time. If the support level is effectively broken, it is expected to fall to the key support level of 3370. If the price firmly stands above the 3400 mark, it may continue to test 3410. If there is no breakthrough either above or below, it will still maintain a range of oscillations, and the idea of selling high and buying low will be the main focus.

Opportunities only come to those who are preparedThe market expects the probability of the Federal Reserve cutting interest rates in September to be over 70%, with some institutions even predicting as high as 93.6%. Fed officials have recently released dovish remarks. If the rate cut is implemented, it will reduce the opportunity cost of holding gold, which is good for gold prices. The US has imposed tariffs on India and Switzerland, exacerbating global trade tensions and boosting demand for gold as a safe haven. The deadlock in the Iran nuclear talks and the shipping risks in the Red Sea have increased market risk aversion. Focus is on US initial jobless claims data and speeches by Fed officials. If the data is stronger than expected, it may suppress expectations of a rate cut and be bearish for gold. If the US dollar strengthens or geopolitical risks ease, gold prices may come under pressure and fall. Today, gold mainly showed a high-level fluctuation trend, hitting a high of $3397.25/oz in European trading before falling sharply. It is currently trading around $3382. Although gold prices are still in an upward channel, they have recently shown a high sideways trend. The market lacks unilateral driving factors. Gold can be shorted at high levels. It is recommended to short gold in batches around the highs of 3390-3405.

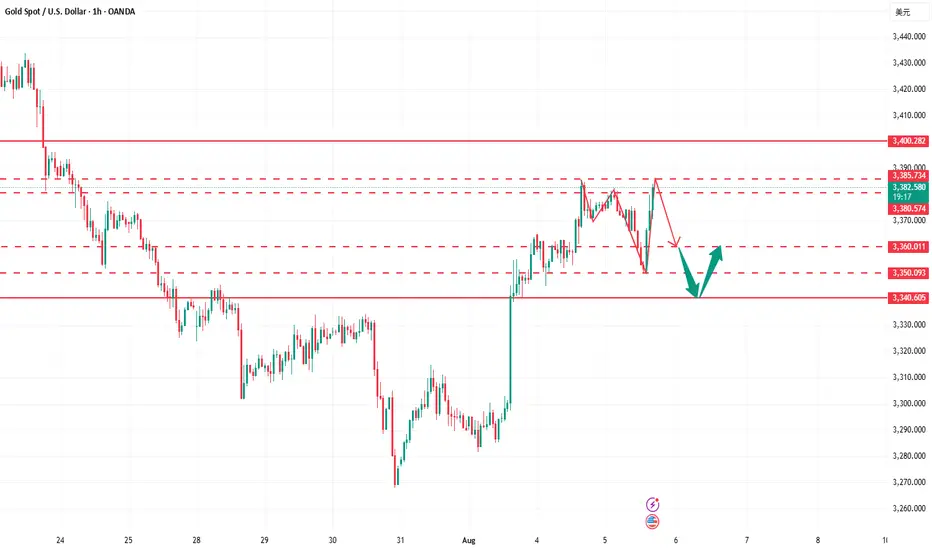
Gold fluctuates repeatedly. How can we avoid detours?Gold currently lacks sustained bullish momentum. The monthly chart has formed four consecutive upper shadows, indicating significant market pressure at high levels. Bulls are hesitant to take risks and lack the appetite for aggressive action, leading to a typical volatile pattern of rapid rises and equally rapid declines in gold prices. Yesterday's price action further confirmed this pattern. Although gold prices briefly reached a new high after bottoming out and rebounding, they were unable to consolidate above that level and subsequently retreated rapidly. Currently, the 3380-3390 area has become a key short-term resistance level, but repeated attempts to retest it have led to heavy selling pressure. Meanwhile, the 3370 area, a trading-intensive zone, poses significant downside risks for gold if it breaks below it, potentially extending the range to 3355-3340. Technically, resistance is concentrated in the 3380-3390 area, while support lies at 3355-3340. Short-term volatility is largely locked within this range. We recommend maintaining a volatile strategy of buying high and selling low.
Regarding trading strategies, we recommend placing short positions in batches within the 3375-3390 area, targeting 3360-3345. Pay attention to position control and stop-loss settings during this process. If the price rebounds to the support area and stabilizes, consider short-term long positions to flexibly respond to the intraday rhythm.
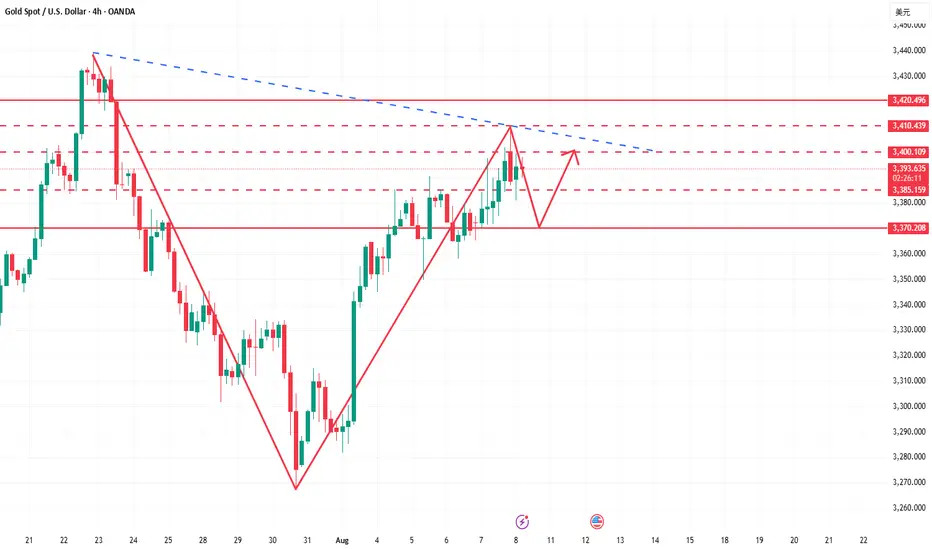
Bullish momentum weakens, and bearish opportunities emergeThe 4-hour gold chart shows a slow, volatile upward trend. While gradually climbing higher, it has failed to effectively break through key resistance areas. This suggests the market is not in a one-sided bullish trend, but rather in a state of sustained oscillation. Current price momentum is weakening, so it's not advisable to continue chasing higher prices. Today's strategy is to short on rallies, focusing on the key resistance area around 3410-3420. Opportunities are open for short positions. If prices trade within the 3400 range, this would be an ideal entry point for a short position. The main trend is to short on rebounds from higher levels, with strict risk management.
Gold Recommendation: Short in batches between 3400-3415, with a target of 3385-3370.
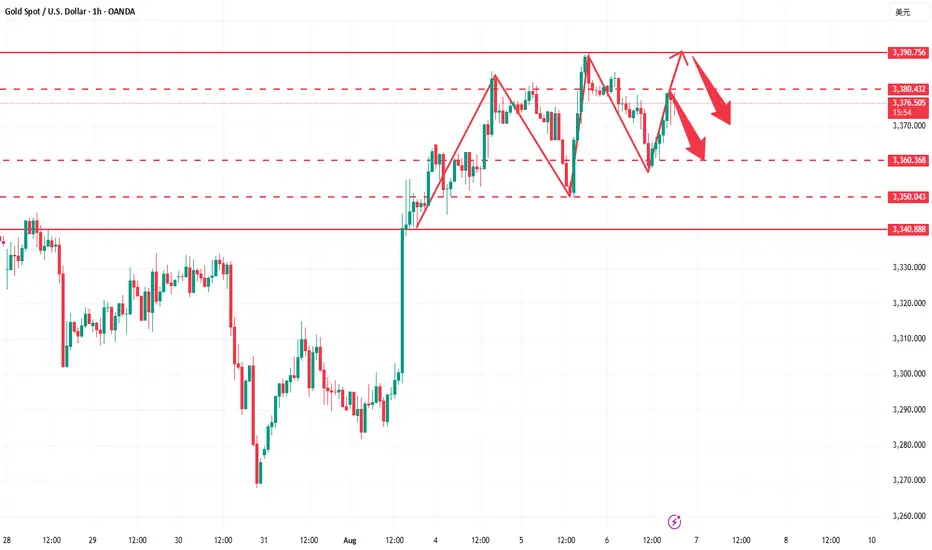
GOLD ROUTE MAP UPDATEHey Everyone,
Another great day in the markets with our chart idea playing out exactly as planned, allowing us to buy the dips.
We’re seeing a repeat of yesterday's setup, the 3392 gap remains open after the EMA5 lock above 3370. We're getting drops into the lower Goldturn zones, giving us great opportunities to buy back in.
As long as we don’t get a confirmed lock below 3348, we continue to chase the open gap above at 3392.
We will keep the above in mind when taking buys from dips. Our updated levels and weighted levels will allow us to track the movement down and then catch bounces up.
We will continue to buy dips using our support levels taking 20 to 40 pips. As stated before each of our level structures give 20 to 40 pip bounces, which is enough for a nice entry and exit. If you back test the levels we shared every week for the past 24 months, you can see how effectively they were used to trade with or against short/mid term swings and trends.
The swing range give bigger bounces then our weighted levels that's the difference between weighted levels and swing ranges.
BULLISH TARGET
3370 - DONE
EMA5 CROSS AND LOCK ABOVE 3370 WILL OPEN THE FOLLOWING BULLISH TARGETS
3392
EMA5 CROSS AND LOCK ABOVE 3392 WILL OPEN THE FOLLOWING BULLISH TARGET
3416
EMA5 CROSS AND LOCK ABOVE 3416 WILL OPEN THE FOLLOWING BULLISH TARGET
3429
EMA5 CROSS AND LOCK ABOVE 3429 WILL OPEN THE FOLLOWING BULLISH TARGET
3439
BEARISH TARGETS
3348
EMA5 CROSS AND LOCK BELOW 3348 WILL OPEN THE FOLLOWING BEARISH TARGET
3328
EMA5 CROSS AND LOCK BELOW 3328 WILL OPEN THE FOLLOWING BEARISH TARGET
3313
EMA5 CROSS AND LOCK BELOW 3313 WILL OPEN THE SWING RANGE
3296
3281
As always, we will keep you all updated with regular updates throughout the week and how we manage the active ideas and setups. Thank you all for your likes, comments and follows, we really appreciate it!
Mr Gold
GoldViewFX

The shot at the critical moment is the real trading opportunityGold bottomed out and rebounded yesterday, breaking the high slightly to touch 3390 before falling back. The daily line closed with a small bullish cross overnight, and the upward momentum has slowed down. Today it tends to fluctuate at a high level. In the 4H cycle, the Bollinger band is closing, and the overall bulls continue to run upward. The big positive line directly pulls up, which is relatively strong. The overall market is resistant to declines. Therefore, the big cycle does not expect a big drop for the time being, but the short-term trend fails to continue further. It is safe to maintain a pullback and go long. Pay attention to the support below 3365-3350. Go long after it stabilizes. First look at yesterday's high of 3390. If it breaks, there is a probability of going to 3400 or even around 3415, but be careful of a high rush and fall.

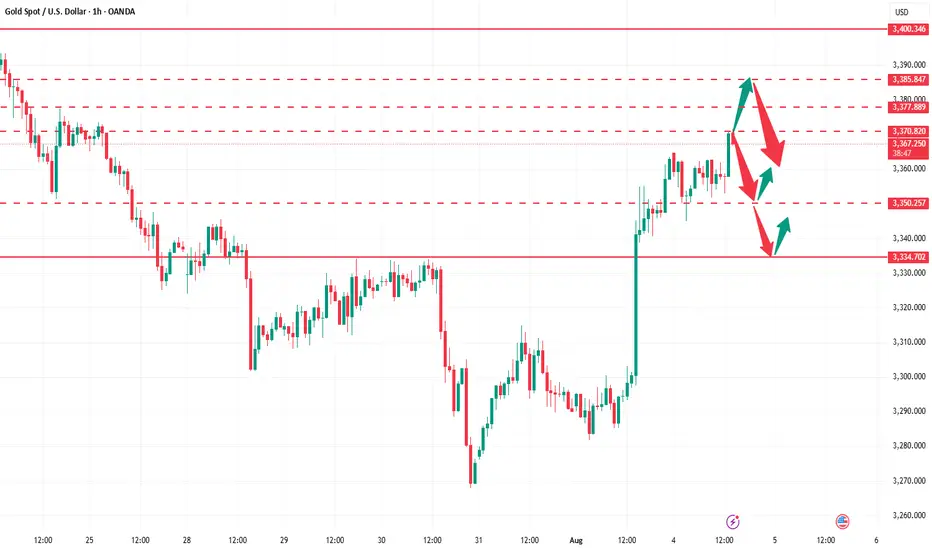
What you see are fluctuations, what I see are opportunities!Gold prices are rising as expected, with long positions perfectly fulfilled and periodic profits successfully secured. Currently, prices are once again encountering resistance at 3390. A clear bearish engulfing pattern has formed on the short-term hourly chart, suggesting weakening short-term momentum and increasing risk of a pullback. From a cyclical perspective, today marks the fifth trading day of gold's rebound, and technically, a periodic adjustment is necessary. A break below 3370 today will essentially confirm the establishment of a short-term top, and the market structure may shift into a phase of decline. Regarding trading recommendations, we recommend continuing to short on rallies around 3390 as a key resistance level, with short-term targets focused on 3370-3360. A subsequent break below this level with significant volume could open up further downside potential. Market sentiment is shifting rapidly at this time, so it is crucial to strictly enforce risk management discipline, avoid blindly chasing orders, and maintain a flexible and forward-looking strategy.

Citi’s bold gold forecast for next 3 months Citi has raised its 3-month gold price target to $3,500-$3,600/oz, up from it previous guidance of $3,300.
The upgrade follows a deteriorating US economic outlook, weakening labor market trends, and growing concerns over Fed and data independence.
Gold is currently testing a critical resistance zone near $3,380, a level that has previously shown signs of price rejection. Although $3,365 arguably might have been the tougher resistance... which is now broken.
The presence of higher lows from previous months could suggest continued strength, potentially supporting the expectation of Citi for gold to trade in the $3,500–$3,600 range.

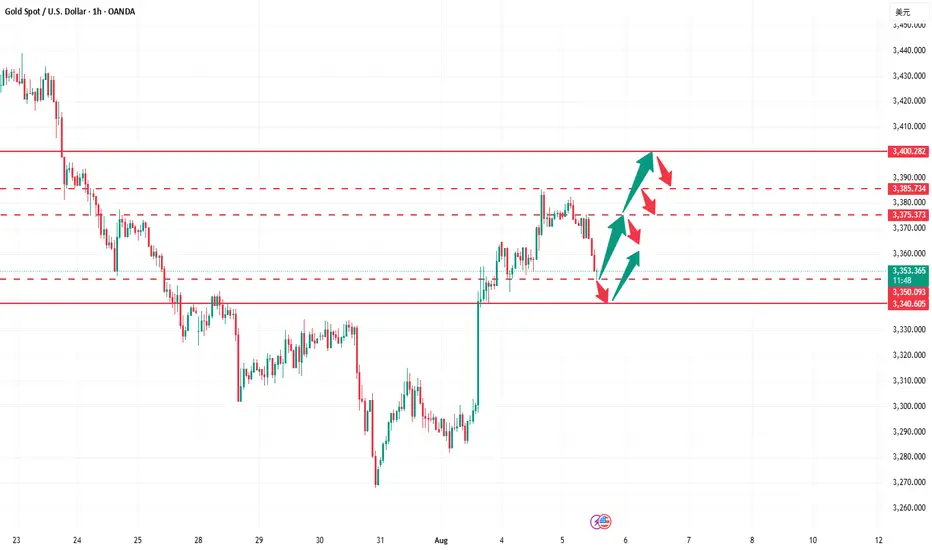
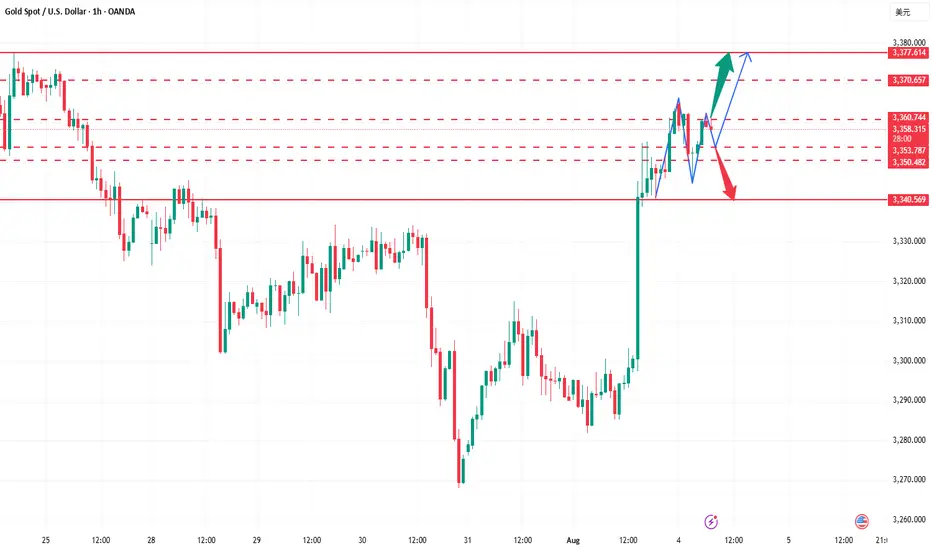
What does it matter if every step is just right?Today's gold fluctuation rhythm is basically consistent with our prediction. The rhythm from entry to profit-taking is clear, and the strategy is executed decisively. First, we decisively arranged long orders at the 3365-3370 line, and successfully took profit at the target line 3375, earning 150pips of profit. Then we decisively reversed and arranged short orders at 3375. The market fell back to around 3360 as expected, and realized 150pips of profit again. In the third round of operations, long orders were entered again near 3352, and the price rose smoothly to 3370 to take profit again. The overall rhythm was tight and profits were steadily pocketed. At present, gold has rebounded to around 3380-3385. We have deployed a new round of short orders in advance and will wait for the price to drop before arranging long orders. Overall, gold is in a volatile rhythm. Even if there is still room for upward movement in the future, it is likely to undergo a round of technical retracement adjustments first.
GOLD ROUTE MAP UPDATEHey Everyone,
Another PIPTASTIC day on the charts!!!
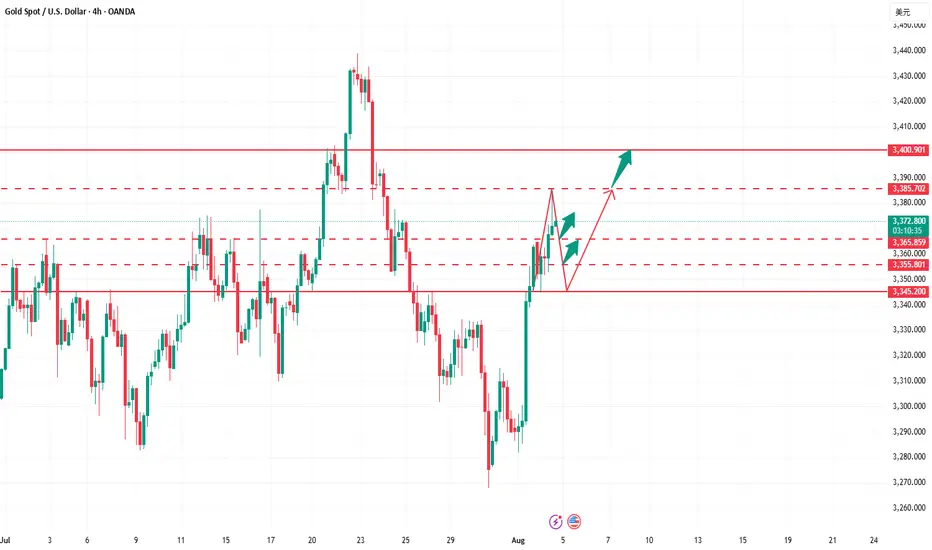
After completing our Bullish target 3370 yesterday, we stated that we are now waiting for ema5 lock to confirm gap to 3392.
We got the ema5 lock above 3370 opening 3392. A nice drop into the lower zone just above our bearish gap allowed us to buy dips inline with our plans. We got the push up all the way into 3390 just short of 3392 gap, so this remains open.
We will keep the above in mind when taking buys from dips. Our updated levels and weighted levels will allow us to track the movement down and then catch bounces up.
We will continue to buy dips using our support levels taking 20 to 40 pips. As stated before each of our level structures give 20 to 40 pip bounces, which is enough for a nice entry and exit. If you back test the levels we shared every week for the past 24 months, you can see how effectively they were used to trade with or against short/mid term swings and trends.
The swing range give bigger bounces then our weighted levels that's the difference between weighted levels and swing ranges.
BULLISH TARGET
3370 - DONE
EMA5 CROSS AND LOCK ABOVE 3370 WILL OPEN THE FOLLOWING BULLISH TARGETS
3392
EMA5 CROSS AND LOCK ABOVE 3392 WILL OPEN THE FOLLOWING BULLISH TARGET
3416
EMA5 CROSS AND LOCK ABOVE 3416 WILL OPEN THE FOLLOWING BULLISH TARGET
3429
EMA5 CROSS AND LOCK ABOVE 3429 WILL OPEN THE FOLLOWING BULLISH TARGET
3439
BEARISH TARGETS
3348
EMA5 CROSS AND LOCK BELOW 3348 WILL OPEN THE FOLLOWING BEARISH TARGET
3328
EMA5 CROSS AND LOCK BELOW 3328 WILL OPEN THE FOLLOWING BEARISH TARGET
3313
EMA5 CROSS AND LOCK BELOW 3313 WILL OPEN THE SWING RANGE
3296
3281
As always, we will keep you all updated with regular updates throughout the week and how we manage the active ideas and setups. Thank you all for your likes, comments and follows, we really appreciate it!
Mr Gold
GoldViewFX

In gold trading, timing is key!Gold has currently reached a high of around 3385. The technical retracement and correction is also an affirmation of the bulls, and the current support below will continue to move up. From the perspective of the large range of the daily line, there is no large unilateral trend, and the overall box consolidation pattern has been formed. It once rose to 3385 yesterday, but failed to stand firm, indicating that the pressure from above is still quite large. If it can break through 3400, the next target may be 3430; otherwise, it may start a round of deep adjustment. There is a need for technical adjustment, so it is not advisable to chase the rise too much. If your current operation is not ideal, I hope I can help you avoid detours in your investment. Welcome to communicate with us!
Judging from the structure of the 4-hour gold chart, the key support area below is around 3350-3340. If it falls back to this area and stabilizes during the day, you can continue to rely on this area to arrange long orders. The overall bullish thinking remains unchanged. The short-term resistance above is around 3375-3385. If it breaks through, it will further test the key suppression zone of 3390-3400. I will prompt the specific operation strategy at the bottom. I suggest you keep paying attention and follow up in time.
Gold operation strategy: Go long when gold falls back to around 3350-3340, with the target at 3370-3380.
How to seize the best entry point for gold?Gold continued its bullish trend from last Friday, rising to a high of 3385 yesterday. However, the upward momentum failed to sustain, and new highs were not reached during today's Asian and European trading sessions. The short-term bullish trend has ended, and the market is showing signs of correction. Currently, gold is facing downward pressure in the short term, and the short-term trend is volatile. Strategically, we can watch for a rebound to the 3375-3385 area during the European trading session and try to participate in short-term short selling. The target is below 3365-3355. The long-term structure remains bullish. Therefore, if the price falls back to the 3355-3340 area and stabilizes, we can still consider entering long positions to continue the medium-term uptrend. In terms of trading, we should pay attention to the rhythm of the market, betting on rebound resistance with short-term short positions and then going long on dips, maintaining flexibility.

Go long on the pullback and head straight to new highs!Gold fell back and stabilized at 3345 yesterday, and continued to rise during the US trading session, reaching a high of 3385. The overnight daily line closed positive again, which is in line with our expectations, so there is still room for growth. We will continue to take a bullish approach today. In the 4H cycle, the Bollinger opening is in the stage of large volume, and the consecutive positive lines are rising steadily based on the moving average. The support below is 3370-3360, and the intraday watershed is at 3360. The operation is mainly to go long on pullbacks. First look at the pressure of the 3385 high point. If it breaks, continue to look at 3395 and 3410.
Gold operation suggestion: go long on gold around 3370-3360, and look at 3385 and 3400.

How to accurately capture golden trading opportunities?Bullish trend is still the main trend of gold at present. After rising to 3368 at the opening today, it fell under pressure and fluctuated. Technically, it has tested the pressure level and needs to be adjusted. The overall high-level carrying capacity has also declined, so it is not advisable to chase the rise too much. In terms of operation, it is recommended to wait for the price to stabilize before buying more. Judging from the current gold trend, the upper short-term resistance is in the 3380-3385 area, and the key pressure is at the 3395-3400 line; the lower short-term support is in the 3365-3355 area, and the key support is in the 3350-3345 range. The overall suggestion is to arrange long orders on dips around the support area, and try to maintain a stable wait-and-see attitude in the middle position. I will prompt the specific operation strategy at the bottom, please pay attention in time.
Gold Trading Strategy: Buy in batches as gold retreats to the 3365-3350 area, targeting the 3380-3385 area. If this resistance zone is broken, hold and look for upward movement.
180 Pips Secured on GOLD! | Sniper Strategy in Action📈 Tired of Gold Trades Going Against You? This Sniper Strategy Just Bagged +180 Pips!
Hello Traders,
Struggling with XAUUSD’s volatility?
Taking small wins but suffering big losses?
You’re not alone — and we’ve built something just for you.
🔥 Introducing GOLD SNIPER — a high-probability strategy engineered for serious Gold traders.
With a consistent 1:2 risk-reward and precision entry logic, it’s designed to help you ride big moves and avoid common traps in XAUUSD.
🚀 Today’s Live Trade Recap:
Signal 1
🟢 Buy @ 3355.91
🔴 SL @ 3349.91
🟢 TP @ 3367.91
✅ Result: +120 Pips
Signal 2
🟢 Buy @ 3368.32
🔴 SL @ 3362.32
🟢 TP @ 3380.32
❌ Result: -60 Pips
Signal 3
🟢 Buy @ 3373.29
🔴 SL @ 3367.29
🟢 TP @ 3385.29
✅ Result: +120 Pips
📊 Total Profit Today: +180 Pips
✅ What Makes Gold Sniper So Effective?
✔️ Catches real momentum, not noise
✔️ Keeps entries & exits disciplined and mechanical
✔️ Aims for high-reward trades, not scalp scraps
🎯 Want better entries and more consistent wins on XAUUSD?
📩 DM us now to get instant access and start using Gold Sniper on your TradingView chart.
If this helped you, like the idea and drop a comment — let’s grow together!
Happy Trading,
InvestPro India

Why do you always miss the real opportunities?Judging from the current gold trend, gold rose to a high of around 3368 and then entered a narrow range of fluctuations. Our previous long plan failed to continue to hold at the high level. Although some brothers may feel regretful, the market is always full of variables. We must flexibly adjust our thinking according to market changes. At present, there is a need for a retracement on the technical side. This retracement is not a trend reversal, but provides space for subsequent bullish momentum. Overall, the bullish trend is still dominant, but the current price is approaching the important pressure area of 3370-3385. The short-term carrying capacity has weakened, and it is not advisable to chase highs blindly. It is recommended to be cautious at high levels in operations. In the short term, it can be given priority to try to intervene with short positions in batches in the 3370-3385 area, waiting for a technical correction. If it subsequently retraces to the key support area of 3350-3335 and stabilizes, you can consider the long position layout again and continue to participate in the main bull trend.
Gold operation suggestion: short in batches in the 3370-3385 area, with the target at 3355-3350. If it falls back to the 3350-3335 area and stabilizes, consider entering a long position at the right time.
GOLD ROUTE MAP UPDATEHey Everyone,
Great start to the week with our chart idea playing out, as analysed.
We got our Bullish target 3370 hit and now waiting for ema5 lock to confirm gap to 3392. Failure to lock will see lower Goldturns tested for suport and bounce, inline with our plans to buy dips.
We will keep the above in mind when taking buys from dips. Our updated levels and weighted levels will allow us to track the movement down and then catch bounces up.
We will continue to buy dips using our support levels taking 20 to 40 pips. As stated before each of our level structures give 20 to 40 pip bounces, which is enough for a nice entry and exit. If you back test the levels we shared every week for the past 24 months, you can see how effectively they were used to trade with or against short/mid term swings and trends.
The swing range give bigger bounces then our weighted levels that's the difference between weighted levels and swing ranges.
BULLISH TARGET
3370 - DONE
EMA5 CROSS AND LOCK ABOVE 3370 WILL OPEN THE FOLLOWING BULLISH TARGETS
3392
EMA5 CROSS AND LOCK ABOVE 3392 WILL OPEN THE FOLLOWING BULLISH TARGET
3416
EMA5 CROSS AND LOCK ABOVE 3416 WILL OPEN THE FOLLOWING BULLISH TARGET
3429
EMA5 CROSS AND LOCK ABOVE 3429 WILL OPEN THE FOLLOWING BULLISH TARGET
3439
BEARISH TARGETS
3348
EMA5 CROSS AND LOCK BELOW 3348 WILL OPEN THE FOLLOWING BEARISH TARGET
3328
EMA5 CROSS AND LOCK BELOW 3328 WILL OPEN THE FOLLOWING BEARISH TARGET
3313
EMA5 CROSS AND LOCK BELOW 3313 WILL OPEN THE SWING RANGE
3296
3281
As always, we will keep you all updated with regular updates throughout the week and how we manage the active ideas and setups. Thank you all for your likes, comments and follows, we really appreciate it!
Mr Gold
GoldViewFX

GOLD (XAUUSD): Detailed Support & Resistance Analysis
Here is my fresh support & resistance analysis for Gold.
Vertical Structures
Vertical Resistance 1: Rising trend line
Horizontal Structures
Support 1: 3327 - 3344 area
Support 2: 3246 - 3275 area
Resistance 1: 3431 - 3451 area
The price is currently coiling on a trend line.
Your next bullish confirmation will be its breakout.
❤️Please, support my work with like, thank you!❤️
I am part of Trade Nation's Influencer program and receive a monthly fee for using their TradingView charts in my analysis.

As the bull market continues, is gold poised to hit new highs?Judging from the current gold trend, the technical side opened high and closed low, releasing the demand for short-term adjustments. The intraday low hit 3344 and then rebounded, which is enough to reflect the resilience of the bulls. The hourly doji continued to rise, and the 3353 line was pulled up again. It is expected that it will be difficult to give an entry opportunity near 3340-3345 again. Since the new high has been refreshed again, the technical short-term adjustment may have ended. With the current strong bull structure, further testing the 3370-3380 area is a high probability event. If it unexpectedly falls below 3340 in the future, the bulls will no longer defend strongly, and the market may turn to volatility. Breaking below 3340 is also expected to open up short-term short space, but this is a later story. The current market structure is clear, and we continue to see a strong upward trend for the bulls. At least at the beginning of the week, I do not think the bull market is nearing its end.
Gold operation suggestion: go long around 3360-3355, target 3370-3380.Strictly set stop loss and control your position.
Only by understanding the trend can you be firmly bullish.The market is changing rapidly, and going with the flow is the best way to go. When the trend comes, just go for it. Don't buy at the bottom against the trend, so as not to suffer. Remember not to act on impulse when trading. The market is good at dealing with all kinds of dissatisfaction, so you must not hold on to orders. I believe many people have experienced this. The more you resist, the more panic you will feel, and the floating losses will continue to magnify. You will not be able to eat or sleep well, and you will miss many opportunities in vain. If you also have these troubles, then you might as well follow Tian Haoyang's rhythm and try to see if it can make you suddenly enlightened. If you need help, I will always be here, but if you don't even extend your hand, how can I help you?
Gold rose unilaterally after the positive non-farm payrolls on Friday, hitting a new high this week. This week's K-line closed in a hammer shape, and the gold hourly line has a double bottom structure. However, gold should not have such a big retracement for the time being. The 3335-3330 line below is also an important support. So gold will mainly be bought on dips above 3335-3330 next week. Technically, there is still room for growth next week. The bulls continued to attack at the end of Friday and closed at 3363. Next week, we will continue to pay attention to the short-term suppression at the 3370-3375 line above. In terms of operations, we will continue to maintain retracement and buy. If your current operation is not ideal, I hope I can help you avoid detours in your investment. Welcome to communicate and exchange. Judging from the current gold trend, the short-term resistance above next week will be around 3370-3375, with a focus on the important pressure line of 3395-3400. Keep buying on pullbacks, and try to maintain a stable wait-and-see position in the middle. I will prompt the specific operation strategy at the bottom, so please pay attention in time.
Gold operation strategy: Go long on gold when it retraces to around 3340-3330, target 3370-3375, and continue to hold if it breaks through.
