XAU/USD Chart Analysis: Bulls Break Important ResistanceXAU/USD Chart Analysis: Bulls Break Important Resistance
When analysing the XAU/USD chart last week, we:
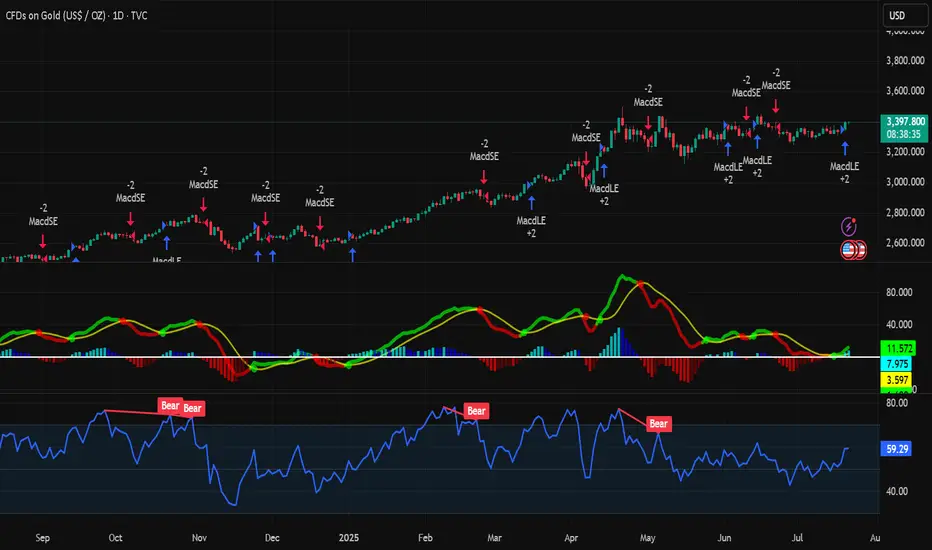
→ noted that the ADX indicator had reached its lowest level since the beginning of 2025 – a clear sign of declining gold price volatility;
→ highlighted the formation of a large-scale triangle with its axis around the $3,333 level, bounded by a resistance line (marked in red) and the lower boundary of the ascending channel.
Since then, the price has climbed above $3,400 – reaching its highest level since mid-June. According to media reports, the uptick in demand may be driven by escalating geopolitical risks, renewed optimism regarding potential monetary policy easing in the US, and consistent gold buying from central banks.
This suggests that the balance has shifted in favour of the bulls, who have made an attempt to break through the resistance line – an attempt that, so far, appears promising and points towards a potential resumption of the upward trend.
However, today's XAU/USD chart shows that the bulls are now facing a key resistance level at $3,440 – a level that has reversed gold prices downward both in May and June. What will happen in July?
It is possible that, following a prolonged consolidation near the lower boundary of the channel, the bulls have built up sufficient momentum to finally break through this critical level and push gold prices towards line Q, which divides the lower half of the long-term channel into two quarters.
This article represents the opinion of the Companies operating under the FXOpen brand only. It is not to be construed as an offer, solicitation, or recommendation with respect to products and services provided by the Companies operating under the FXOpen brand, nor is it to be considered financial advice.
Goldtrading

Gold CFD Trading: Practical Steps and Influencing Factors Gold CFD Trading: Practical Steps and Influencing Factors
Gold trading in forex offers a dynamic and potentially rewarding opportunity for traders. This article delves into the essentials of trading gold, from understanding its unique position as both a commodity and a financial asset to its price determinants and how to trade it.
Understanding Gold as a Trading Asset
In international gold trading, gold's role extends beyond being just a precious metal; it is a unique asset class. Its intrinsic value and universal appeal have made gold a cornerstone in financial markets for centuries. Unlike many other commodities, gold maintains its value not just in times of economic stability but also during volatility. This dual nature arises from its status as both a tangible commodity and a symbol of wealth, leading to its classification as a so-called safe-haven asset.
Investors often turn to gold when currencies and other markets face instability. Additionally, gold's relatively limited supply, juxtaposed with its consistent demand across industries and jewellery markets, ensures its lasting relevance in the trading world. Understanding these characteristics of gold is crucial for forex traders, as they form the foundation of its behaviour and pricing in the financial markets.
Fundamentals of Gold Trading
For those looking to learn to trade gold, it's essential to grasp the basics of how gold is traded. Primarily, gold trading is conducted through Contracts for Difference (CFDs), a popular derivative that allows traders to speculate on its price movements without owning the physical metal.
CFDs offer a flexible way to engage in gold trading, providing the ability to trade both rising and falling markets. This versatility is often cited as the best way to trade gold, especially for those who prefer short-term positions. Unlike gold stock trading, where investors buy shares in gold-related companies, gold CFD trading focuses directly on the price movements of the metal itself.
Via CFDs, gold is typically traded against the US dollar, denoted as XAU/USD. Here, XAU represents one troy ounce of gold, a standard unit of measurement in the precious metals market. Traders analyse market trends and use leverage to potentially enhance their opportunities. However, leverage is a double-edged sword, potentially magnifying losses.
Factors Influencing Gold Prices
Understanding the factors that influence gold prices is critical for anyone engaged in trading this precious metal. Here are key elements that traders usually monitor:
1. Economic Indicators: Key economic data such as GDP growth rates, employment figures, and inflation reports can significantly impact prices. Typically, weak economic performance or high inflation rates increase gold's appeal as a hedge against currency devaluation.
2. Monetary Policy: Central banks' decisions on interest rates and quantitative easing play a major role. Lower interest rates can decrease the opportunity cost of holding non-yielding assets like gold, thus boosting its demand.
3. Currency Strength: The strength of the US dollar is inversely related to gold prices. As gold is paired with the US dollar, rising USD will make gold cheaper.
4. Geopolitical Events: Political uncertainties and global crises often drive investors towards gold as a so-called safe-haven asset. Events causing economic instability can lead to a surge in prices.
5. Market Demand: Demand from industries like technology and jewellery and investment demand significantly influence prices.
6. Gold Trading News: News and reports related to mining, supply constraints, or large market transactions can immediately affect prices.
How to Trade Gold
Trading gold effectively requires a combination of well-chosen strategies, relevant indicators, and insights from trading signals. A comprehensive gold trading tutorial is a great starting point for understanding the mechanics of the market.
One of the best strategies to trade gold is following the trend. This involves identifying the direction of the market trend and making trades in alignment with this trend. For instance, if gold is on an upward trend, a trader might take a long position, and vice versa for a downward trend.
Regarding the best indicators for gold trading, traders often rely on tools like Moving Averages to identify trends, the Relative Strength Index (RSI) for overbought or oversold conditions, and MACD for momentum and trend changes.
Additionally, utilising gold trading signals can be effective. These signals, provided by market analysts or automated systems, offer assumptions on when to enter or exit trades based on market analysis. However, traders usually use these signals as a guide rather than a definitive command, combining them with their own research and risk management strategies.
Practical Steps for Gold Trading
Starting your journey in gold trading can be both exciting and challenging. Here are some practical steps to help you navigate this market:
- Educate Yourself: Before diving in, invest time in understanding the gold market. You can read books, watch webinars, and follow gold trading tutorials.
- Start Small: Begin with smaller investments to limit risk as you learn the ropes.
- Use Demo Accounts: Practice with demo accounts to gain experience without financial risk.
- Keep Up with News: Stay updated with global economic news, as they can significantly impact prices.
- Risk Management: Always use stop-loss orders to minimise potential losses.
- Review and Learn: Regularly review your trades to learn from successes and mistakes.
The Bottom Line
Embarking on your gold trading journey can be a transformative experience. With the knowledge and strategies outlined in this article, you can be well-equipped to navigate the market. Happy trading!
This article represents the opinion of the Companies operating under the FXOpen brand only. It is not to be construed as an offer, solicitation, or recommendation with respect to products and services provided by the Companies operating under the FXOpen brand, nor is it to be considered financial advice.
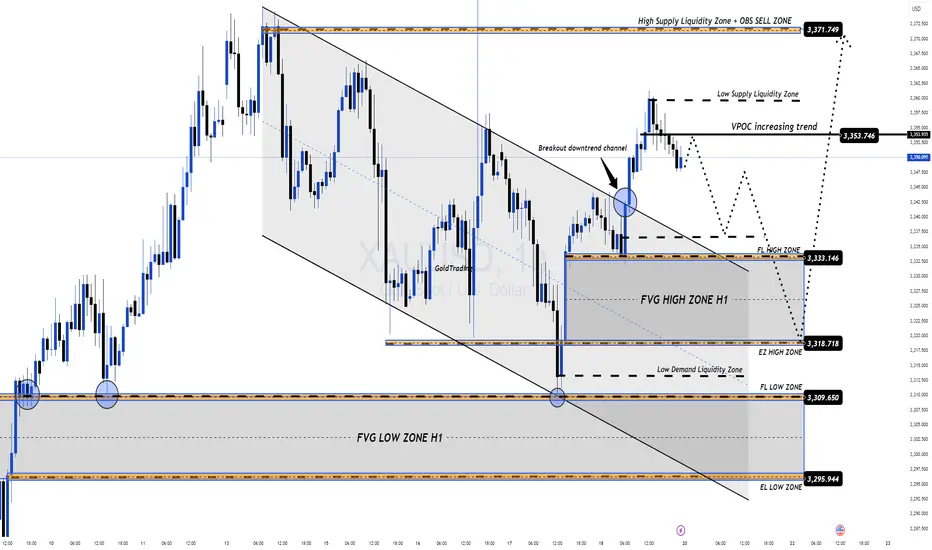
GOLD Rejected from Reversal Zone – Retest + Bounced & Major High📌 1. Major High & Liquidity Grab
The chart starts by showing a strong impulsive move toward the upside that taps into a Major High zone (highlighted at the top). This is a classic MMC "liquidity grab" where price sweeps the previous high to trigger stop losses and collect orders before reversing. This is a common trap zone where retail traders get caught in FOMO buys.
📌 2. Reversal Area Identified
The price entered a clearly marked Reversal Area between $3,430 – $3,445. This zone acted as:
Historical supply area
Psychological resistance
Liquidity hunt zone
Upon entry, strong rejection candles formed, signaling institutional sell pressure. This reaction aligns with MMC principles where reversal is expected post-liquidity collection from major highs.
📌 3. Parabolic Curve Formation – Bullish Impulse
A beautifully formed parabolic curve (Black Mind Curve) supported the bullish rally from around $3,310 up toward the high. This shows accumulation → breakout → expansion. However, the curve has now been broken, suggesting that bullish momentum is weakening.
⚠️ This break of curve support is critical — it often leads to a corrective phase or a deeper retracement.
📌 4. Mini Reversal Zone + SR Interchange Zone
Price has now pulled back to a very important area: the Mini Reversal Zone + SR Flip Zone around $3,400. This zone previously acted as resistance and now has the potential to act as support (classic SR interchange).
According to MMC concepts:
If this zone holds → we may see a bullish bounce and potential re-test of the upper reversal area.
If this zone breaks → bears will likely push price toward the next demand level around $3,350 – $3,340.
This is the decision point — a “battlefield” zone where market direction can be decided.
📌 5. Potential Scenarios Ahead:
✅ Bullish Scenario:
Price respects the SR zone ($3,400)
Forms bullish engulfing / continuation pattern
Likely target: re-test of reversal zone ($3,430–$3,445)
Beyond that: breakout possible if volume supports it
❌ Bearish Scenario:
Price breaks below $3,395 with strong bearish candles
Could confirm the rejection from the major high and trigger a full retracement
Downside targets: $3,360 → $3,340 range
🔑 Final Thoughts:
This GOLD setup is a perfect case of MMC theory in action — liquidity grab at the top, rejection at reversal zone, curve break, and now testing critical SR flip area.
Keep an eye on:
Candlestick behavior at the SR zone
Volume confirmation
Momentum indicators (if using)
Wait for confirmation before jumping in — let the market reveal its hand at the decision zone.

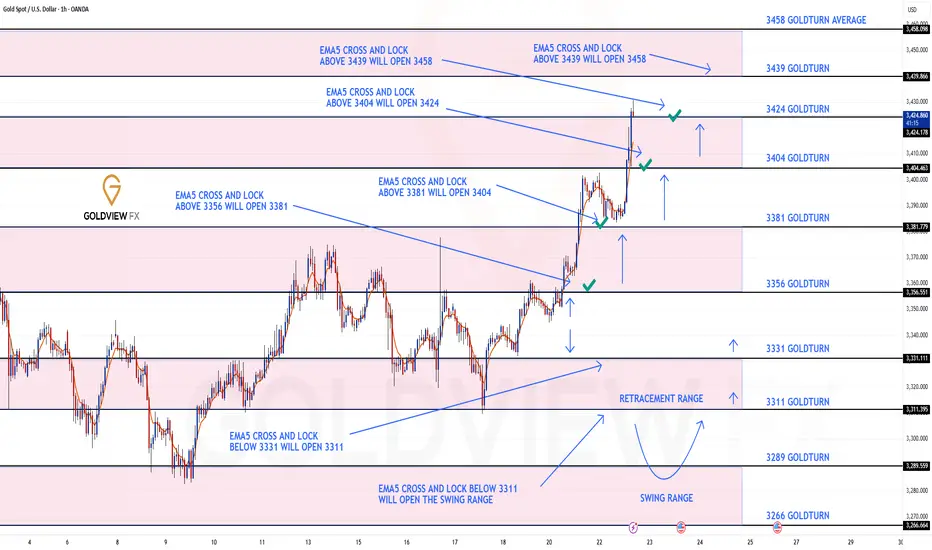
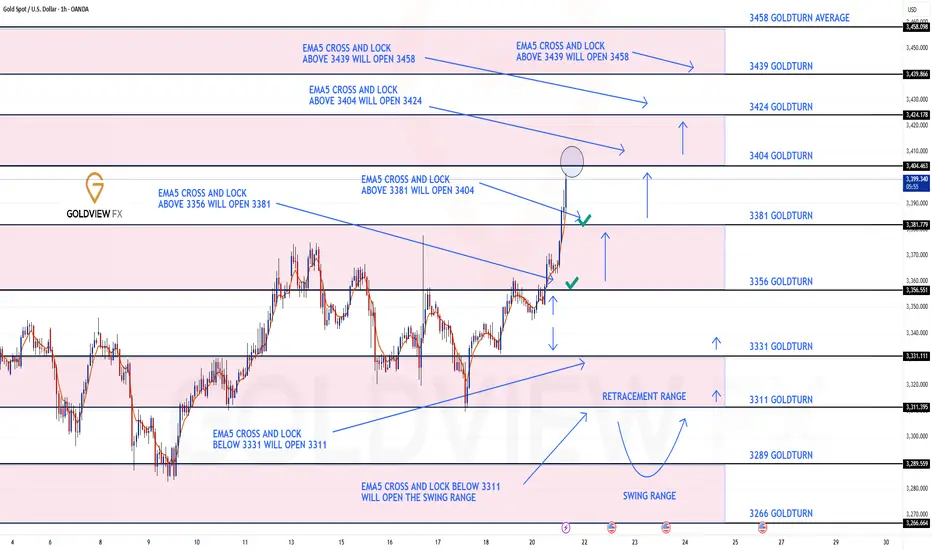
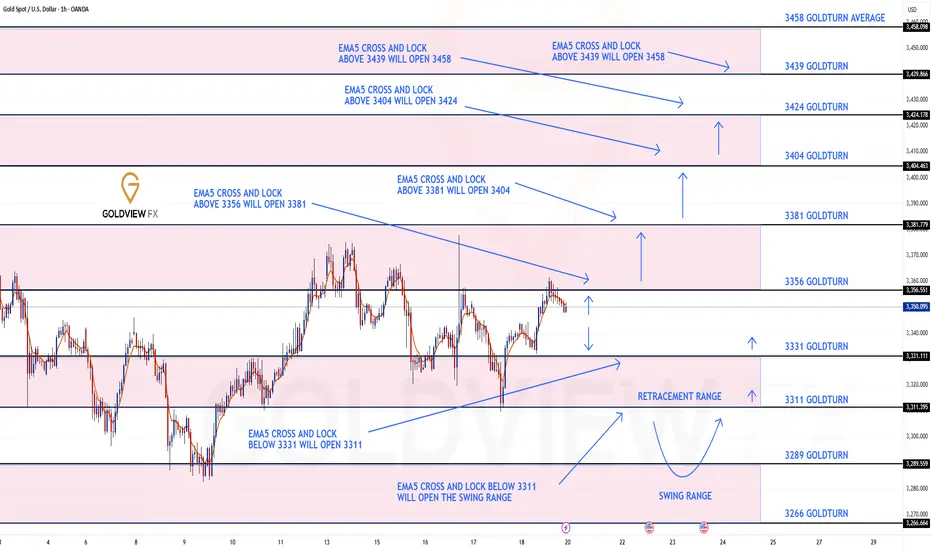
GOLD ROUTE MAP UPDATEHey Everyone,
Another great day on the charts today with our analysis playing out perfectly like we analysed.
As a follow up from yesterday, after completing 3356, we noted that EMA5 cross and lock opening 3404, which was hit perfectly today as analysed. With strong momentum, we also cleared the 3424 Bullish Target.
We will now look for an EMA5 lock above 3424 to open the next bullish level at 3439. Alternatively, a rejection here may see lower Goldtruns tested for support and bounce.
We will keep the above in mind when taking buys from dips. Our updated levels and weighted levels will allow us to track the movement down and then catch bounces up.
We will continue to buy dips using our support levels, taking 20 to 40 pips. As stated before, each of our level structures gives 20 to 40 pip bounces, which is enough for a nice entry and exit. If you backtest the levels we’ve shared every week for the past 24 months, you’ll see how effectively they were used to trade with or against short/mid-term swings and trends.
The swing ranges give bigger bounces than our weighted levels, that’s the difference between the two.
BULLISH TARGET
3356 - DONE
EMA5 CROSS AND LOCK ABOVE 3356 WILL OPEN THE FOLLOWING BULLISH TARGETS
3381 - DONE
EMA5 CROSS AND LOCK ABOVE 3381 WILL OPEN THE FOLLOWING BULLISH TARGET
3404 - DONE
EMA5 CROSS AND LOCK ABOVE 3404 WILL OPEN THE FOLLOWING BULLISH TARGET
3424 - DONE
EMA5 CROSS AND LOCK ABOVE 3424 WILL OPEN THE FOLLOWING BULLISH TARGET
3458
BEARISH TARGETS
3331
EMA5 CROSS AND LOCK BELOW 3331 WILL OPEN THE FOLLOWING BEARISH TARGET
3311
EMA5 CROSS AND LOCK BELOW 3311 WILL OPEN THE SWING RANGE
3289
3266
As always, we will keep you all updated with regular updates throughout the week and how we manage the active ideas and setups. Thank you all for your likes, comments and follows, we really appreciate it!
Mr Gold
GoldViewFX
7.18 Gold intraday operation strategy, short-term short first stFrom the 4-hour analysis, the short-term support below continues to focus on around 3316-25, the short-term suppression above focuses on the 3340-45 line, and the key pressure above focuses on the 3380 line. The overall support of 3316-3345 range still maintains the main tone of high-altitude and low-multiple cycles. In the middle position, watch more and do less, be cautious in chasing orders, and wait patiently for key points to enter the market.
Analysis of short-term gold trading on July 22Technical aspects:
From the daily candlestick chart, gold has recently shown signs of breaking upward after five weeks of sideways fluctuations. In terms of MACD indicators, the MACD bar chart has turned from green to red, and the fast and slow lines have formed a "golden cross", strengthening the expectation of a short-term technical rebound.
At the same time, the 14-day RSI index rebounded to 57.67, still in the neutral and strong area, and has not yet entered the overbought area, indicating that the price still has room to rise. Analysis shows that the middle track of the Bollinger Band 3342 constitutes initial support, while the strong support below is at the two previous lows of 3247.87 and 3120.64.
If the bulls maintain their advantage above the integer position of 3400, they are expected to hit the high point of 3451.14 in the short term, and even further test the historical high of 3499.83; on the contrary, if they fall back below 3342, the short-term upward momentum will be tested.
Bull analysis:
If gold successfully stands above 3400, the market will turn its attention to the two key resistance areas of 3451 and 3499, the high point of the year. Breaking through the former will open up the space to test the historical high upward; combined with the current MACD golden cross pattern, if the capital side and the fundamentals continue to cooperate, it is not ruled out that there will be a short-term accelerated rise.
Bear analysis:
If the breakthrough fails, especially if gold falls back below the middle track of Bollinger, the adjustment pressure will be restarted, and the lower edge of the previous consolidation range of 3300 will constitute an important support. If it falls below again, it is necessary to pay attention to the important technical support near 3247 and the 100-day moving average of 3180.
Gold trend analysis: bullish but not chasing the rise.Gold, last Thursday's daily line closed with a long lower shadow, bottomed out and stabilized, and once again stabilized at the lower track support point of the large convergence triangle. Combined with the cyclical movement after the two stabilizations at 3247 and 3282, it was three consecutive positive rises; therefore, last Friday, and at least these two days on Monday this week, there will be consecutive positive rises; today gold rose as expected, the Asian and European sessions continued to be strong, and there was a second rise in the U.S. session. Since the U.S. session went directly higher before and after, the current support below has moved up to the 3377-75 area, where a top and bottom conversion position will be formed. Therefore, if it falls back to 3375-77 in the evening, you can continue to go long and look to above 3400. If it falls below 3370, it will fluctuate. The upper short-term resistance level is 3387-3393, the previous high. If the market touches here for the first time, you can try to see a double top decline.

Gold opening market trend analysis.Last week, the gold price rebounded after hitting the low of 3310. The 4-hour chart shows that the Bollinger Bands failed to open downward, and the current market still maintains a volatile trend. Although the short-term price is easy to rise and difficult to fall, it should be noted that the three-month adjustment cycle is coming to an end when the fundamentals of the bull market remain unchanged, and the daily level change window is approaching. It is recommended to focus on preventing risks (especially short-term operation risks) at the opening today and wait patiently for the unilateral market start signal. In terms of short-term operations, the hourly chart price broke through the key level of 3344 after stepping back to the support of 3332. Today's overall trend is volatile and bullish. It is recommended to wait for the price to fall back to the 3337-3342 range to arrange long orders in batches at the opening today. Focus on the 3356-3366 resistance band above. If you encounter resistance, you can try short-term operations. Be sure to strictly stop losses to prevent the risk of false breakthroughs.

Gold continues to rise.The gold hourly line fell slightly to 3346 this morning and stabilized. It bottomed out and pulled up again to stand on the middle track of the hourly line, which means that the short-term stabilized and the overnight 3361 suppression adjustment ended. Looking at the second pull-up, this should have happened in the US market last Friday, but it was delayed until today. Finally, it successfully reached the 3366 target and hit the 3370 line;So today's Asian market rose, the European market continued to break high, and the US market still had a second pull-up; but because it is in a period of shock, wait patiently for a wave of stabilization before taking action. The reference point to choose is to pay attention to the 3382 split support, that is, 3361-60, which happens to be the top and bottom conversion support point, followed by 3358-56, 50 split support and the middle track, the limit is here, and then the starting point of 3350 cannot and should not break, otherwise it will encounter shocks and washes back and forth; the upper resistance level is concentrated at 3390-3395. It is expected that 3390 will not be able to break through in one breath for the time being. You can try to see a decline when you approach it for the first time;

Banana republic fears, gold tests $3,400Traders now price in a 60% chance of a Fed rate cut in September, as political pressure on the central bank intensifies.
Republican Rep. Anna Paulina Luna has officially accused Fed Chair Powell of perjury, while Treasury Secretary Scott Bessent has called for a full inquiry into the institution.
Earlier this month, former Fed Chair Janet Yellen told The New Yorker that these actions “...are the ones one expects from the head of a banana republic that is about to start printing money to fund fiscal deficits.”
Amid this backdrop, gold surged past $3,390 per ounce. The 1-hour XAU/USD chart shows strong bullish momentum supported by the Ichimoku cloud: price is well above the cloud with a clean breakout and lagging span confirmation. Immediate resistance sits at $3,400, with a potential extension toward $3,440–$3,450 if bullish pressure holds.
Meanwhile, EUR/USD remains in an uptrend on the daily chart, bouncing from pitchfork support. A sustained move above 1.1700 could reopen the path toward 1.1800+.

GOLD ROUTE MAP UPDATEHey Everyone,
Great start to the week with our chart idea playing out, as analysed.
We started with our Bullish target 3356 hit, followed with ema5 cross and lock above 3356 opening 3381. This was also hit perfectly completing this target. We now have a further ema5 cross and lock above 3381 leaving 3404 open with already a nice push up, just short of the full gap.
We will keep the above in mind when taking buys from dips. Our updated levels and weighted levels will allow us to track the movement down and then catch bounces up.
We will continue to buy dips using our support levels taking 20 to 40 pips. As stated before each of our level structures give 20 to 40 pip bounces, which is enough for a nice entry and exit. If you back test the levels we shared every week for the past 24 months, you can see how effectively they were used to trade with or against short/mid term swings and trends.
The swing range give bigger bounces then our weighted levels that's the difference between weighted levels and swing ranges.
BULLISH TARGET
3356 - DONE
EMA5 CROSS AND LOCK ABOVE 3356 WILL OPEN THE FOLLOWING BULLISH TARGETS
3381 - DONE
EMA5 CROSS AND LOCK ABOVE 3381 WILL OPEN THE FOLLOWING BULLISH TARGET
3404
EMA5 CROSS AND LOCK ABOVE 3404 WILL OPEN THE FOLLOWING BULLISH TARGET
3424
EMA5 CROSS AND LOCK ABOVE 3424 WILL OPEN THE FOLLOWING BULLISH TARGET
3458
BEARISH TARGETS
3331
EMA5 CROSS AND LOCK BELOW 3331 WILL OPEN THE FOLLOWING BEARISH TARGET
3311
EMA5 CROSS AND LOCK BELOW 3311 WILL OPEN THE SWING RANGE
3289
3266
As always, we will keep you all updated with regular updates throughout the week and how we manage the active ideas and setups. Thank you all for your likes, comments and follows, we really appreciate it!
Mr Gold
GoldViewFX
QUIET START TO THE WEEK, WATCH OUT FOR KEY RESISTANCE!🔔 GOLD PLAN 21/07 – QUIET START TO THE WEEK, WATCH OUT FOR KEY RESISTANCE!
🌍 Market Overview
Gold has bounced back strongly following a brief pullback late last week. The move comes as geopolitical tensions and global conflicts continue to escalate.
While this week may not feature high-impact economic data, macroeconomic risks and global uncertainty remain the primary drivers of price action.
📊 Technical Outlook
Price is currently approaching a strong resistance zone between 3377–3380, which aligns with a Buy Side Liquidity region.
💡 Sellers may step in here to push the price lower, aiming to fill FVG zones (Fair Value Gaps) left behind during the previous bullish rally.
⚠️ Entering SELL positions at this level is risky — only act upon confirmed reversal signals (candlestick rejection or volume-based confirmation).
🎯 Trade Setup
🟢 BUY ZONE: 3331 – 3329
Stop Loss: 3325
Take Profits:
3335 → 3340 → 3344 → 3348 → 3352 → 3358 → 3364 → 3370
🔴 SELL ZONE (confirmation required): 3377 – 3379
Stop Loss: 3383
Take Profits:
3372 → 3368 → 3364 → 3360 → 3350
📌 Key Notes
The 3347 zone acts as short-term support for bulls. If this level breaks, a move toward lower FVG liquidity zones becomes more likely.
Keep an eye on EU session volume for clearer short-term direction and better trade timing.
✅ Final Thoughts
Discipline is key. Stick to your TP/SL strategy to manage risk effectively during early-week volatility.
🛡️ Wishing everyone a successful start to the week. Stay patient, stay focused.
GOD BLESS ALL!
Analysis of short-term operations of gold on July 21Daily Analysis:
On the daily chart, it can be seen that gold has rebounded from the main rising trendline again, and bargain hunters have set clear risks below the trendline, betting on a price rebound to the 3438 resistance level. Bears need the price to break below the trendline to open up space for a deeper correction, with the next target looking at the 3120 level.
4-hour analysis
On the 4-hour chart, it can be seen that there is a secondary resistance area near 3377. If the price rebounds to this level, it is expected that bears will intervene here and set risks above the resistance, with the goal of pushing the price below the main trendline. Bulls will look for the price to break through this resistance to increase their bullish bets on the 3438 level.
XAUUSD Analysis Today Hello traders, this is a complete multiple timeframe analysis of this pair. We see could find significant trading opportunities as per analysis upon price action confirmation we may take this trade. Smash the like button if you find value in this analysis and drop a comment if you have any questions or let me know which pair to cover in my next analysis.

Gold - DAILY- 21.07.2025Gold held steady near $3,350 an ounce as markets opened Monday, with traders assessing mixed signals from Federal Reserve officials on the inflation impact of Trump’s tariff plans. Some Fed governors, like Waller and Bowman, signaled openness to rate cuts, while others remain cautious due to inflation risks. Trump continues pressuring the Fed to lower rates, with speculation about replacing Chair Jerome Powell. Meanwhile, EU officials are preparing for potential trade fallout as Trump’s Aug. 1 tariff deadline approaches. Gold is up over 25% this year, driven by geopolitical tensions and demand for safe-haven assets.
From a technical point of view, the price of gold found sufficient support on the 38.2% of the weekly Fibonacci retracement level and is currently testing the resistance on the 50% around $3,355. The moving averages are confirming the overall bullish trend in the market, while at the same time, the Stochastic oscillator is near the extreme overbought level, hinting at a potential bearish correction move in the upcoming sessions. The Bollinger bands are quite expanded, showing that volatility is there to support any short-term move to either side, while the level around $3,380 is the first major technical resistance area consisting of the upper band of the Bollinger bands and the 61.% of the weekly Fibonacci retracement level.
Disclaimer: The opinions in this article are personal to the writer and do not reflect those of Exness

Buy first when gold falls back, and pay attention to the strengtGold went on a roller coaster ride last week. It rose to around 3377 at the beginning of the week and then fell back under pressure. After stabilizing near 3309 on Thursday, it strengthened again on Friday and came under pressure near 3361. It fell back slightly to around 3344 at the opening in the morning and is currently rising again. In the morning, pay attention to the opportunity to buy first after the pullback, pay attention to the strength of the European session, and pay attention to the pressure near 3378/80 on the upside.

GOLD 1H CHART ROUTE MAP UPDATE & TRADING PLAN FOR THE WEEKHey Everyone,
Please see our updated 1h chart levels and targets for the coming week.
We are seeing price play between two weighted levels with a gap above at 3356 and a gap below at 3331. We will need to see ema5 cross and lock on either weighted level to determine the next range.
We will see levels tested side by side until one of the weighted levels break and lock to confirm direction for the next range.
We will keep the above in mind when taking buys from dips. Our updated levels and weighted levels will allow us to track the movement down and then catch bounces up.
We will continue to buy dips using our support levels taking 20 to 40 pips. As stated before each of our level structures give 20 to 40 pip bounces, which is enough for a nice entry and exit. If you back test the levels we shared every week for the past 24 months, you can see how effectively they were used to trade with or against short/mid term swings and trends.
The swing range give bigger bounces then our weighted levels that's the difference between weighted levels and swing ranges.
BULLISH TARGET
3356
EMA5 CROSS AND LOCK ABOVE 3356 WILL OPEN THE FOLLOWING BULLISH TARGETS
3381
EMA5 CROSS AND LOCK ABOVE 3381 WILL OPEN THE FOLLOWING BULLISH TARGET
3404
EMA5 CROSS AND LOCK ABOVE 3404 WILL OPEN THE FOLLOWING BULLISH TARGET
3424
EMA5 CROSS AND LOCK ABOVE 3424 WILL OPEN THE FOLLOWING BULLISH TARGET
3458
BEARISH TARGETS
3331
EMA5 CROSS AND LOCK BELOW 3331 WILL OPEN THE FOLLOWING BEARISH TARGET
3311
EMA5 CROSS AND LOCK BELOW 3311 WILL OPEN THE SWING RANGE
3289
3266
As always, we will keep you all updated with regular updates throughout the week and how we manage the active ideas and setups. Thank you all for your likes, comments and follows, we really appreciate it!
Mr Gold
GoldViewFX
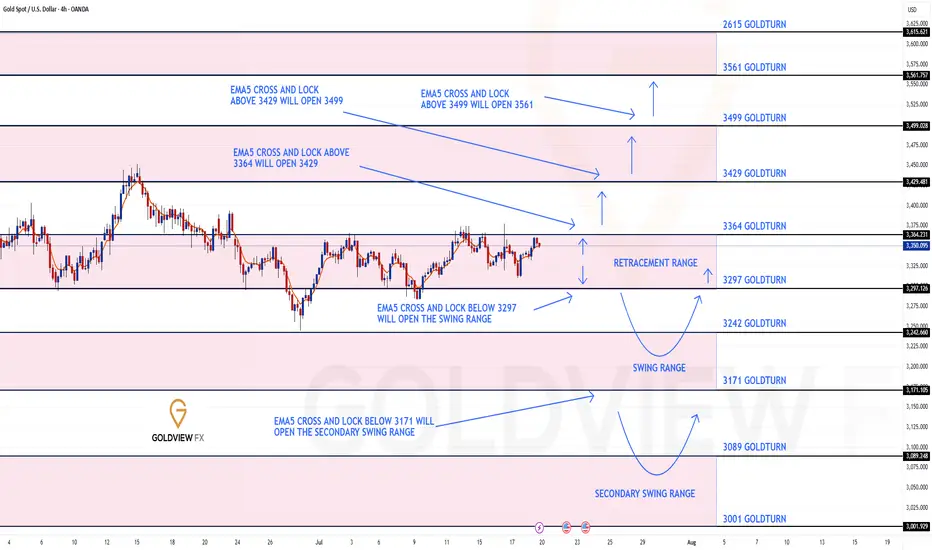
GOLD 4H CHART ROUTE MAP UPDATE & TRADING PLAN FOR THE WEEKHey Everyone,
Please see our updated 4h chart levels and targets for the coming week.
We are seeing price play between two weighted levels with a gap above at 3364 and a gap below at 3297. We will need to see ema5 cross and lock on either weighted level to determine the next range.
We will see levels tested side by side until one of the weighted levels break and lock to confirm direction for the next range.
We will keep the above in mind when taking buys from dips. Our updated levels and weighted levels will allow us to track the movement down and then catch bounces up.
We will continue to buy dips using our support levels taking 20 to 40 pips. As stated before each of our level structures give 20 to 40 pip bounces, which is enough for a nice entry and exit. If you back test the levels we shared every week for the past 24 months, you can see how effectively they were used to trade with or against short/mid term swings and trends.
The swing range give bigger bounces then our weighted levels that's the difference between weighted levels and swing ranges.
BULLISH TARGET
3364
EMA5 CROSS AND LOCK ABOVE 3364 WILL OPEN THE FOLLOWING BULLISH TARGETS
3429
EMA5 CROSS AND LOCK ABOVE 3429 WILL OPEN THE FOLLOWING BULLISH TARGET
3499
EMA5 CROSS AND LOCK ABOVE 3499 WILL OPEN THE FOLLOWING BULLISH TARGET
3561
BEARISH TARGETS
3297
EMA5 CROSS AND LOCK BELOW 3297 WILL OPEN THE SWING RANGE
3242
3171
EMA5 CROSS AND LOCK BELOW 3171 WILL OPEN THE SECONDARY SWING RANGE
3089
3001
As always, we will keep you all updated with regular updates throughout the week and how we manage the active ideas and setups. Thank you all for your likes, comments and follows, we really appreciate it!
Mr Gold
GoldViewFX
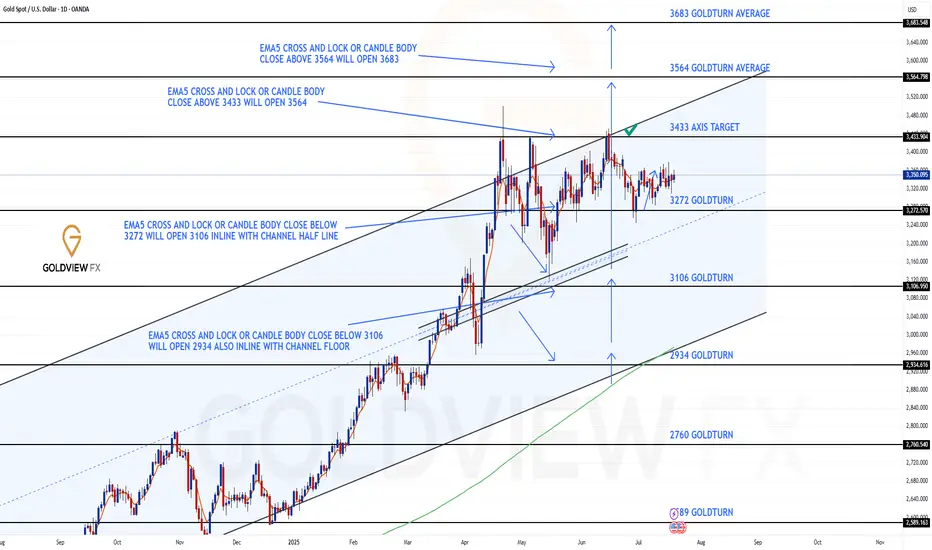
GOLD DAILY CHART ROUTE MAPHey Everyone,
Daily Chart Follow-Up – Structure Still in Full Control
Just a quick update on our daily structure roadmap. Price continues to respect our Goldturn levels with surgical precision.
After the previous bounce off 3272, we saw over 800 pips of upside follow through. That level once again proved its weight, holding beautifully as support and launching price firmly back toward the upper boundary.
Since last week’s update, nothing has changed structurally – the range remains intact and fully respected. Price is still trading between the well defined 3272 support and the untested 3433 resistance. We’ve yet to revisit 3433, which remains our key upside target and a potential inflection point.
Here’s what we’re focusing on next:
🔹 Range scenario active:
Until price breaks out cleanly, we anticipate continued swings between 3433 resistance and 3272 support. This remains the active range setup.
🔹 EMA5 cross and lock:
We’re still watching for a decisive EMA5 break and lock. Without that, we expect more range-bound action rather than a breakout.
🔹 Structure remains intact:
No EMA5 breakdown off 3272 during the recent retest means buyers are still in control. Dips into 3272 remain valid long entries within this structure.
Key Levels This Week
📉 Support – 3272
Proven bounce zone. Continues to hold structure. As long as this holds, the bias remains constructive.
📈 Resistance – 3433
Open gap + channel top confluence. Still untested. Watching for a reaction or breakout confirmation here.
Thanks again for all the continued support, your likes, comments, and follows mean the world.
Wishing you another focused and profitable week ahead!
Mr Gold
GoldViewFX
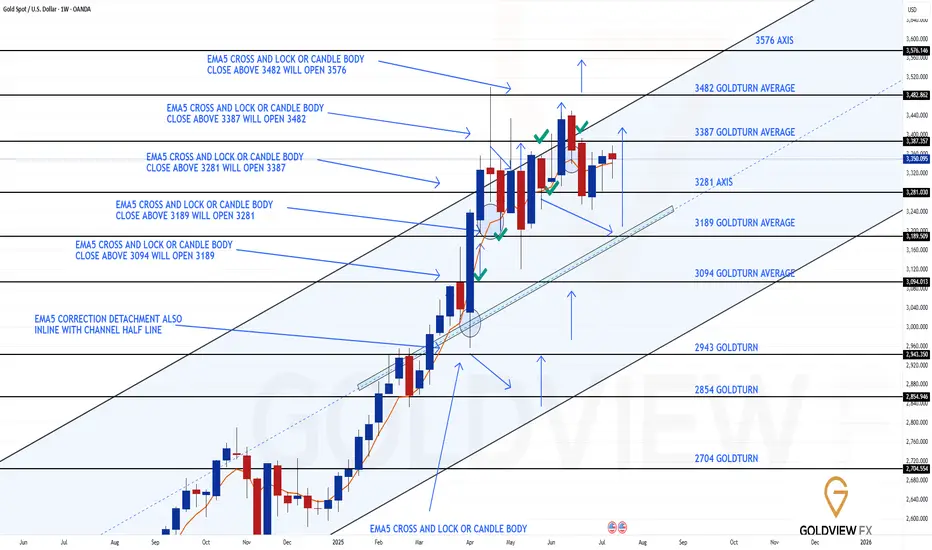
GOLD WEEKLY CHART MID/LONG TERM ROUTE MAPHey Everyone,
Please see update on our Weekly Chart idea.
As of now, nothing has changed structurally, the framework remains fully intact, and price continues to trade cleanly within the defined range.
After delivering a rejection at the channel top, price pulled back into 3281 support, where buyers once again stepped in decisively. That level held firm on a weekly closing basis, validating it as a reliable pivot and launching price back into bounce mode.
Despite the progress, we’ve yet to test the 3387 gap, which continues to act as a short term magnet. The longer range gap at 3482 also remains open and in focus as the larger objective.
Key takeaways from the current structure:
🔹 Structure unchanged:
The rising channel remains orderly. EMA5 still hasn’t locked bearishly, and the mid-line continues to climb beneath price, maintaining a constructive bias.
🔹 Support confirmed – 3281:
Held for a second time, reaffirming its significance in the broader structure.
🔹 3387 gap still in play:
While price is gravitating toward this zone, it has not yet been tested. Expect a reaction on first contact.
Updated Levels to Watch:
📉 Immediate Support – 3281
Held again, reinforcing its status as the key structural axis.
📈 Resistance 1 – 3387
Still untested. Remains the active near term target.
📈 Resistance 2 – 3482
Unfilled weekly gap and broader objective.
Plan:
As long as 3281 continues to hold, the bias remains for a measured grind higher toward 3387 and, eventually, 3482. If 3281 fails, we’ll reassess at the rising mid line for the next structured long opportunity.
As always, we will keep you all updated with regular updates throughout the week and how we manage the active ideas and setups. Thank you all for your likes, comments and follows, we really appreciate it!
Mr Gold
GoldViewFX
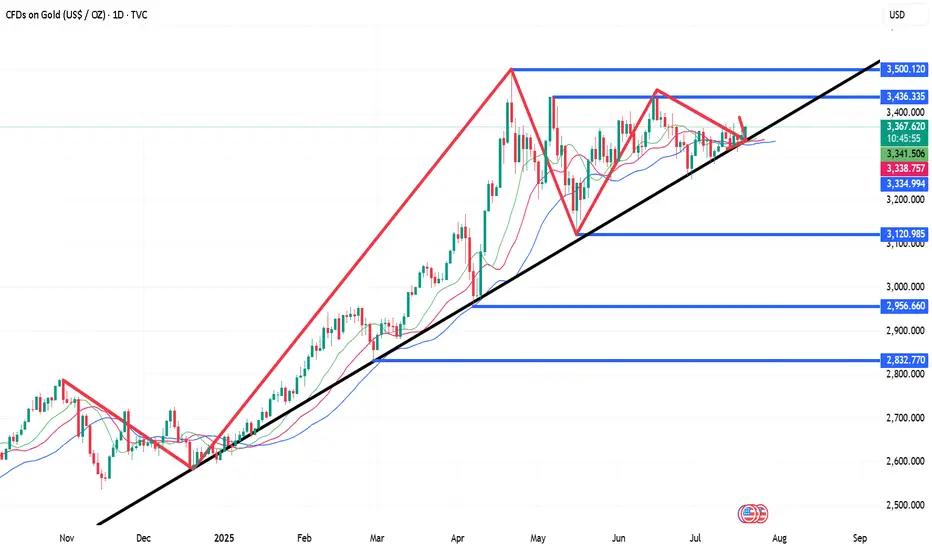
GOLD (XAUUSD): Sticking to the Plan
Update for my last Sunday's post for Gold.
Previously, we spotted a cup & handle pattern on a daily time frame.
It turned into an ascending triangle pattern - another bullish formation this week.
I am sticking to the same plan - our strong bullish signal is a breakout
of a neckline of the pattern and a daily candle close above 3378.
It will confirm a strong up movement.
❤️Please, support my work with like, thank you!❤️
I am part of Trade Nation's Influencer program and receive a monthly fee for using their TradingView charts in my analysis.

How to seize deterministic trading opportunities?The rebound momentum of the gold market has been significantly enhanced today. After breaking through the 3345 resistance in the Asian session, it has continued to rise. It has now reached around 3360, and has rebounded by more than US$50 from this week's low of 3310, setting a new rebound high in the past three trading days. After the gold price effectively broke through the key resistance band of 3340–3350, it triggered some short stop loss trading and trend funds to enter the market, driving the price to accelerate the upward trend. Judging from the hourly chart, the trading volume has increased by about 30% compared with the same period yesterday, indicating that the market's recognition of this round of rebound has increased significantly.
A physically full sun candle chart has been closed in the 4-hour cycle, successfully standing on the Bollinger middle track, further confirming the upward structure, the mid-track support area 3340–3345 has become a key position for bulls' defense, and the short-term structure of the market is still relatively strong. Overall, the intraday retracement range of gold is limited, and the probability of continuing to rise is relatively high. In terms of strategy, it is still recommended to go long. In the short term, focus on the 3340–3345 area retracement support, and the stop-profit target is 3365–3370; if the upward breakthrough, pay attention to the suppression performance of the 3370–3375 line, beware of highs and falls, and pay attention to controlling risks.
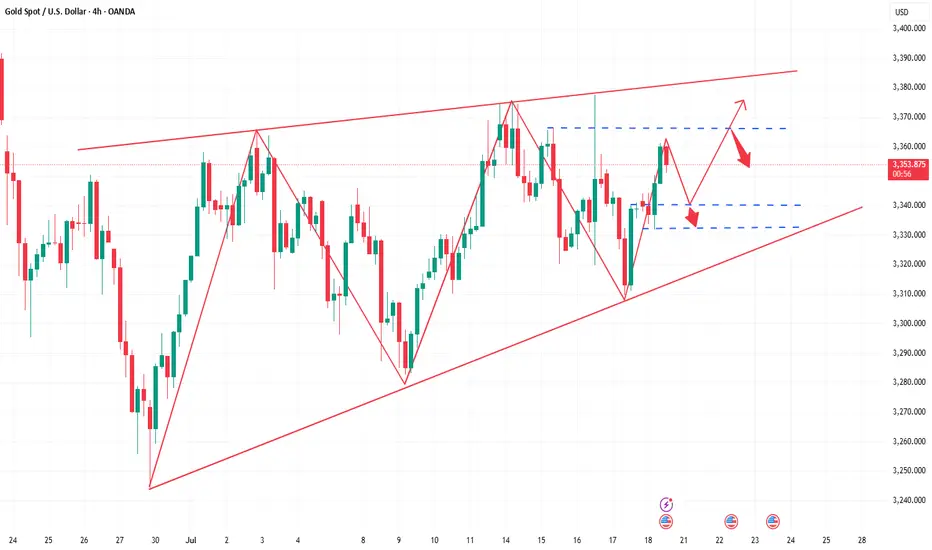
GOLD OUTLOOK – READY FOR THE NEW TRADING WEEK (JULY 21–25)GOLD OUTLOOK – READY FOR THE NEW TRADING WEEK (JULY 21–25)
🟡 Market Recap:
Gold made a strong bullish reversal at the end of last week, following a liquidity sweep at the FVG ZONE 3310. Price surged quickly toward the OBS SELL ZONE around 335x–336x.
However, by Friday’s close, price reacted to multiple confluences (OBS + FIBO zones) and closed below the VPOC level in the recent uptrend – forming a potential short-term top.
📉 Outlook for July 21–25:
No major economic data expected next week.
However, geopolitical tensions and trade policy concerns (e.g. tariffs, military conflicts) will be the key catalysts.
These events could lead to high volatility and liquidity grabs across the board.
🧠 Technical Perspective – H1 Mid-Term View:
Gold continues to form multiple unfilled Fair Value Gaps (FVGs) after strong bullish moves.
Recent price action created new high-zone FVGs, but lower FVGs remain untested.
🔁 Expected scenario: A potential retracement to fill the lower FVG zones (3310/3305), followed by another bullish leg.
📍Trading Strategy:
Wait for price to retrace into FVG Low Zones.
Look for early BUY setups at confluence areas:
CP zones
FIBO retracement levels
Volume/Price reaction zones
🎯 Target Outlook:
Bullish targets around 333x – 336x remain valid.
If price sustains momentum after pullback, we may aim for Buy Side Liquidity near 3371.749.
✅ Key Reminders:
Avoid chasing highs (FOMO).
Stick to proper TP/SL rules, especially with headline-driven markets next week.
🎉 Wishing you a relaxing weekend – recharge and get ready to conquer the markets next week!
🚀 GOD BLESS ALL
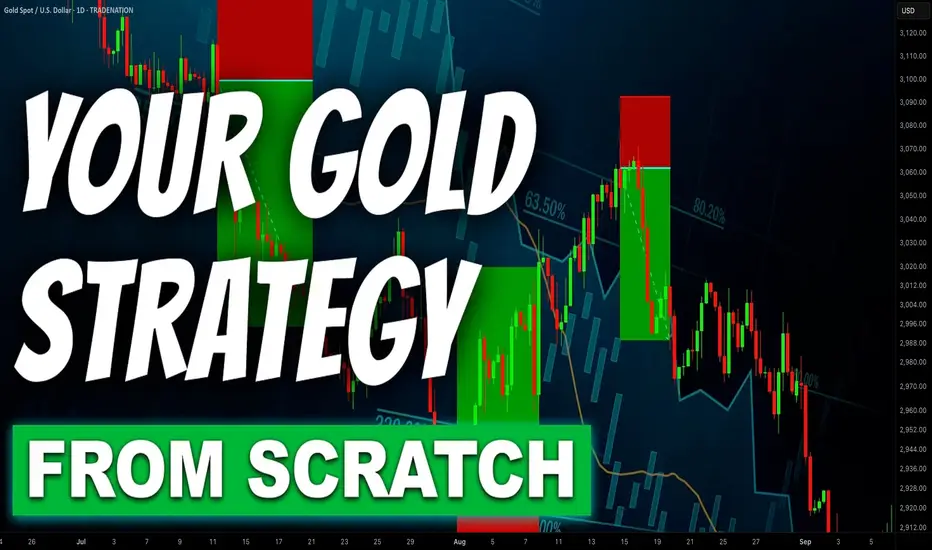
Step-By-Step Guide to Building a Winning Gold Trading Strategy
In the today's article, I will teach you how to create your first profitable gold trading strategy from scratch.
Step 1: Choose the type of analysis
The type of analysis defines your view on the market.
With technical analysis you rely on patterns, statistical data, technical indicators, etc. for making trading decisions.
Fundamental analysis focuses on factors that drive the prices of gold such as micro and macroeconomics, news and geopolitics.
A combination of technical and fundamental analysis implies the application of both methods.
For the sake of the example, we will choose pure technical approach.
Step 2: Specify the area of analysis
Technical and fundamental analysis are complex and multilayered subjects. That is why it is crucially important to choose the exact concepts and techniques that you will apply in gold trading.
For example, with a technical analysis, you can trade harmonic patterns, or apply a combination of key levels and technical indicators.
With fundamental analysis, you can build your trading strategy around trading the economic calendar or important news releases.
Here we will choose support & resistance levels and smart money concepts.
Step 3: Select a trading time frame
Your trading time frame will define your trading style. Focusing on hourly time frame, for example, you will primarily catch the intraday moves, while a daily time frame analysis will help you to spot the swing moves.
You can also apply the combination of several time frames.
We will choose the combination of a daily and an hourly time frames.
Step 4: Define your trading zones
By a trading zone, I mean an area or a level on a price chart from where you will look for trading opportunities.
For example, a technical indicator trader may apply moving average as the trading point.
For the sake of the example, we will choose support and resistance levels on a daily time frame as our trading areas.
Step 5: Choose confirmations
Confirmation is your entry reason . It is the set of conditions that indicates a highly probable projected outcome.
For an economic calendar traders, the increasing CPI (inflation) figures can be a solid reason to open a long position on Gold.
Our confirmation will be a local change of character on an hourly time frame.
Step 6: Define your stop loss placement, entry and target selection and desired reward to risk ratio
You should know exactly where should be your entry point, where will be your stop loss and where should be the target.
We will open a trading position immediately after a confirmed change of character, stop loss will lie below the lows if we buy or above the highs if we sell.
Target will be the next daily structure.
Minimal reward to risk ration should be 1.5.
Step 7: Define Your Lot Size and Risk Per Trade
You should have precise rules for the calculation of a lot size for each trade.
For our example, we will strictly risk 1% of our trading deposit per trade.
Step 8: Set trade management rules
When the trade is active, trade management rules define your action:
for example, whether you strictly wait for tp or sl, or you apply a trailing stop loss.
In our strategy, we will move stop loss to entry 10 minutes ahead of the release of the US news in the economic calendar.
Step 9: Back test your strategy
Study the historical data and back test at least 50 trading setups that meet your strategy criteria.
Make sure that the strategy has a positive win rate.
Step 10: Try a trading strategy on a demo account
Spend at least a month on demo account and make sure that you obtain positive overall results.
If you see consistent profits on a demo account, it is the signal for you that your strategy is ready , and it's time to start trading on a real account.
In case of negative results, modify your trading conditions and back test them again, or build a new strategy from scratch.
❤️Please, support my work with like, thank you!❤️
I am part of Trade Nation's Influencer program and receive a monthly fee for using their TradingView charts in my analysis.