GOLD 1H CHART ROUTE MAP UPDATE & TRADING PLAN FOR THE WEEKHey Everyone,
Please see our updated 1h chart levels and targets for the coming week.
We are seeing price play between two weighted levels with a gap above at 3358 and a gap below at 3330. We will need to see ema5 cross and lock on either weighted level to determine the next range.
We will see levels tested side by side until one of the weighted levels break and lock to confirm direction for the next range.
We will keep the above in mind when taking buys from dips. Our updated levels and weighted levels will allow us to track the movement down and then catch bounces up.
We will continue to buy dips using our support levels taking 20 to 40 pips. As stated before each of our level structures give 20 to 40 pip bounces, which is enough for a nice entry and exit. If you back test the levels we shared every week for the past 24 months, you can see how effectively they were used to trade with or against short/mid term swings and trends.
The swing range give bigger bounces then our weighted levels that's the difference between weighted levels and swing ranges.
BULLISH TARGET
3358
EMA5 CROSS AND LOCK ABOVE 3358 WILL OPEN THE FOLLOWING BULLISH TARGETS
3389
EMA5 CROSS AND LOCK ABOVE 3389 WILL OPEN THE FOLLOWING BULLISH TARGET
3416
EMA5 CROSS AND LOCK ABOVE 3416 WILL OPEN THE FOLLOWING BULLISH TARGET
3439
BEARISH TARGETS
3330
EMA5 CROSS AND LOCK BELOW 3330 WILL OPEN THE FOLLOWING BEARISH TARGET
3306
EMA5 CROSS AND LOCK BELOW 3306 WILL OPEN THE SWING RANGE
3283
3254
As always, we will keep you all updated with regular updates throughout the week and how we manage the active ideas and setups. Thank you all for your likes, comments and follows, we really appreciate it!
Mr Gold
GoldViewFX
Goldtrading

GOLD 4H CHART ROUTE MAP UPDATE & TRADING PLAN FOR THE WEEKHey Everyone,
Please see our updated 4h chart levels and targets for the coming week.
We are seeing price play between two weighted levels with a gap above at 3301 and a gap below at 3242. We will need to see ema5 cross and lock on either weighted level to determine the next range.
We will see levels tested side by side until one of the weighted levels break and lock to confirm direction for the next range.
We will keep the above in mind when taking buys from dips. Our updated levels and weighted levels will allow us to track the movement down and then catch bounces up.
We will continue to buy dips using our support levels taking 20 to 40 pips. As stated before each of our level structures give 20 to 40 pip bounces, which is enough for a nice entry and exit. If you back test the levels we shared every week for the past 24 months, you can see how effectively they were used to trade with or against short/mid term swings and trends.
The swing range give bigger bounces then our weighted levels that's the difference between weighted levels and swing ranges.
BULLISH TARGET
3364
EMA5 CROSS AND LOCK ABOVE 3364 WILL OPEN THE FOLLOWING BULLISH TARGETS
3429
EMA5 CROSS AND LOCK ABOVE 3429 WILL OPEN THE FOLLOWING BULLISH TARGET
3499
EMA5 CROSS AND LOCK ABOVE 3429 WILL OPEN THE FOLLOWING BULLISH TARGET
3499
EMA5 CROSS AND LOCK ABOVE 3499 WILL OPEN THE FOLLOWING BULLISH TARGET
3561
BEARISH TARGETS
3295
EMA5 CROSS AND LOCK BELOW 3295 WILL OPEN THE SWING RANGE
3242
3171
EMA5 CROSS AND LOCK BELOW 3171 WILL OPEN THE SECONDARY SWING RANGE
3089
3001
As always, we will keep you all updated with regular updates throughout the week and how we manage the active ideas and setups. Thank you all for your likes, comments and follows, we really appreciate it!
Mr Gold
GoldViewFX

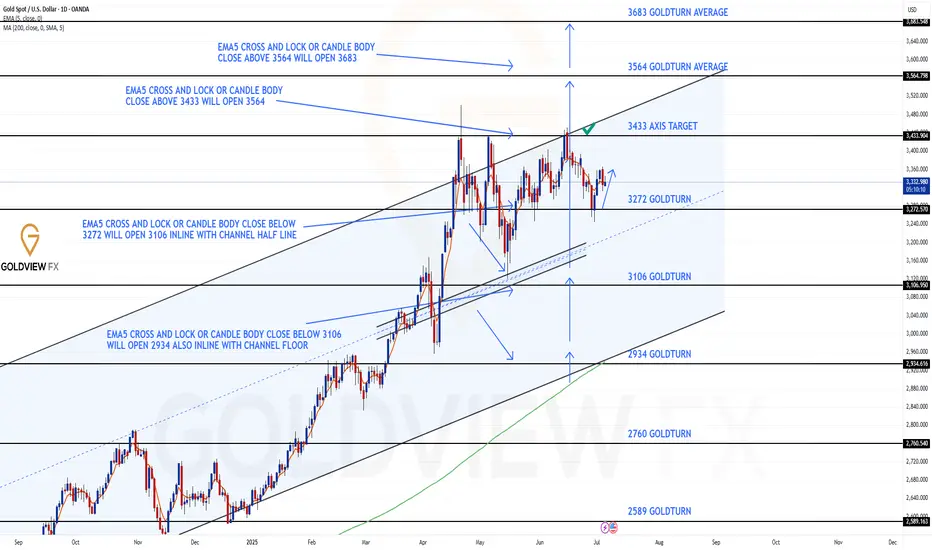
GOLD DAILY CHART ROUTE MAP Hey Everyone,
Please see update and plans for the coming week on our Daily chart idea that we have been tracking.
After wrapping up last week and actively tracking the 1h and 4h structures throughout last week within the daily chart overall structure. This brings everything together and reminds us how the broader structure has continued to evolve in our favour.
The bounce off at 3272 that we outlined has now fully played out, showing yet again how critical these Goldturn levels are in guiding our strategy.
Following the clean rejection at the channel top near 3433, price moved precisely into the 3272 support, where we were focused on structure to hold. That level held beautifully, giving us a strong technical base for upward continuation.
As we head into the new week, we’ve once again seen price find support at 3272, with a clean bounce that opens up the potential for price to fill the gap back toward 3433, as long as EMA5 remains above 3272. This dynamic will be a key technical trigger for us to monitor in the coming sessions.
There was no EMA5 cross and lock breakdown, which confirmed that buyers maintained control at this level. That absence of breakdown was our confirmation that the bounce structure was not only valid, but likely to continue unfolding into the new week.
As price grinds its way back up the channel, we’ll keep watching for reactions at key resistance zones, with special attention to 3433, the channel top. The measured structural reaction from 3272 has been perfect and supports our method of trading level to level, always with patience and discipline.
Key Levels to Watch This Week:
🔼 Resistance: 3433 (channel top, gap target)
🔽 Support: 3272 (confirmed bounce zone)
Thanks again for all the support, likes, comments, and follows are always appreciated.
Wishing you all a strong start to the week ahead!
Mr Gold
GoldViewFX

GOLD MONTHLY CHART LONG TERM/RANGE ROUTE MAPHey Everyone,
We’ve just released our new Monthly Chart idea, which we’ll now be tracking following the successful completion of our previous long term monthly chart idea. That one played out beautifully, and now it’s time to shift focus to the next big setup.
Currently, price is trading above the channel midline, and we’ve also seen an important EMA5 cross and lock above 3099, with a candle body close confirming a long term gap above at 3557.
While this confirms the bullish long term structure, we’re also mindful of the potential for a short term retracement, particularly around the EMA5 detachment zone (highlighted with a circle on the chart). This would offer a healthy dip opportunity, aligning perfectly with our strategy to buy into weakness on the way up.
For the bigger structure to remain intact, we’ll be looking for 3099 to continue holding as key structural support. As long as that level is respected, the long term gap toward 3557 remains firmly in play.
This is a higher timeframe idea that we’ll be building on as structure continues to unfold.
We will continue to use all support structures, across all our multi time frame chart ideas to buy dips also keeping in mind our long term gaps above. Short term we may look bearish but looking at the monthly chart allows us to see the bigger picture and the overall long term Bullish trend.
As always, we will keep you all updated with regular updates throughout the week and how we manage the active ideas and setups. Thank you all for your likes, comments and follows, we really appreciate it!
Mr Gold
GoldViewFX

GOLD (XAUUSD): Support & Resistance Analysis For Next Week
Here is my latest structure analysis
and important supports and resistances for Gold for next week.
Resistance 1: 3356 - 3368 area
Resistance 2: 3391 - 3403 area
Resistance 3: 3443 - 3452 area
Resistance 4: 3493 - 3501 area
Support 1: 3230 - 3274 area
Support 2: 3120 - 3177 area
Consider these structures for pullback/breakout trading.
❤️Please, support my work with like, thank you!❤️
I am part of Trade Nation's Influencer program and receive a monthly fee for using their TradingView charts in my analysis.

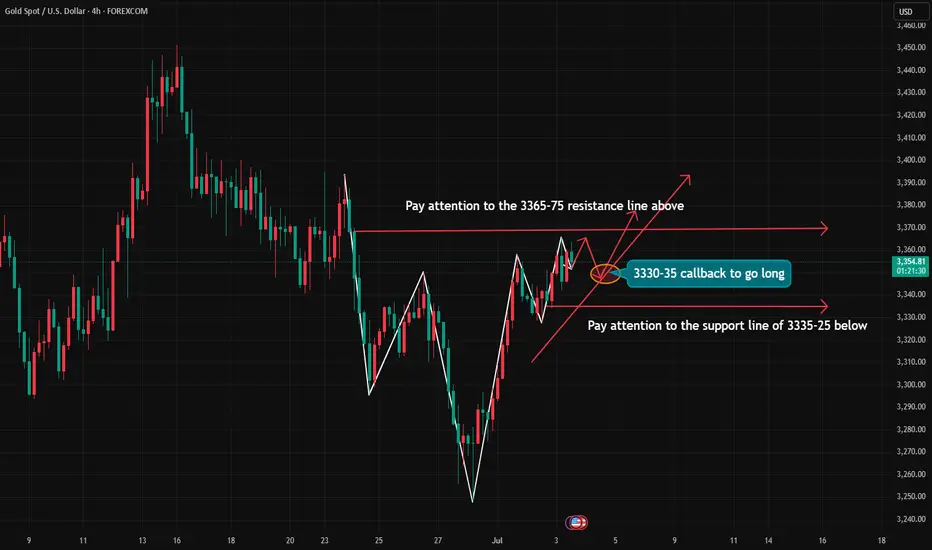
Gold fluctuates frequently, how to seize the opportunity?We started high-altitude layout from 3365. We took the lead in seizing this wave of decline opportunities and firmly held the bearish view. We harvested short orders all the way to 3325. The gold short orders were continuously stopped at profit, and the rhythm was very steady. The current market fluctuated repeatedly and the direction was chaotic, but we always insisted on executing the strategy - do it when you see it, and you can reap good rewards if you can hold it. Although there is support and resistance at the 3333 line in the short term, it is not recommended to chase more. The risk is relatively large. The key is to step back more. Wait for the 3325-3315 area to consider laying out long orders. We do not do dead shorts, nor do we blindly do more. We always maintain flexible response and rational judgment on the market.
From the current trend of gold, pay attention to the short-term support of 3325-3320 below, focus on the support position of 3315-3310, and pay attention to the short-term resistance around 3345-3350 above. The overall main tone of high-altitude low-multiple cycle participation remains unchanged. In the mid-line position, keep watching and do less, chase orders cautiously, and wait for the opportunity to enter the market after the key points are in place. For more specific operational details and strategy updates, please pay attention to the notification at the bottom 🌐 and pay attention in time.
Gold operation suggestions:
1. Go long near 3325-3315, target 3335-3345.
2. Go short near 3340-3350, target 3330-3320.

GOLD ROUTE MAP UPDATEHey Everyone,
Great finish to the week!!
We will now finish off with the Daily chart update, after following the 1h and 4h chart throughout the week. This will now remind everyone, how we broke down the overall structure into play.
The bounce scenario off 3272 has now officially played out, just as outlined.
After the clean rejection at the channel top near 3433, price moved precisely into the 3272 Goldturn support, where we were watching closely for structure to hold. That level held beautifully, providing a solid base for this week’s strong push upward.
This reaction once again highlights the precision and reliability of the Goldturn levels - 3272 acted as a critical pivot, and the market respected it perfectly. We didn’t get an EMA5 cross and lock breakdown, confirming that buyers were still in control at this support, and that was our green light for bounce structure to unfold.
As price grinds its way back up the channel, we’ll continue to monitor reactions at key resistance zones. The measured structural move from 3272 reinforces our approach of trading level to level with patience and confirmation, not emotion.
We’ll be back Sunday with a full multi timeframe analysis to prepare for next week’s setups including updated views on the higher timeframes, EMA alignments, and structure expectations going forward.
Key Levels to Watch:
Resistance: 3433 (channel top)
Support: 3272 (confirmed bounce zone)
Thanks again for all your likes, comments, and follows.
Wishing you all a fantastic weekend!!
Mr Gold
GoldViewFX
Maintain range fluctuations during the day?Gold has maintained a volatile pattern recently. As the US market is closed today for Independence Day, the market volatility is expected to be limited, but the volatile market will continue, but the volatility range may change. Yesterday's gold price fell mainly due to the news, and this decline usually does not last too long. From a technical point of view, gold prices are supported near 3310-3300, which is the key support level today. It is worth noting that on Wednesday, gold prices were under pressure in the 3340-3350 area, and on Thursday, prices formed support in this range, indicating that the area is forming a top-bottom conversion. Therefore, 3340-3350 has become an important pressure level today. It is expected to fluctuate in the 3300-3340/3350 range during the day. The impact of news on gold prices is usually short-term. When the fundamentals and technical directions are consistent, price fluctuations will be more obvious. When the two are inconsistent, price fluctuations will weaken, but will not change the technical trend. The rebound pattern established at the beginning of the week is still valid. After a short-term shock, gold prices are expected to re-stand above 3345 and continue to maintain the rebound trend.

GOLD (XAUUSD): Potential Scenarios Explained
Here is my updated technical outlook for Gold with potential scenarios.
Bullish Scenario
The price is currently testing a significant daily resistance cluster.
Its bullish breakout and a daily candle close above 3368 will
provide a strong confirmation.
More growth will be expected then.
Bearish Scenario
For now, the market is consolidating on the underlined resistance.
The price is stuck within a horizontal range on a 4H time frame now.
Your bearish signal will be a breakout of its support and a 4H candle
close below 3310.
It will provide a strong bearish confirmation.
The market might be weak and remain within a 4H range today.
But, everything can happen, so watch carefully.
❤️Please, support my work with like, thank you!❤️
I am part of Trade Nation's Influencer program and receive a monthly fee for using their TradingView charts in my analysis.

How to grasp the key entry opportunity in the gold market?The market is changing rapidly, and going with the trend is the kingly way. When the trend comes, just do it. Don't buy at the bottom against the trend, so as not to suffer. Remember not to act on impulse when trading. The market is good at dealing with all kinds of dissatisfaction, so you must not hold on to orders. I believe many people have experienced this deeply. The more you resist, the more panic you will feel, and your floating losses will continue to magnify. You will not be able to eat or sleep well, and you will miss many opportunities in vain. If you also have these troubles, then you might as well keep up with my pace and try to see if it can make you suddenly enlightened.
The non-agricultural data was unexpectedly cold, with a large negative impact. The stochastic indicator in the daily chart formed a golden cross, which was a main multi-signal. The BOLL range shrank, and the range shrank to 3418-3280. This range is the main range. The price pierced up and down the central axis and hovered, waiting for the news data to stimulate. The upper track of the 4-hour Bollinger band is at $3380, and the integer mark of $3400 is also near the high point of gold prices last week. The 5-day moving average and the MACD indicator cross upward, and the KDJ and RSI indicators cross upward. In the short-term technical aspect, gold has a trend of further rebound. At present, the upper resistance is at 3360-3365, and the support position is around 3310-3300.
Gold operation strategy: It is recommended to go long near 3312-3315, with a target of 3330-3340. It is recommended to go short once it touches 3340 for the first time, with a target of 3320-3310.

How to accurately grasp gold trading opportunities?Gold rebounded as expected, and fell under pressure at the 3295-3296 line during the European session. This position was the key resistance level for the previous top and bottom conversion, and the range shock pattern continued. In terms of operation, the high-altitude and low-multiple ideas remain unchanged, and we will continue to pay attention to the short opportunities after the rebound.
📉 Operational ideas:
Short orders can be arranged in batches in the 3295-3311 area, and the target is 3280-3270 area;
If the support below 3260-3255 is effective, you can consider taking the opportunity to reverse long orders and participate in short-term.
📌Key position reference:
Upper pressure: 3295, 3311
Lower support: 3278-3275, 3260-3255
Gold strategy idea suggests shorting at 3291-3293, perfectly capturing the rebound high point! Smoothly reached the profit target of 3275, gaining 18pips! If you are not able to flexibly respond to the market in trading, and are not good at adjusting your trading ideas and rhythm in time with the market rhythm, you can pay attention to the bottom notification 🌐 to get more specific operation details and strategy updates. Let us work together to flexibly and steadily pursue more profits in the ever-changing market!

GOLD 4H CHART ROUTE MAP UPDATEHey Everyone,
Please see our 4H chart update, following on from our 1h chart update. Once again, no surprise with our levels playing out to perfection!!
We started the week with both our Bearish 3242 and Bullish 3301 targets hit. This followed with a ema5 cross and lock above 3301 to confirm a continuation into 3370. We got the push up, over 600 pips but just short of the full gap to 3370.
We are now seeing playing between 3301 and 3370, keeping in mind the full gap to 3370 remains open, as long as ema5 remains above 3301.
We will keep the above in mind when taking buys from dips. Our updated levels and weighted levels will allow us to track the movement down and then catch bounces up.
We will continue to buy dips using our support levels taking 20 to 40 pips. As stated before each of our level structures give 20 to 40 pip bounces, which is enough for a nice entry and exit. If you back test the levels we shared every week for the past 24 months, you can see how effectively they were used to trade with or against short/mid term swings and trends.
The swing range give bigger bounces then our weighted levels that's the difference between weighted levels and swing ranges.
BULLISH TARGET
3301 - DONE
EMA5 CROSS AND LOCK ABOVE 3301 WILL OPEN THE FOLLOWING BULLISH TARGETS
3370
EMA5 CROSS AND LOCK ABOVE 3370 WILL OPEN THE FOLLOWING BULLISH TARGET
3429
EMA5 CROSS AND LOCK ABOVE 3429 WILL OPEN THE FOLLOWING BULLISH TARGET
3499
BEARISH TARGETS
3242 - DONE
EMA5 CROSS AND LOCK BELOW 3242 WILL OPEN THE FOLLOWING BEARISH TARGET
3171
EMA5 CROSS AND LOCK BELOW 3171 WILL OPEN THE SWING RANGE
3089
3171
EMA5 CROSS AND LOCK BELOW 3171 WILL OPEN THE SECONDARY SWING RANGE
3089
3001
As always, we will keep you all updated with regular updates throughout the week and how we manage the active ideas and setups. Thank you all for your likes, comments and follows, we really appreciate it!
Mr Gold
GoldViewFX

High-level fluctuations do not change the bullish trendThe 4-hour level shows that the gold price turned to high-level fluctuations after testing the upper track under pressure yesterday. There is still room for upward movement after the structure is completed. The 1-hour moving average system shows a golden cross divergent bullish arrangement, indicating that the short-term upward momentum is sufficient. The gold price continued to rise in the morning and hit a new high. The trend maintains a bull-dominated pattern. Although there was a correction in the US market yesterday, it stopped falling and stabilized at the key support level of 3330-3325 and broke through the previous high, further confirming the short-term strength. Therefore, once it pulls back to the upper area of 3335-3325, it will constitute a dip-buying opportunity. The intraday operation strategy recommends that the pullback be mainly long and the rebound short. The short-term support below focuses on the 3335-3325 range, and the upper short-term resistance level is 3365-3375.
Operation strategy: 1. Gold recommends long pullback near 3335-3325, with a target of 3350-3360.
2. It is recommended to short gold when it rebounds around 3365-3375, with the target at 3350-3340.

Non-agricultural week gold long and short game!From the 4-hour trend of gold, the key position of 3300 is the core basis for judging the short-term trend. The current 4-hour watershed is in the 3300 area. The gains and losses of this position will determine the direction of the short-term trend. Before it breaks through effectively, the short-term pressure judgment is maintained; if it breaks through, it is necessary to turn to the daily resistance level. The MACD indicator crosses and the short-term momentum column continues to increase, indicating that the price has further downward momentum. The price of the 4-hour cycle runs along the downward channel. Although the MACD indicator forms a cross below the zero axis, the short-term energy column shows a shrinking trend. There is a technical oversold rebound demand in the short term.

Gold non-farm payrolls are coming soonThe 4-hour level shows that the gold price turned to high-level fluctuations after testing the upper rail yesterday. There is still room for upward movement after the structure is completed. The 1-hour moving average system shows a golden cross divergent bullish arrangement, indicating that there is sufficient short-term upward momentum. In the morning, the gold price continued to rise and hit a new high for the stage, and the trend maintained a bull-dominated pattern. Although there was a correction in the US market yesterday, it stopped falling and stabilized at the key support level of 3330 and broke through the previous high, further confirming the short-term strength. Therefore, Weng Fuhao believes that once the correction to the upper area of 3335-3330 constitutes a dip opportunity. The intraday operation strategy recommends that the correction is mainly long and the rebound is supplemented by short. The short-term support below focuses on the 3335-3330 range, and the short-term resistance above is 3365-3375.
Gold remains strong, and we continue to buy on pullbacks!ADP employment unexpectedly turned negative, and the probability of a rate cut increased again
The ADP employment report released on the same day showed that the number of private sector jobs in the United States decreased by 33,000 in June, the first net loss since March 2023, and the May data was also significantly revised down to +29,000. After the release of the ADP data, the probability of the Federal Reserve's interest rate cut in July quickly rose from 20% before the data was released to about 27.4%. The market's bet on a rate cut before September has almost been fully factored in, and federal funds futures also show that the possibility of a 50 basis point rate cut has risen to 22%.
This "frown-making" data released a strong signal of cooling in the labor market before Thursday's non-farm report. If today's non-farm continues to be weaker than expected, it may force the Federal Reserve to act faster.
Gold opened high and then retreated continuously. From the daily chart, gold is still in an upward trend in the long term. The previous market rebounded effectively after touching the downward trend line, and the rebound force was considerable. With the restart of the bullish force, the main idea can carry the trend and do more on dips. In addition, from the 4-hour chart, gold has broken through the previous downward trend line and has gone out of the V-shaped reversal pattern, which means that the previous short-term downward trend has ended. At present, a new trend is also opening up in the 4-hour chart. The rise of gold has also established an upward trend line. You can consider buying on dips based on the upward trend line 3332. However, due to insufficient bottoming time in the previous stage, it may still face the risk of decline, so you should set the stop loss with caution. From the 1-hour chart, gold fell after opening high, and the bullish trend remains unchanged. The points for long orders can consider 3334 and 3328.
Gold operation suggestions: Go long on gold near 3325-3335, with a target of 3350-3360.

Gold trend remains bullishThe investment market will not simply move in the expected direction. The road to success is tortuous. Once it goes in the opposite direction, it will lose direction and enter a cycle. The same is true for the market. The trend is certain, but it will never simply move in the predetermined direction. There will be twists and turns during the period that will shake people's hearts. At this time, you need a good attitude to face it and not be affected by the short-term trend. This is why we have been firmly laying out the bands in the early stage, and the reason for successful profits. Only by keeping the original intention can we succeed. The investment market requires concentration and perseverance, and then to reap profits!
At present, the overall rise of gold remains stable. Although the fluctuation has narrowed compared with yesterday, it has not fallen sharply after touching the previous pressure level, indicating that the support below is still effective. Although affected by the ADP data, the technical pattern still maintains a bullish idea. For prudent operations, it is recommended to maintain a low-long strategy and pay attention to the short-term support area near 3333-3328 below. After retreating to this position and stabilizing, you can continue to arrange long orders, and focus on the support area near 3325-3315. If the daily level stabilizes above this position, continue to maintain the bullish rhythm of retreating low and long and following the trend. The upward target looks at the 3355-3360 area. If this area continues to be blocked, consider light positions to arrange short orders, and the target is bearish adjustment. If the market breaks through strongly and stabilizes, it is expected to test the 3370-3380 area. The specific strategy adjustment will be prompted dynamically during the intraday according to the real-time market, and steadily follow the bullish trend to grasp the benefits.

How to make accurate layout during gold volatility?Gold maintained a small range of fluctuations and consolidation rhythm today. In the morning, we arranged long orders at 3330-3331 and successfully exited at 3343. Affected by the ADP data, the gold price broke through 3345 and hit 3351. We also arranged short orders in the 3350-3351 area in time and are still holding positions. The focus of the support below is 3325-3315, which is the key position today. As long as this position is maintained, the long position will rebound and rise. Otherwise, it will fall into the battle for support at 3305-3295. In terms of operation, we continue to step back and do more.
From the current analysis of gold trend, the support below focuses on 3325-3315. The main bullish trend remains unchanged. Focus on the long-short watershed position of 3305-3295. The daily level stabilizes above this position and continues to step back and do more bullish rhythm.

XAUUSD: Eyes $3,800 based on this 2 year pattern.Gold turned neutral again on its 1D technical outlook (RSI = 52.131, MACD = 4.646, ADX = 13.719) as after last week's selling, it recovered yesterday its 1D MA50, restoring the bullish trend. The long term trend has been extremely bullish after all and the past 2 months have simply been a consolidation stage through a Triangle pattern that worked as accumulation for the next bullish wave. On this 2 year pattern, typical waves rose by at least +22.57%. Once the 1D MA50 turns into a support again, we anticipate that a new Channel Up will push Gold to a TP = 3,800.
See how our prior idea has worked out:
## If you like our free content follow our profile to get more daily ideas. ##
## Comments and likes are greatly appreciated. ##

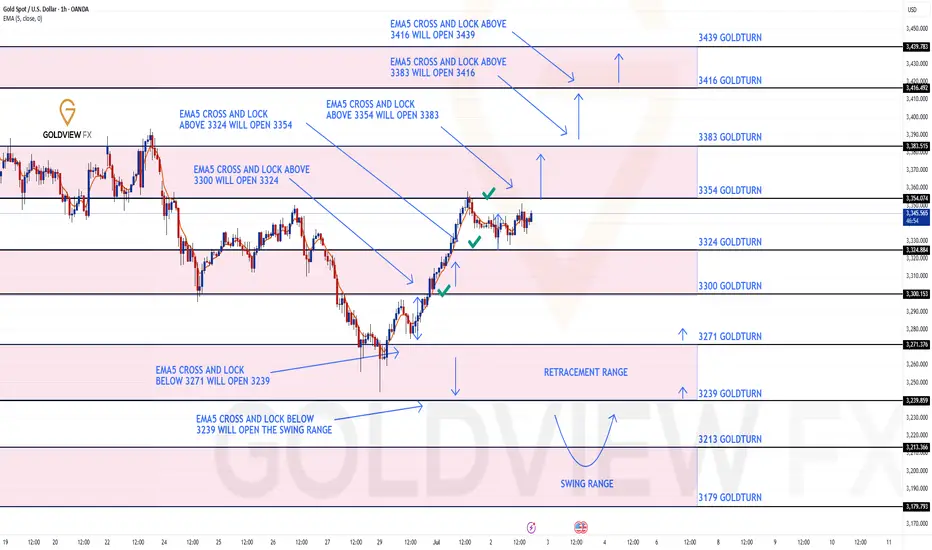
GOLD ROUTE MAP UPDATEHey Everyone,
Once again our chart idea and levels are being respected and playing out to perfection, allowing us to confirm continuations and rejections.
After completing our targets, 3324 and 3354 yesterday, we had no further cross and lock above 3354, confirming the rejection.
We are now seeing price play and consolidate between 3324 and 3354 and will need ema5 cross and lock on either level to confirm our next direction.
We will keep the above in mind when taking buys from dips. Our updated levels and weighted levels will allow us to track the movement down and then catch bounces up.
We will continue to buy dips using our support levels taking 20 to 40 pips. As stated before each of our level structures give 20 to 40 pip bounces, which is enough for a nice entry and exit. If you back test the levels we shared every week for the past 24 months, you can see how effectively they were used to trade with or against short/mid term swings and trends.
The swing range give bigger bounces then our weighted levels that's the difference between weighted levels and swing ranges.
BULLISH TARGET
3300 - DONE
EMA5 CROSS AND LOCK ABOVE 3300 WILL OPEN THE FOLLOWING BULLISH TARGETS
3324 - DONE
EMA5 CROSS AND LOCK ABOVE 3324 WILL OPEN THE FOLLOWING BULLISH TARGET
3354 - DONE
EMA5 CROSS AND LOCK ABOVE 3354 WILL OPEN THE FOLLOWING BULLISH TARGET
3383
BEARISH TARGETS
3271
EMA5 CROSS AND LOCK BELOW 3354 WILL OPEN THE FOLLOWING BEARISH TARGET
3239
EMA5 CROSS AND LOCK BELOW 3239 WILL OPEN THE SWING RANGE
3213
3179
As always, we will keep you all updated with regular updates throughout the week and how we manage the active ideas and setups. Thank you all for your likes, comments and follows, we really appreciate it!
Mr Gold
GoldViewFX
7.2 Technical Analysis of Gold Trading in the US MarketGold fluctuated in the range of 3326-3355 today on Wednesday. The small non-agricultural bullish gold broke through the 3345 line and hit the 3351 line, and then fluctuated back to the current 3342 to adjust the momentum of rising again. If the positive line on Wednesday closed above 3345, it will continue to rise to 3363-3370; if the negative line on the closing fell below the middle track, it will continue to fluctuate and consolidate in this range. The support of 3324 below is the key position tonight; as long as this position is maintained, the bulls will rebound and rise, otherwise they will fall into the battle for support at the 3295-3301 line.
Technical analysis:
From the 4-hour analysis, the support below is around 3324. The main bullish trend remains unchanged after the evening retracement. The important support is 3314-16, and the focus is on the long-short watershed position of 3295-3301. The daily level stabilizes above this position and continues to maintain the rhythm of retracement and bullish trend.

Critical moment! Where will gold go?After rebounding for two consecutive days, gold prices consolidated in a narrow range in the Asian market on Wednesday, hovering below a one-week high. Although the US dollar rebounded slightly and the market's improved risk appetite suppressed safe-haven demand, the Fed's interest rate cut expectations and trade uncertainties limited the downside of gold prices. The market is waiting for the upcoming ADP and non-farm data to determine the timing of the Fed's interest rate cut. The key technical resistance is $3,358.
Gold received a positive cross in June. At present, the monthly line has an upper shadow for three consecutive trading months, and the shadow is long, indicating that the upper selling pressure is relatively large; in this way, for the future market, we are more optimistic about the highs and falls. In the recent stage, gold is not interested in US data, but Trump frequently calls for the Fed to cut interest rates, which we still need to pay attention to. The sharp rise in gold in the past two days is not unrelated to the Fed's expectation of a rate cut. On the other hand, it is also related to the market rumor that the US President Trump's tariff deadline on July 9 is also related. If the US dollar index bottoms out and rebounds, ushering in a phased upward trend; then, it is bound to suppress gold.
Short-term resistance is yesterday's high point 3350-3360 area. If it breaks above, it is expected to hit 3375-80, and further 3400 mark; before breaking above 3400 area, there is still a large sweep range. If it goes up, the bulls will have a wave of acceleration, and the upper 3425 and 3450 may even hit the historical high. For the day, the 5-day moving average 3315 area will form a strong support after breaking through. If it rebounds and rushes higher, it cannot break below. Once it breaks below, the market will continue to fall, further 3300~3295, and then 3275 and 3255~45 areas; that is, the rise on Monday and Tuesday means the end of the bulls. Therefore, in terms of operation, the short-term relies on the 3315-3325 area to support low longs, and if it rises, it will continue to short with reference to the resistance area.

The idea is clear, gold falls as expected!The gold market is just as I predicted. I have repeatedly warned everyone not to chase the 3350-3355 line. The technical side needs to step back. Now, it just proves the idea I gave. After gold hit the highest line of 3358, it stepped back to the 3337 line and started to fluctuate. Our 3355 short order plan successfully touched 3340 to stop profit and exit. From the current gold trend, it should fluctuate like this before closing. After the opening, we will step back and go long as planned. Focus on the 3330-3335 line below. If it does not break, we can consider going long.
From the current gold trend analysis, pay attention to the 3360-3370 line of pressure on the top, and the short-term support on the bottom is around 3330-3335. Focus on the key support at 3315-3325. Relying on this range as a whole, maintain the main tone of low-long participation unchanged, wait for the pullback to confirm the support and then intervene when the opportunity arises. In the middle position, keep watching and do less, chase orders cautiously, and wait for the entry opportunity after the key points are in place.
Gold operation suggestion: go long around 3315-3325, target 3340-3350.
