Grasp the trend accurately and have a crazy weekend!After testing the 3380 support level several times in a row today, gold maintained an oscillating upward trend. Today's layout of 3380 repeatedly went long, and 3400 shorts were all successfully closed with profits, with a total profit of 580pips. Currently, gold is oscillating at a high level in the 3404-3380 range. The possibility of a direction choice cannot be ruled out in the evening. If the market continues to be bullish in the evening, it is necessary to pay attention to whether the price will fall below 3380 when it tests the support level for the third time. If the support level is effectively broken, it is expected to fall to the key support level of 3370. If the price firmly stands above the 3400 mark, it may continue to test 3410. If there is no breakthrough either above or below, it will still maintain a range of oscillations, and the idea of selling high and buying low will be the main focus.
Goldtradingidea

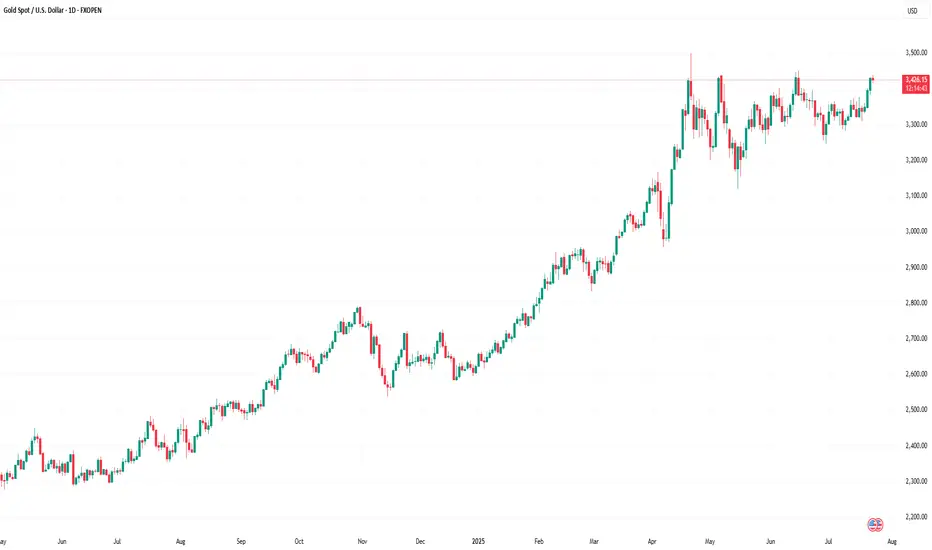
Gold fluctuates repeatedly. How can we avoid detours?Gold currently lacks sustained bullish momentum. The monthly chart has formed four consecutive upper shadows, indicating significant market pressure at high levels. Bulls are hesitant to take risks and lack the appetite for aggressive action, leading to a typical volatile pattern of rapid rises and equally rapid declines in gold prices. Yesterday's price action further confirmed this pattern. Although gold prices briefly reached a new high after bottoming out and rebounding, they were unable to consolidate above that level and subsequently retreated rapidly. Currently, the 3380-3390 area has become a key short-term resistance level, but repeated attempts to retest it have led to heavy selling pressure. Meanwhile, the 3370 area, a trading-intensive zone, poses significant downside risks for gold if it breaks below it, potentially extending the range to 3355-3340. Technically, resistance is concentrated in the 3380-3390 area, while support lies at 3355-3340. Short-term volatility is largely locked within this range. We recommend maintaining a volatile strategy of buying high and selling low.
Regarding trading strategies, we recommend placing short positions in batches within the 3375-3390 area, targeting 3360-3345. Pay attention to position control and stop-loss settings during this process. If the price rebounds to the support area and stabilizes, consider short-term long positions to flexibly respond to the intraday rhythm.
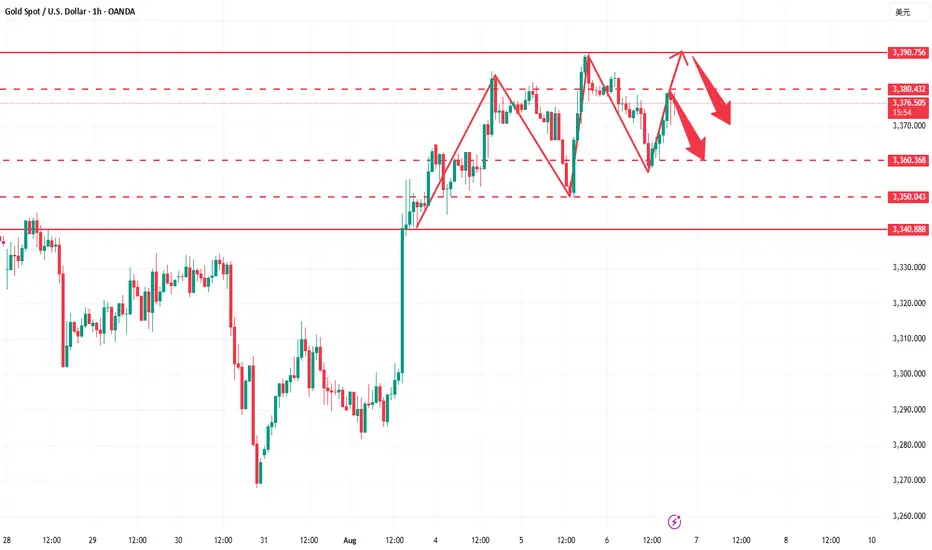
What you see are fluctuations, what I see are opportunities!Gold prices are rising as expected, with long positions perfectly fulfilled and periodic profits successfully secured. Currently, prices are once again encountering resistance at 3390. A clear bearish engulfing pattern has formed on the short-term hourly chart, suggesting weakening short-term momentum and increasing risk of a pullback. From a cyclical perspective, today marks the fifth trading day of gold's rebound, and technically, a periodic adjustment is necessary. A break below 3370 today will essentially confirm the establishment of a short-term top, and the market structure may shift into a phase of decline. Regarding trading recommendations, we recommend continuing to short on rallies around 3390 as a key resistance level, with short-term targets focused on 3370-3360. A subsequent break below this level with significant volume could open up further downside potential. Market sentiment is shifting rapidly at this time, so it is crucial to strictly enforce risk management discipline, avoid blindly chasing orders, and maintain a flexible and forward-looking strategy.

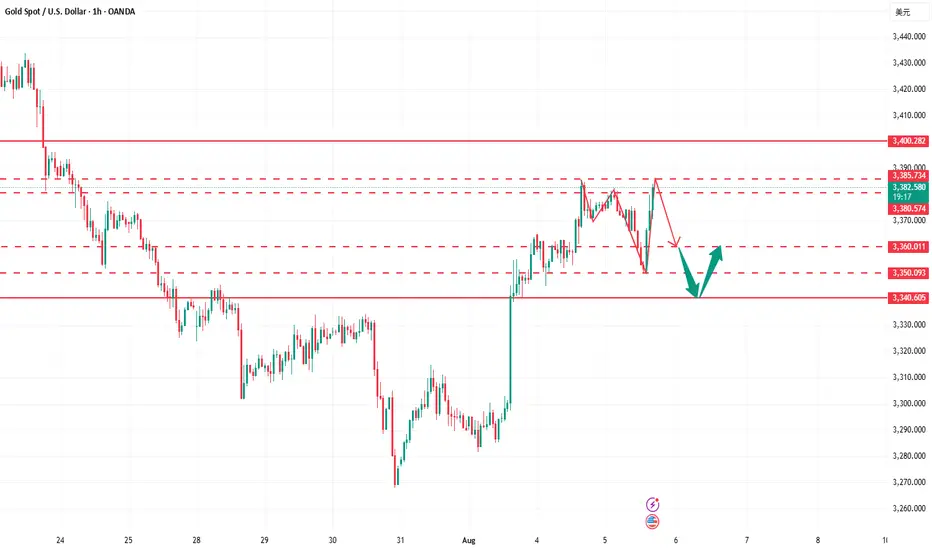
What does it matter if every step is just right?Today's gold fluctuation rhythm is basically consistent with our prediction. The rhythm from entry to profit-taking is clear, and the strategy is executed decisively. First, we decisively arranged long orders at the 3365-3370 line, and successfully took profit at the target line 3375, earning 150pips of profit. Then we decisively reversed and arranged short orders at 3375. The market fell back to around 3360 as expected, and realized 150pips of profit again. In the third round of operations, long orders were entered again near 3352, and the price rose smoothly to 3370 to take profit again. The overall rhythm was tight and profits were steadily pocketed. At present, gold has rebounded to around 3380-3385. We have deployed a new round of short orders in advance and will wait for the price to drop before arranging long orders. Overall, gold is in a volatile rhythm. Even if there is still room for upward movement in the future, it is likely to undergo a round of technical retracement adjustments first.
How to seize the best entry point for gold?Gold continued its bullish trend from last Friday, rising to a high of 3385 yesterday. However, the upward momentum failed to sustain, and new highs were not reached during today's Asian and European trading sessions. The short-term bullish trend has ended, and the market is showing signs of correction. Currently, gold is facing downward pressure in the short term, and the short-term trend is volatile. Strategically, we can watch for a rebound to the 3375-3385 area during the European trading session and try to participate in short-term short selling. The target is below 3365-3355. The long-term structure remains bullish. Therefore, if the price falls back to the 3355-3340 area and stabilizes, we can still consider entering long positions to continue the medium-term uptrend. In terms of trading, we should pay attention to the rhythm of the market, betting on rebound resistance with short-term short positions and then going long on dips, maintaining flexibility.

Gold CFD Trading: Practical Steps and Influencing Factors Gold CFD Trading: Practical Steps and Influencing Factors
Gold trading in forex offers a dynamic and potentially rewarding opportunity for traders. This article delves into the essentials of trading gold, from understanding its unique position as both a commodity and a financial asset to its price determinants and how to trade it.
Understanding Gold as a Trading Asset
In international gold trading, gold's role extends beyond being just a precious metal; it is a unique asset class. Its intrinsic value and universal appeal have made gold a cornerstone in financial markets for centuries. Unlike many other commodities, gold maintains its value not just in times of economic stability but also during volatility. This dual nature arises from its status as both a tangible commodity and a symbol of wealth, leading to its classification as a so-called safe-haven asset.
Investors often turn to gold when currencies and other markets face instability. Additionally, gold's relatively limited supply, juxtaposed with its consistent demand across industries and jewellery markets, ensures its lasting relevance in the trading world. Understanding these characteristics of gold is crucial for forex traders, as they form the foundation of its behaviour and pricing in the financial markets.
Fundamentals of Gold Trading
For those looking to learn to trade gold, it's essential to grasp the basics of how gold is traded. Primarily, gold trading is conducted through Contracts for Difference (CFDs), a popular derivative that allows traders to speculate on its price movements without owning the physical metal.
CFDs offer a flexible way to engage in gold trading, providing the ability to trade both rising and falling markets. This versatility is often cited as the best way to trade gold, especially for those who prefer short-term positions. Unlike gold stock trading, where investors buy shares in gold-related companies, gold CFD trading focuses directly on the price movements of the metal itself.
Via CFDs, gold is typically traded against the US dollar, denoted as XAU/USD. Here, XAU represents one troy ounce of gold, a standard unit of measurement in the precious metals market. Traders analyse market trends and use leverage to potentially enhance their opportunities. However, leverage is a double-edged sword, potentially magnifying losses.
Factors Influencing Gold Prices
Understanding the factors that influence gold prices is critical for anyone engaged in trading this precious metal. Here are key elements that traders usually monitor:
1. Economic Indicators: Key economic data such as GDP growth rates, employment figures, and inflation reports can significantly impact prices. Typically, weak economic performance or high inflation rates increase gold's appeal as a hedge against currency devaluation.
2. Monetary Policy: Central banks' decisions on interest rates and quantitative easing play a major role. Lower interest rates can decrease the opportunity cost of holding non-yielding assets like gold, thus boosting its demand.
3. Currency Strength: The strength of the US dollar is inversely related to gold prices. As gold is paired with the US dollar, rising USD will make gold cheaper.
4. Geopolitical Events: Political uncertainties and global crises often drive investors towards gold as a so-called safe-haven asset. Events causing economic instability can lead to a surge in prices.
5. Market Demand: Demand from industries like technology and jewellery and investment demand significantly influence prices.
6. Gold Trading News: News and reports related to mining, supply constraints, or large market transactions can immediately affect prices.
How to Trade Gold
Trading gold effectively requires a combination of well-chosen strategies, relevant indicators, and insights from trading signals. A comprehensive gold trading tutorial is a great starting point for understanding the mechanics of the market.
One of the best strategies to trade gold is following the trend. This involves identifying the direction of the market trend and making trades in alignment with this trend. For instance, if gold is on an upward trend, a trader might take a long position, and vice versa for a downward trend.
Regarding the best indicators for gold trading, traders often rely on tools like Moving Averages to identify trends, the Relative Strength Index (RSI) for overbought or oversold conditions, and MACD for momentum and trend changes.
Additionally, utilising gold trading signals can be effective. These signals, provided by market analysts or automated systems, offer assumptions on when to enter or exit trades based on market analysis. However, traders usually use these signals as a guide rather than a definitive command, combining them with their own research and risk management strategies.
Practical Steps for Gold Trading
Starting your journey in gold trading can be both exciting and challenging. Here are some practical steps to help you navigate this market:
- Educate Yourself: Before diving in, invest time in understanding the gold market. You can read books, watch webinars, and follow gold trading tutorials.
- Start Small: Begin with smaller investments to limit risk as you learn the ropes.
- Use Demo Accounts: Practice with demo accounts to gain experience without financial risk.
- Keep Up with News: Stay updated with global economic news, as they can significantly impact prices.
- Risk Management: Always use stop-loss orders to minimise potential losses.
- Review and Learn: Regularly review your trades to learn from successes and mistakes.
The Bottom Line
Embarking on your gold trading journey can be a transformative experience. With the knowledge and strategies outlined in this article, you can be well-equipped to navigate the market. Happy trading!
This article represents the opinion of the Companies operating under the FXOpen brand only. It is not to be construed as an offer, solicitation, or recommendation with respect to products and services provided by the Companies operating under the FXOpen brand, nor is it to be considered financial advice.
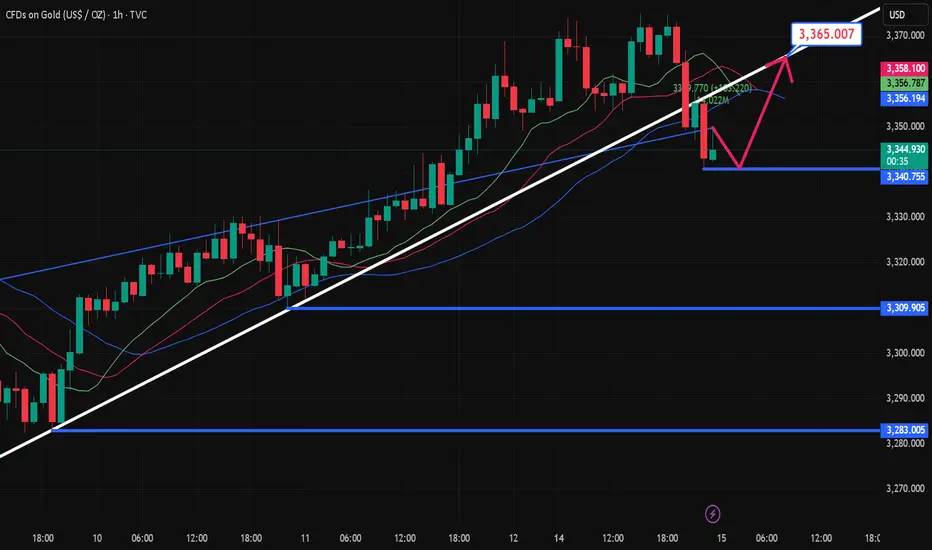
Buy first when gold falls back, and pay attention to the strengtGold went on a roller coaster ride last week. It rose to around 3377 at the beginning of the week and then fell back under pressure. After stabilizing near 3309 on Thursday, it strengthened again on Friday and came under pressure near 3361. It fell back slightly to around 3344 at the opening in the morning and is currently rising again. In the morning, pay attention to the opportunity to buy first after the pullback, pay attention to the strength of the European session, and pay attention to the pressure near 3378/80 on the upside.

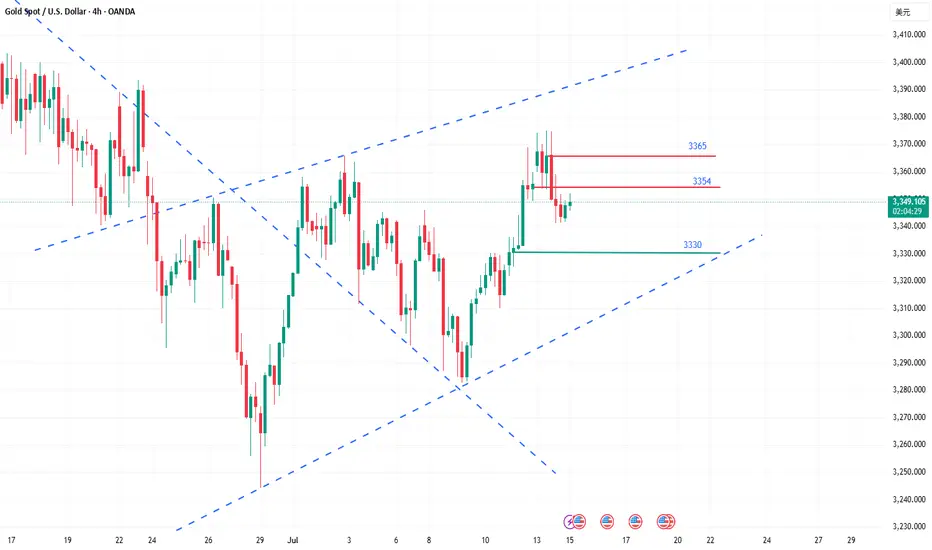
How to grasp the key trading points of gold?Yesterday, gold tested the 3375 line several times but failed to break through effectively. The selling pressure on the market was obvious, and the price immediately fell back, reaching a low of around 3341. The daily line closed with a long upper shadow, indicating that the bullish momentum has weakened and the short-term market has entered an adjustment phase. From the perspective of the 4-hour cycle, the continuous negative trend has led to the gradual closing of the Bollinger Bands, and the middle track position has temporarily gained support, but the overall market is volatile and weak. Today, we will focus on the 3354 watershed. If the rebound fails to effectively stand at this position, the pressure on the upper side will still be strong, and there is a risk of a short-term decline.
Key technical positions: upper resistance: 3365, 3354, lower support: 3340, 3330. In terms of operation rhythm, it is recommended to deal with it with a high-selling and low-buying, oscillating approach, and maintain flexible adjustments.
The operation suggestions are as follows: You can choose to short in the 3360-3365 area, with the target around 3350 and 3340; if the rebound is blocked below 3354, you can also enter the short order in advance. It is recommended to enter and exit quickly in the short-term weak market; strictly control the stop loss to avoid risks caused by sudden changes in the market.
The current market is obviously volatile, so don't blindly chase the rise and fall. It is particularly important to operate around the key pressure and support areas. The grasp of the rhythm will determine the final profit, and steady trading is the kingly way.
7.15 Gold Market Analysis and Operation SuggestionsFrom the 4-hour analysis, the short-term support below focuses on the neckline of the hourly line of last Friday, 3340-45, and focuses on the support of 3325-30. The intraday retracement continues to follow the trend and the main bullish trend remains unchanged. The short-term bullish strong dividing line focuses on the 3325 mark. The daily level stabilizes above this position and continues to follow the trend and bullish rhythm. Before falling below this position, continue to follow the trend and follow the trend. Maintain the main tone of participation.
Gold operation strategy:
1. Go long when gold falls back to 3340-45, and add more when it falls back to 3325-30, stop loss 3317, target 3365-70, and continue to hold if it breaks;
Gold rises strongly, aiming for a new high!Last Friday, gold continued to rise strongly, breaking through 3320 in the Asia-Europe session and accelerating its rise. The European session broke through the 3340 mark continuously. The US session broke through 3369 and then fell back. The daily line closed with a big positive line. It broke through the high for three consecutive days and returned to above 3360. The unilateral bullish pattern was re-established. Today, the gold price jumped high and broke through 3370 and then fluctuated at a high level. Although it rushed up, the strength was limited. It must be adjusted after a short-term retracement before it can continue to rise. Therefore, in terms of operation, we continue to maintain the main idea of retreating and multiplying. Pay attention to the 3340-3345 area for short-term support during the day, and look at the 3330 line for strong support. If it does not break, it will continue to be a good opportunity to buy low and do more. Taking advantage of the trend is still the current main tone. As long as the daily level does not break 3330, the bullish structure will not be destroyed.
🔹Support focus: 3340-3345, key support level 3330
🔹Resistance focus: 3380-3393 area
1️⃣ If the price falls back to 3340-3350, a light long position will be intervened, with the target of 3365-3370. A strong breakthrough can see a new high;
2️⃣ If the price rises to 3380-3393 and is under pressure, a short-term short position adjustment can be tried, with a short-term target of around 3360.
The specific real-time points and position arrangements will be updated at the bottom. Interested friends are advised to pay attention to my strategy tips in a timely manner and seize every opportunity reasonably.
Where will gold prices go at the weekly close?The mentality of trading is very important. At the same time, you must have clear ideas and decisive actions. Gold has been in a state of rapid growth. Many people are easily led to big losses by a small mistake. If you are worried about the loss at this time, you can choose to observe our daily operations in the group. The operations in the group are reasonable and well-founded, with real-time current price orders, and the returns are also considerable. Everyone is welcome to come and verify.
Gold risk aversion has driven gold to strengthen. The current bullish trend of gold is strong. The decline during the US trading session is still dominated by long positions. Technically, the 1-hour moving average forms a golden cross upward, indicating sufficient bullish momentum. After the gold price breaks through, it is confirmed that the support level of 3330 is effective, and the short-term support structure has been formed. It is recommended to wait for the second opportunity for the gold price to step back! Although the 1-hour chart shows that the current trend remains strong and the step-back amplitude is small, it is necessary to maintain a cautious attitude-even if the market is strong, it is not recommended to chase more, and it is necessary to guard against the risk of a deep correction in the gold price. In terms of operation, it is reminded that you can focus on the support level below: the first support level is 3345 (bull-bear watershed). If it falls below, pay attention to the key support of 3330. If the gold price falls back to around 3345 and stabilizes, you can consider a light position to try more.

Although the bulls are strong, don't chase them at high levelsGold trend analysis:
The market is fluctuating repeatedly now, and it is possible to rise or fall, but under the bullish trend, the main force is still rising. Therefore, this week's trading is to fall back and do more at a low price. Whether it is the previous 3285, 3306, or 3315, there are good profits. Although it is temporarily unable to break out of the bullish volume, at least the trend remains unchanged, and there will definitely be a large upward space in the future. Today is Friday, and we still pay attention to the possibility of bullish volume. This week, we have been emphasizing that if it rises during the week, we will see the 3370 high point. If 3370 breaks, there are still 3380 and 3400 above. On Friday, we will see whether this idea is realized.
From a technical point of view, there was a sharp pull this morning, with the big sun breaking through the upper track of the downward channel 3326 in the above figure, and then stepping back to confirm stabilization and bottoming out, which means that the breakthrough is effective, so you can directly follow the bullish trend in the morning, and during the European session, it repeatedly went up and down around the 3345-3332 range. With the experience of yesterday's trend, today we have been waiting for it to approach the 10-day moving average and then continue to be bullish on dips, and the entry point is basically good; currently it has broken through the resistance level of 3345 in the European session, so it depends on whether it can stand directly on it tonight. Once it stands, it can gradually rush to 3370, and the second is 3374, etc.; Of course, if it just pierces but does not stabilize, it will continue to spiral slowly upward around the yellow channel in the figure, so continue to wait patiently for the 10-day moving average, which is also the lower track position to grasp the low and long; Therefore, tonight gold 3345-3333 continues to rise on dips, with 3330 top and bottom positions as nodes, resistance at 3370, further resistance at 3374, etc.; If there is an unexpected big negative inducement to empty the market like yesterday, pay attention to stabilization above 3320 and still bullish;
Gold operation strategy: It is recommended to go long when it falls back to 3333-3345, and the target is 3360-3370.

Try shorting once below 3355!The market closed at 3326 on Thursday and still failed to break through the small range of long and short positions. The overall market is in a strong bullish trend and this trend indicates the possibility of a breakout in the future. In this week's trading example, after confirming that the 3315 low support is effective, a short-term long operation was successfully carried out below the area and profited. The picture and truth can be checked in the article on Thursday. In the short term, continue to pay attention to the range shock and pay close attention to the breakthrough direction of key points. The first thing to pay attention to is the strong pressure of 3355. If it breaks through and stands firmly at this position, it will open up further upward space, and the potential target can be seen in the 3365 or even 3400 area. On the contrary, if the gold price is always under pressure below 3355, the market is likely to continue the current shock and consolidation rhythm. Therefore, breaking through the 3355 mark will be a key signal to judge whether the market can release significant upward momentum in the future. Before the effective breakthrough, continue to intervene in the low-long opportunity at the 3325-15 support level of the shock range. On the upper side, you can arrange short positions at 3345-3455.

How to seize gold trading opportunitiesNews:
On Friday (July 11) in the Asian time zone, US President Trump posted a "tariff change" on social media, announcing that a 35% tariff would be imposed on all Canadian goods from August 1, a 10 percentage point increase from the current rate. This decision was like a thunderbolt, instantly igniting the market's risk aversion sentiment, and the spot gold price soared, reaching a high of $3,344 per ounce during the session. Although Trump extended the tariff agreement to August 1, which once suppressed the gold price, he subsequently stated that it would not be extended after the expiration, and launched further tariff attacks after the expiration, announcing a new 50% tariff on copper imports from the United States and a 50% tariff on goods from Brazil, which increased concerns about tariff risks and pushed the gold price to rebound from the bottom;
Gold trend analysis:
The market is fluctuating repeatedly now, and it is possible to rise or fall, but under the bullish trend, the main force is still rising. Therefore, this week's trading is to fall back and do more at a low price. Whether it is the previous 3285, 3304, or 3317, there are good profits. Although it is temporarily unable to break out of the bullish volume, at least the trend remains unchanged, and there will definitely be a large upward space in the future. Today is Friday, and we still pay attention to the possibility of bullish volume. This Monday has been emphasizing that if it rises during the week, it will look at the 3345 high point. If 3345 breaks, there are still 3365 and 3400 above. Friday will see whether this idea is realized.
From a technical point of view, all cycles are obviously bullish now. The daily line bottomed out on Tuesday, and Wednesday and Thursday were all small broken Yang rising. If it continues, we will first see whether the daily Bollinger middle rail 3345 pressure is broken. After the break, the big Yang closes high. This wave of rise may reach 3400. Therefore, the daily cycle has a lot of room for growth and should not be taken lightly. The H4 cycle needs to see whether today's rise can break 3345, because if it breaks 3345, there is a possibility of the upper rail opening. After the upper rail opens, gold will have a unilateral trend. Therefore, today's bullish target is 3345. If 3345 is not broken, there is still a possibility of a decline. If 3345 breaks, there will be 3365 and 3400 above. Here, it is clearly bullish and optimistic about the break of 3345. After determining the direction, the trading idea on Friday is also clear. It must be mainly long on the decline. The support below is 3320-3310. Don't chase more in the European session. Trade again if there is a decline.
Gold operation strategy: It is recommended to go long if it falls back to around 3315-3325, with the target at 3335-3345; it is recommended to consider shorting if it touches 3345 but does not break, with the target at 3335-3325.

Gold has a big win this dayNews: In the early Asian session on Thursday (July 10), spot gold fluctuated slightly higher, once regaining the 3320 mark, and is currently trading around $3323/ounce. On Wednesday, gold prices rebounded strongly after hitting a two-week low of 3282.61, closing at $3313.38/ounce, showing strong momentum for recovery. Trump extended the tariff agreement to August 1 and began to collect tariffs again. Although it eased market tensions, his remarks will not be extended after the expiration, and he issued tariff threats, which increased global trade uncertainty and pushed up risk aversion. The market is still facing economic and inflation concerns brought about by tariffs, which will also weaken the dollar and support gold prices.
Analysis of gold trend: After the full-day trend of gold on Wednesday, the lowest price was 3282 and the highest price was 3322, with a range of $40, so the bullish strength has come out. However, Li Siyu would like to emphasize here that gold is in a bullish trend for the time being, but it is not an absolute unilateral trend, but a fluctuating trend under the bullish trend. There are opportunities both up and down on Thursday. If it rises, you can look at 3345, and if it falls, you can look at 3285. Therefore, before there is an absolute strong unilateral rise, it is recommended that everyone keep looking at this wave of gold fluctuations. However, today's market is more important. Today is Thursday, and Thursday is often the node of the weekly change time. Today is likely to continue the rebound on Wednesday and continue to rise.
From a technical point of view, the daily line closed positive under the rebound of 3282 and stood firmly above the lower Bollinger track. If it continues to close positive on Thursday, it is necessary to pay attention to the suppression of the middle Bollinger track, that is, the high point of 3345. After breaking through, there will be another wave of rise on Friday, and you can see 3365 and 3400. Therefore, today's gains and losses of 3345 are crucial. The strong rebound in the H4 cycle is quite obvious. When it falls, it is very weak and continuous. When it rises, it is very strong and continuous. It depends on whether the continuous positive trend on Thursday will continue. Now the K-line stands firmly on the middle track of Bollinger. If it continues to rise, the high point of the upper track is around 3340-3345. In principle, the continuation of the long position will test the high point of the upper track. Therefore, it is still possible to go long today. Of course, it is not an absolute long trend now, so don't chase the rise. The support below the small cycle is around 3310-3300. If it falls back to this price, you can continue to go long. Clearly define the target. Today, we will see the gains and losses of 3345.

Gold lures shorts, mainly depending on the rebound.On Monday, the gold market rebounded. The root cause was that Trump sent tariff letters to 14 countries at one time. Even allies such as Japan and South Korea were not spared and were subject to high tariffs of 25% to 40%. This "extreme pressure" trade method instantly ignited the market's risk aversion sentiment. Funds poured into gold, pushing up gold prices. The market quickly saw through the "routine". On Tuesday, Trump extended the tariff deadline from July 9 to August 1. This delay was seen as a signal of "surrendering" under trade pressure, and trade tensions were eased. The safe-haven demand dissipated like a receding tide, and gold was sold off violently, plummeting by $35 in a single day, a drop of more than 1%, and the lowest fell to $3,287.2 per ounce.
On Tuesday, the price of gold showed a trend of rising and falling. It reached a high of 3245 in the morning and then gradually fell. It fell to 3287 and then stopped falling and rebounded. As it failed to break through the key resistance level of 3345 and the price continued to be unable to stand firm on the middle track, the bulls' rebound momentum was insufficient. Yesterday's daily line closed with a large Yin line in the engulfing pattern. This K-line combination indicates that the gold price may continue to fall today. The focus below is on the support strength near the lower track 3280. The upper resistance level needs to pay attention to the 3320-3330 range. Today's daily closing is crucial. If the real big Yin line continues to close, it may drive the Bollinger Band to open downward and further open up the downward space; if the closing can stand above 3330, the short-term downward trend may end and the market is expected to restart the rise. From the weekly perspective, the gold price showed an obvious oscillation pattern this week. After rising on Monday, it fell back on Tuesday. The bulls and bears fought fiercely but failed to gain a decisive advantage. Although the current market is weak, the price is close to the important support area. In terms of operations, it is recommended that under the premise of controlling risks, you can now pay attention to the opportunities to buy on dips in the 3295-3285 area.

Seize the correction: It’s the right time to short goldThe current rebound is only a technical adjustment rather than a trend reversal. The rebound in the falling market is a good opportunity to arrange short orders. The hourly chart shows that the moving average pressure continues to move down to around 3340-3345. This position also serves as the long-short watershed in the previous intensive trading area, forming a key resistance barrier. If the gold price rebounds and approaches the area below 3345 and a stagflation signal appears or a top structure is formed, it can be regarded as a clear short signal. It is recommended to enter the market to seize the downward space. The current market direction is clear, and the exhaustion of the rebound is the best time to enter the market. Relying on the technical pressure level, the short position can be accurately arranged.

Gold fluctuates repeatedly, how to seize the opportunityIf the direction is right, you are not afraid of the long journey. Use time to witness your strength, use your strength to win the future, let trust become profit, and use profit to resolve doubts. The market is changing rapidly, and going with the trend is the kingly way. When the trend comes, just do it, don't go against the trend to buy at the bottom, so as not to suffer. Remember not to act on impulse when trading. The market is good for all kinds of dissatisfaction, so you must not hold orders. I believe many people have experienced this. The more you resist, the more panic you will feel, and the floating losses will continue to magnify, making you eat and sleep poorly, and you will miss many opportunities in vain. If you also have these troubles, then you might as well follow my pace and try to see if it can make you suddenly enlightened.
Gold is concerned about the short-term pressure of the 3316 line above, and focuses on the pressure of the 3325 line. If the pressure above the 3325 line is not broken, then the possibility of gold further breaking through the lower space to 3295-3300 in the short term will also increase significantly. Therefore, the main line of gold operation is still based on holding shorts and rebounding shorts. Gold can rebound to the 3316 line and 3325 line before considering participating in short shorts. In terms of operation, we first pay attention to the support of the 3295-3300 line. If the lower support is broken today, the market will reverse to the short side. Otherwise, we will continue to rebound from the bottom and look for opportunities to go long.
From the current trend of gold, pay attention to the support of the 3300-3295 line below, the short-term resistance above pays attention to the vicinity of 3316, and focus on the suppression of the line near 3325. The overall main tone of high-altitude low-multiple cycle participation remains unchanged. In the mid-line position, keep watching and do less, follow orders cautiously, keep the main tone of participating in the trend, and patiently wait for key points to participate.
Gold operation strategy:
1. Go long on gold around 3330-3295, target 3315-3320.
2. Go short on gold around 3315-3325, target 3305-3300.

Firmly bearish below 3350 once again verifies the perfect idea!Gold price rose rapidly at the opening, reaching a high of 3342 before falling back. This kind of rapid pull needs special attention, because from the perspective of short-term trading, this is the trend pattern that needs the most vigilance. Looking back at the trend last Thursday, there was also a situation where the high could not be continued. Historical data shows that this kind of pull-up often lacks sustained momentum, and the subsequent upward space is limited. Combined with the recent trend, although the price rebounded on Monday and Tuesday, it basically maintained a volatile pattern in the following trading days, but the fluctuation range changed. Therefore, the market expects the trend to be repeated in stages, and the information of long and short interweaving makes it difficult for the market trend to continue. Today, the short position digested the second time at the opening and currently stepped back to the lowest 3305 line. In terms of operation, we first pay attention to the situation of 3303-3293. If the support below is broken today, then the market will reverse to the short position. Otherwise, we will continue to rebound from the bottom and look for opportunities to do more.
From the current gold trend analysis, the support line of 3303-3293 is concerned below, the short-term resistance above is concerned about 3325-3330, and the suppression line of 3345-50 is focused on. The overall main tone of high-altitude low-multiple cycle participation remains unchanged. In the mid-line position, keep watching and do less, follow orders cautiously, and wait for the opportunity to enter the market after the key points are in place.
Gold operation strategy:
1. Go long near 3293-3303 for gold, and the target is 3315-3320.
2. Go short near 3320-3330 for gold, and the target is 3310-3300.

Gold continues to fluctuate, where will it go next week?Fundamental analysis:
With the Trump administration's massive tax cut and spending bill officially implemented, the U.S. Treasury may start a "supply flood" of short-term Treasury bonds to make up for the trillions of dollars in fiscal deficits in the future. The market has begun to respond to future supply pressures. Concerns about the oversupply of short-term Treasury bonds have been directly reflected in prices - the yield on 1-month short-term Treasury bonds has risen significantly since Monday this week. A closer look at non-agricultural new jobs exceeded expectations, but nearly half came from government departments, which is likely to reverse in July. Slowing wage growth, declining total working hours, stagnant wage income growth, and worrying consumer spending are all signs of support for gold.
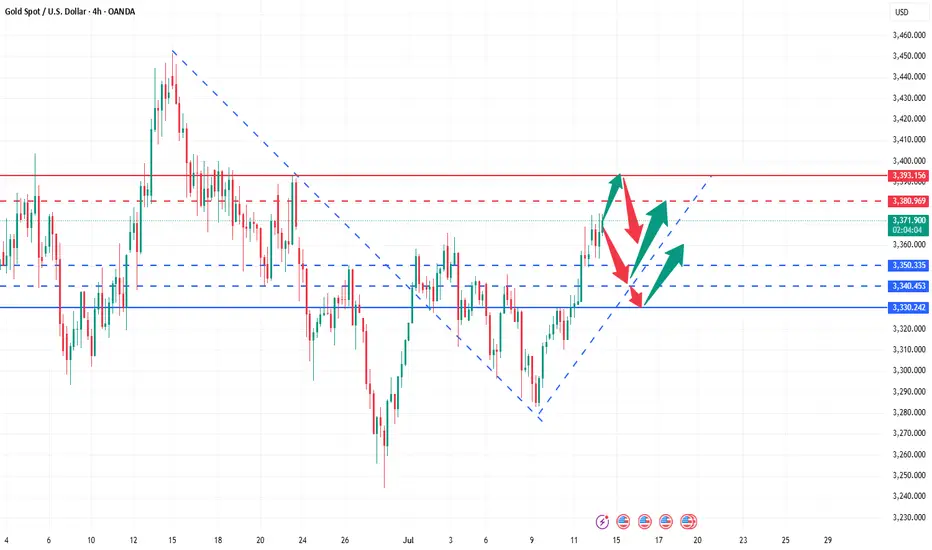
Gold bottomed out and rose from the low of 3245 this week, and then soared all the way to 3365. Finally, the weekly line closed with a positive line with an upper shadow. From the overall trend, after the data is digested, next week will still be treated with a volatile mindset. The large range will focus on the 3280-3393 area. If it does not break, it will still be mainly a sweeping operation. On the daily line, it also closed with a positive line with a long upper shadow, and closed firmly above 3323. It repeatedly tested the pressure of 3345 and did not break and fell back. The structure still maintained an oscillation rhythm within a small range. From the 4-hour cycle, the Bollinger Bands closed significantly. If it opens normally next week, pay attention to the 3325-3315 and 3311 areas when it falls back to support, and pay attention to the 3357 and 3365 positions when it hits the high pressure. It is recommended to maintain the strategy of selling high and buying low in operation and respond to the trend.For more specific operational details and strategy updates, please pay attention to the notifications at the bottom 🌐 and follow them in time.

Gold fluctuates frequently, how to seize the opportunity?We started high-altitude layout from 3365. We took the lead in seizing this wave of decline opportunities and firmly held the bearish view. We harvested short orders all the way to 3325. The gold short orders were continuously stopped at profit, and the rhythm was very steady. The current market fluctuated repeatedly and the direction was chaotic, but we always insisted on executing the strategy - do it when you see it, and you can reap good rewards if you can hold it. Although there is support and resistance at the 3333 line in the short term, it is not recommended to chase more. The risk is relatively large. The key is to step back more. Wait for the 3325-3315 area to consider laying out long orders. We do not do dead shorts, nor do we blindly do more. We always maintain flexible response and rational judgment on the market.
From the current trend of gold, pay attention to the short-term support of 3325-3320 below, focus on the support position of 3315-3310, and pay attention to the short-term resistance around 3345-3350 above. The overall main tone of high-altitude low-multiple cycle participation remains unchanged. In the mid-line position, keep watching and do less, chase orders cautiously, and wait for the opportunity to enter the market after the key points are in place. For more specific operational details and strategy updates, please pay attention to the notification at the bottom 🌐 and pay attention in time.
Gold operation suggestions:
1. Go long near 3325-3315, target 3335-3345.
2. Go short near 3340-3350, target 3330-3320.

Gold fluctuates near the resistance point, and the short positioSpot gold rose slightly in the European session on Friday (July 4), currently trading around $3,333/oz, up about 0.37%, and is expected to record a considerable increase of nearly 2% on a weekly basis. Behind this wave of gold price increases is the smooth passage of the massive tax cut and spending bill promoted by US President Trump in Congress, which has caused market concerns about the US fiscal situation. At the same time, the continued weakness of the US dollar index has further helped the rise in gold prices. As a traditional safe-haven asset, gold continues to be supported by bargain hunting.
Despite the continued rise in gold prices, physical gold demand in major Asian markets has been sluggish. Due to high prices, consumer purchasing interest has significantly weakened. In India in particular, the reduction in gold imports has led to a narrowing of the market discount. The weak demand in the Asian market is in sharp contrast to the risk aversion in the global financial market, highlighting the complexity of the current gold market. On the whole, fiscal concerns caused by the US tax cut bill, the weakening of the US dollar and the potential impact of Trump's tariff policy are jointly driving the upward trend of gold prices. The attractiveness of gold as a safe-haven asset is increasing, especially against the backdrop of increasing global economic uncertainty. In the future, as tariff policies are gradually implemented and the Federal Reserve's monetary policy becomes clearer, the gold market may have more opportunities to rise.
.

Maintain range fluctuations during the day?Gold has maintained a volatile pattern recently. As the US market is closed today for Independence Day, the market volatility is expected to be limited, but the volatile market will continue, but the volatility range may change. Yesterday's gold price fell mainly due to the news, and this decline usually does not last too long. From a technical point of view, gold prices are supported near 3310-3300, which is the key support level today. It is worth noting that on Wednesday, gold prices were under pressure in the 3340-3350 area, and on Thursday, prices formed support in this range, indicating that the area is forming a top-bottom conversion. Therefore, 3340-3350 has become an important pressure level today. It is expected to fluctuate in the 3300-3340/3350 range during the day. The impact of news on gold prices is usually short-term. When the fundamentals and technical directions are consistent, price fluctuations will be more obvious. When the two are inconsistent, price fluctuations will weaken, but will not change the technical trend. The rebound pattern established at the beginning of the week is still valid. After a short-term shock, gold prices are expected to re-stand above 3345 and continue to maintain the rebound trend.
