GOLD break under support trend line 📉This BOS can signal a move towards 1820, and potentially 1785 & 1760.
Goldtradingsetup

Gold Trading Plan - 10/Feb/2023Hello Traders,
Hope you all are doing good!!
I expect Gold to go Up after finishing this correction.
Look for your BUY setups.
Please follow me and like if you agree or this idea helps you out in your trading plan.
Disclaimer: This is just an idea. Please do your own analysis before opening a position. Always use SL & proper risk management.
Market can evolve anytime, hence, always do your analysis and learn trade management before following any idea.

gold channel moveprice action is beautiful both channel move is following accordingly if descending channel move continue will see again in 1865 zone

GOLD XAUUSD - Where now?Hi everyone,
We saw the reaction off the completed WXY highlighted last week (linked idea below) play out perfectly and the larger three wave corrective structure now also looks complete above the 1860 level.
My plan is to target the price inefficiency highlighted in the red boxes whilst monitoring how the forthcoming wave structure develops. Expecting initial resistance at the 1900 level.
A bullish five wave structure will likely lead gold higher beyond 1960, completing the impulsive move which began in September 2022. Will update how that plays out accordingly.
Trade safe.
BeyondEdge

2 Key Reasons Gold Keep RisingThere are two assets being the best hedge against inflation, they are stocks and commodities, especially the precious metals.
How are they performing so far? Who is the real winner and how about if inflation persists, between stock & precious metals who will perform better in the near and further future, and why?
Content:
• Their performance in the last: (who is the winner?)
i. 50 years
ii. 20 years and
iii. 3 years
• Market outlook if inflation persisted
• 2 key reasons for gold keep rising
Gold as an inflation hedge has cast a lot of doubts. I hope today’s presentation has given you a better appreciation about Gold.
2 key reasons for gold keep rising
• 1st Key - Easy money policy produces inflation - We all know by now printing money will cause inflation
• 2nd Key – Gold is a currency hedge
Some argue that with higher interest rates to come, Gold may face greater headwinds ahead because of a stronger dollar, we will discuss Gold as a currency hedge next week.
CME Micro Gold Futures
Minimum fluctuation
0.1 = $1
1 = $10
10 = $100
100 = $1,000
Disclaimer:
• What presented here is not a recommendation, please consult your licensed broker.
• Our mission is to create lateral thinking skills for every investor and trader, knowing when to take a calculated risk with market uncertainty and a bolder risk when opportunity arises.
CME Real-time Market Data help identify trading set-ups in real-time and express my market views. If you have futures in your trading portfolio, you can check out on CME Group data plans available that suit your trading needs www.tradingview.com

XAUUSD top-down analysis,UPDATEDHello traders, this is a complete multiple timeframe analysis of this pair. We see could find significant trading opportunities as per analysis upon price action confirmation we may take this trade. Smash the like button if you find value in this analysis and drop a comment if you have any questions or let me know which pair to cover in my next analysis.

XAUUSD top-down analysisHello traders, this is a complete multiple timeframe analysis of this pair. We see could find significant trading opportunities as per analysis upon price action confirmation we may take this trade. Smash the like button if you find value in this analysis and drop a comment if you have any questions or let me know which pair to cover in my next analysis.

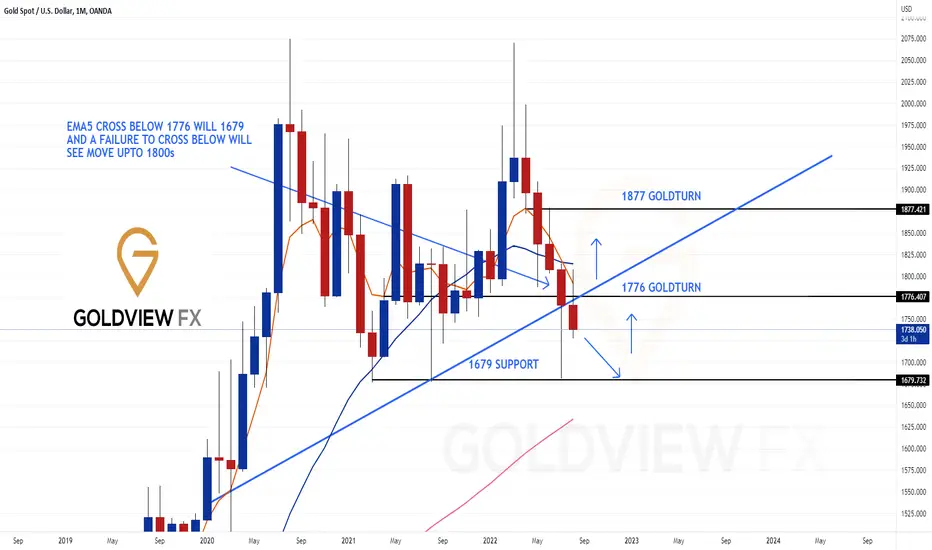
GoldViewFX - MONTHLY CHART TARGETSHey Everyone,
Please see updated monthly chart setup.
The next few days is crucial before month end to see where we finish off on the monthly candle.
EMA5 cross and lock below 1776 will open 1679, even just a candle body close this month below this level will still strengthen the chances of 1679 challenge. In fact the EMA5 cross and lock below 1776 on the monthly chart can actually create enough momentum to break below 1679. Failure to cross with a new Goldturn just above this level will open the full recovery into high 1800s.
Although last weeks movement due to JHS has skewed the data somewhat, with most charts looking Bearish in the short term, we need to keep in mind the long term trend is still intact and our long term Bullish stance is still in play.
Trading level to level on the shorter timeframes keeps us out of trouble and allows us to trade the range safely without committing to anything long term in these volatile conditions.
As always we will keep you all updated with any changes to our plans throughout the week. Please don't forget to like, comment and follow to support us, we really appreciate it!
GoldViewFX
XAUUSD TOP AUTHOR
GOLD top-down analysisHello traders, this is the full breakdown of this pair. We will take this trade if all the conditions are satisfied as discussed in the analysis. Smash the like button if you find value in this analysis and drop a comment if you have any questions or let me know which pair to cover in my next analysis.


Gold : Intraday Technical AnalysisGold Intraday Technical Analysis:
The yellow metal faced rejection and 1870 and the downtrend prevailed in the gold market like all other financial markets . My idea is that the gold will try to test the support of 1950 once again today during London or New York session. My target is entry after the confirmation of support at 1950 with target of resistance of 1960 and 1970 for intraday.
#XAUUSD #gold #goldtrading #goldtradingsystem

Gold : Intraday Technical AnalysisGold is still in a downtrend with supports at 1860 and resistance at 1880. The downtrend is still strong. My idea is entry at 1880 and 1870 after rejection with the goal of support of 1860 and 1850.
If you like this or if you think the opposite of this or if there is any other opinion, mention it in the comments. I am open to all kind of suggestions and critics

Gold : Correction Was DueGold took a rejection at 1995 and then broke all nearby after comments on interest rates by ST louis’s Fed. My target is waiting for recovery till 1960 and then going long with goal of resistance of 1980 in intraday.
If you like this or if you think the opposite of this or if there is any other opinion, mention it in the comments. I am open to all kind of suggestions and critics

GOLD top-down analysisHello traders, this is the full breakdown of this pair. We will take this trade if all the conditions are satisfied as discussed in the analysis. Smash the like button if you find value in this analysis and drop a comment if you have any questions or let me know which pair to cover in my next analysis.

XAUUSD - KOG REPORT - NFP!This is our view for NFP today, please do your own research and analysis to make an informed decision on the markets. It is not recommended you try to trade the event if you have less than 6 months trading experience and have a trusted risk strategy in place. The markets are extremely volatile and can cause aggressive swings in price.
We’ll start by saying this isn’t really something we want to get involved in, with all the news in the markets, the backtracking of the feds Powell and on top of that uncertainty and fear in the markets, we will sit this one out unless we get the levels we’re looking for. We have two targets on Gold at the moment, the 1980-85 level and the level which seems way down below now which is around 1880-85. We’ve market the key levels on the chart with what we feel is the range and what we feel could be the movement for NFP based on the technical aspects of the chart, not the numbers!
We’re expecting DXY to tap out slightly above where it is now and then start a potential decline which if correlations allow will give Gold a small dip and then potentially push it up to test that recent high.
So as always, we’ll look at this with two scenarios in mind:
Scenario 1:
The price dips to the immediate support or, pushes up straight away. We will wait for the higher key levels 1963-5 and above that 1980, where if we see resistance we feel it would represent an opportunity to test the short trade back into the levels of 1950, 1930 and below that 1920.
Scenario 2:
The price drops from here, we will wait for the lower support levels of 1920 for a reaction, breaking this level we have our target below at 1880-85, that’s where we feel would be an opportunity to test the long trade back up into the levels of 1930 as the first destination.
We would like to see how the price reacts at the key levels as we’re expecting both our targets to get hit, either the higher first, then the lower. Or, the lower first then the higher.
New traders, sit this one out. The trade will come, let them push the price to where they want to grab liquidity from, exhaust and then potentially take a position. Control your lots sizes, this isn’t the market condition to be trying to get rich quick and always, always have a risk strategy in place.
As always, trade safe.
KOG

Gold Analysis Daily TFAs the Ukraine and Russia situation escalates, the volatility within the markets continue. Last week gold rallied and broke through multiple levels of resistance but was followed by a strong rejection and eventually a close below a key level of resistance.
As always, what goes up must come down and that is exactly the case with gold. I don't think Gold will continue bearish for too long though. I believe price is just correcting itself after that strong bullish run and the market is trying to find stability.
Keep in mind that tomorrow is the last day of the month and the monthly candle will be closing. I see Gold continuing its bearish momentum to retest 1870.15 or possibly 1850, where it will form support or reject, before continuing the bullish trend.
I am anticipating for tonight to continue the bullish retracement to form the next daily candle's wick, and then for price to continue bearish. Throughout the early parts of the week I think Gold will be bearish and then by the end of the week it will form support to prepare for a bullish run next week, unless some sort of news comes out to cause volatility once again. We will see during market open. As of now I see Gold bearish in the short term, but bullish long term.
1. Price has recently broken out of the range to retest a previous high and rejected
2. Price did create a higher high, but the close of the candle was back into this range
3. There is high probability that the next daily candle can continue the bearish momentum and potentially form support along 1870.150
4. If support if formed here after a bullish candle has printed, price can definitely continue bullish to retest the highs that were created.

Gold Price Analysis: Market is waiting to test 1830 again. Gold has been making a solid comeback in the past week, and today it reached above $1800 for the first time since the first week of September.
This bit long-awaited move finally came after weeks of impressive gains made following Wednesday's upsurge, which saw gold preserved its bullish momentum. That is an important milestone that XAU/USD has reached above the $1800 price zone.
The reason behind such good fortunes? Falling U.S. Treasury bond yields seem to be fueling these advances with their recent poor performance weighing heavily upon USD prices.
N.F.P. came super negative, Market sentiment helping the gold price to up as well. Though yesterday C.P.I. printed positive today, PPI fades away. Last week before N.F.P., most U.S. economic reports came positive, but the USD outperformed against the gold.
The dollar Index falls below 93.80, nearly ten days lows; as a result, investors are seeking haven assets like Precious Metals. So, recent fundamental and market sentiment is helping the gold price to rise.
Technical View:
In one of my previous articles, I mentioned that breaking above 1865 may open the door for the 1830/1835 price zone. It seems that the gold market is heading to the 1830/1835 price zone.
From the present price zone, immediate resistance is showing at the 1807/1810 price zone. But keep in mind, every round figure play as a support and resistance. SO, 1800 price may play as minor resistance.
So, breaking above 1800, next target 1807/1810 price zone. After 1810 gold price may be headed to the 1830/1835 price zone. 1830/1835 price zone is a strong resistance zone and profit-taking zone. So, we may see a significant correction from the 1830/1835 price zone.
On the other hand, the gold price rose nearly 450+ pips since yesterday. So, it may be correct to lower if we see Retail Sales and Core retails print positive tomorrow. But I think it has less chance. But usually, it is showing overbought in R.S.I. SO, it may be correct too.
As long as gold's price holds above 1780, an uptrend channel's support. We should not go for short. Instead, gold may go up again after testing the 1780/1785 price zone. In case if we see gold price breaks below rising trendline support. We will go for short, and the next target should be the 1750 price zone. And finally, breaking below 1750, the last target to the downside is the 1720/1725 price zone.

Gold MCX setupGold is trading near support zone from last 4 trading sessions.
Breaking any side out of this range will trigger fast movement.
48000 level is breakout level for this range. One day closing above 48000 will trigger buying,
Buy above 48150
Sl 47950
Target 1 - 48300, 48750
On the flip side 47500 is strong support and closing below this will trigger strong sell off and that will take gold to 46000 area.

XAUUSD - KOG REPORT - NFP!This is our view for NFP today, please do your own research and analysis to make an informed decision on the markets. It is not recommended you try to trade the event if you have less than 6 months trading experience and have a trusted risk strategy in place. The markets are extremely volatile and can cause aggressive swings in price.
We’re going to start with what we mentioned in the KOG report on Sunday where we said we would be looking for support during the course of the week and then for the price to push up towards the higher resistance levels where we would be looking to short the market. During the course of the week we hope you can see we’ve kept members in the right way of the market even though our bias is bearish on Gold. So lets look at what the market has done in preparation for NFP.
As we’ve said they will swoop the low for liquidity before bringing it back up towards the 1810-12 level and settle the price for the release. This has all happened this week!
Now looking at the chart we can see we’re settling above previous supply which would suggest the price can target the higher resistance levels. The KOG report suggest the 1808-12 level for the first short 1820 and the 1824-7 level for the next attempt at the short trade.
For NFP we’ll give you two scenarios.
Scenario 1:
If the price comes down to hit the 1804-6 support level and finds support this could represent a good opportunity to long the market in to the immediate resistance levels above of 1816, 1820-22 and above that 1827-32. Please note, if there is no support at the mentioned level its likely we will continue down testing and potentially breaking the 1797-5 support region. A strong resistance at the levels above however could be an opportunity to short the market back down into the lower support regions and potentially lower. We have a KOG target of 1770 which we wanted to see achieved this week but we’re not holding out for it, especially during an event like NFP!
Level to level trading please.
Scenario 2:
If the price pushes down from here we will be looking at the lower support regions of 1777 and below that 1770. We’re not interested in the 1797-5 level as support anymore and would rather miss the opportunity to long the market at that levels. We feel the lower support regions will represent a good opportunity to long the market but only into the immediate resistance level above which would be 1785 and above the 1795-7.
Hope this helps members. Even with our bearish view on Gold we’ve managed to keep you in the right direction as always, taking shorts and longs this week into the levels and targets we’ve mentioned. We would like to see how this NFP plays out and where the market closes today to confirm our view for the rest of the month of February.
As always, trade safe.
KOG

GOLD LONG TARGETI entered the LONG position on GOLD at the price of 1787. My target is close to 1830. I am constantly moving my SL higher to save my profit.

Gold long opportunityEither gold will reverse right now and breakout or take support from the green trend line and then go to the red line and breakout.
Reason: reason for gold to be bullish is the FED interest rate hike on March,22 which will create panic in the stock market and make commodities ( silver , gold ) bullish

GoldViewFX - RANGE MANAGEMENT SETUPHey All,
We will post our usual analysis for the week on our weekly GoldView report shortly before market opens. This is a quick post using historical ranges using range HIGH and range LOWs to create support and resistance trading zones and the range of the potential swing in the trading zone.
Its really important, as a trader to identify the potential reversal in order to manage the reversal on your equity and exposure without making rational cuts too early or hold a reversal, when the swing range is too big for your exposure. Every trade entered; 8 out of 10 times it reverses, we need to work this into our trading psychology in order to make room for this in our risk management and make sure the potential swing falls within our risk appetite.
We have highlighted the zones to BUY and SELL with the central zone for take profit, which is inline with the ranges consolidation area allowing any swings and momentum based movement to come back to this range for consolidation, providing a safe zone to take exits before you find yourself trading against the range and outside of the SWING RANGE. If you find yourself trading against the range, it should only be within the swing range, which provides more confidence in coming back into direction then stretching out your equity, with no plan or a range management map.
We hope you find the range management map useful for the current range and it helps you to see a clearer picture of what the price is doing. Remember nobody can tell you what the market will do or predict the movement 100%. The best anyone can do is use historical data to have a better idea and speculation of what the price may potentially do, based on what it did before and how it reacted to similar market dynamics before.
Please don't forget to like, comment and follow to support us, we really appreciate the likes and it helps us to bring more content to you all.
GoldViewFX
XAUUSD TOP AUTHOR

XAUUSD - KOG REPORT!In last weeks KOG Report we suggested we would stay bearish on the market as long as the price stayed below the 1824-7 price level but we would be trading with our 1833 KOG target in mind. We said we would be looking at another attempt on the lows and that 1812-08 region support could be an opportunity to then take the long to target the higher resistance levels. We suggested we would like to test the short trade from the resistance levels but due to the change in structure we updated during the week that we would be targeting higher levels instead. This bullish move also completed our 1833 KOG target which we had been looking at for the last few weeks in our KOG reports.
So what can we expect in the week ahead?
We’ll start by saying, yes, we’re still playing bearish on this only taking long trades into the resistance levels. Until we break and hold above that 1855-65 price region we will remain with this view. The benefit of level to level trading is you can target both long and short trades with your bias being on getting the right entry to hold for your direction, which in our case is short. We are however expecting more bullish movement on Gold this week potentially targeting that higher resistance level which we had stated and planned for on our post about “Trading the Range”. Please read this report is you haven’t already as we have updated it last week. We’re hoping for the price to use the lower support regions as a base to settle before a push up during the week into the higher resistance levels of 1845, 1855-60. We have a KOG target both above and below, so we’re hoping the higher on gets completed first and then the price declines to target the lower one.
Our plan for the week:
We will be looking for a potential test on the 1840-45 resistance level during the early sessions where we feel the price may face resistance. Depending on this level holding we may test the short trade but only into the immediate support levels below of 1835, 1830 and below that 1827. The 1827-24 price region is where we’re hoping the price will find support which if it holds, we want to test the long trade for that higher price level of 1845, 1850-55 and above that 1860. These higher resistance levels are where we will be waiting to take our positions for the short trades back down in to the lower support levels that start at 1810 and below.
That higher region of resistance is the last opportunity for bears to hold their ground and we feel that is where they’re waiting for the bulls to take the price. Breaking above that higher level with change our stance on Gold and we will turn bullish on this. Until then we’ll be in and out level to level making the most of the range.
We have FOMC this week so please trade carefully, unless this gets priced in which is very possible there is going to be a lot of choppy price action and aggressive swings in the markets this week.
We will update you with our plans and analysis throughout the week as we have been. Wishing you a successful weeks trading ahead.
As always, trade safe.
KOG
