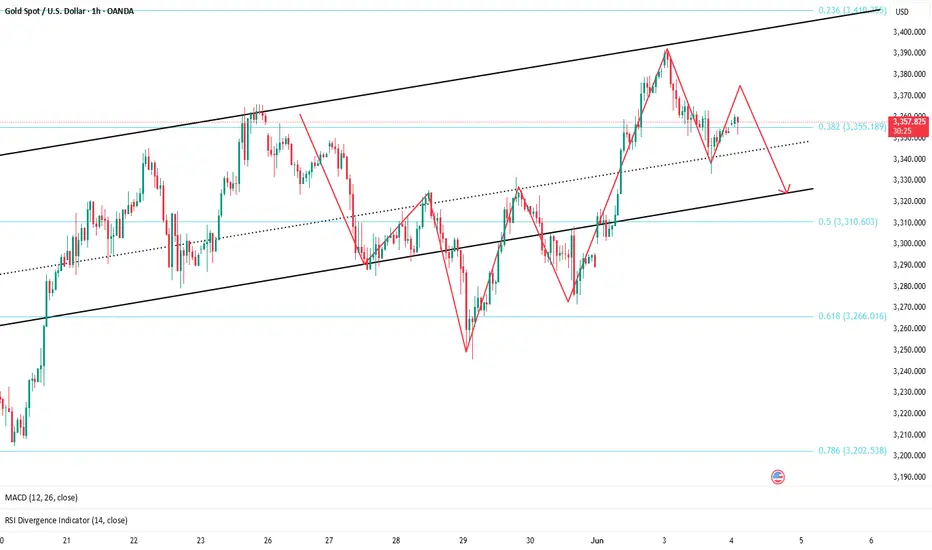
Rebound is a good opportunity to short goldGold gradually rebounded after touching 3295. The highest price has rebounded to 3338. Although the rebound has reached $43, the upward momentum is not strong during the rebound. Therefore, the current rebound cannot be confirmed as a reversal trend. Moreover, gold has not yet effectively broken through the 3330-3340 area. Gold is still weak in the short term. Gold still has the potential to fall after the rebound. It will at least retest the 3315-3305 area again.
Therefore, there is no need to fear the rebound of gold for the time being. The rebound of gold is a good opportunity to short gold. I think gold will at least retest the 3315-3305 area again, and even exceed expectations to the area around 3280. Shorting gold is the password for profit in the short term!
Goldtradingstrategy

Short Gold,gold is expected to test 3300 or even 3280 againAlthough gold is currently above 3310, it does not mean that gold has stopped falling and stabilized. As long as gold remains below 3330-3340, gold is still in a weak state, so I think the decline of gold may not be over yet. Judging from the current trend, I think gold will have to retest 3300 at least again, or even around 3280 before it will have a chance to stop falling and rebound.
So for the grasp of short-term trading opportunities, I think you can consider shorting gold with 3330-3340 as resistance.

GOLD ROUTE MAP UPDATEHey Everyone,
Great start tot he week with our chart idea playing out, as analysed.
We started today with our bullish target at 3318 hit, followed with ema5 cross and lock opening 3352. Rejection here will see lower open Goldturns tested for support and bounce and further cross and locks will confirm a continuation.
We will see levels tested side by side until one of the weighted levels break and lock to confirm direction for the next range.
We will keep the above in mind when taking buys from dips. Our updated levels and weighted levels will allow us to track the movement down and then catch bounces up.
We will continue to buy dips using our support levels taking 20 to 40 pips. As stated before each of our level structures give 20 to 40 pip bounces, which is enough for a nice entry and exit. If you back test the levels we shared every week for the past 24 months, you can see how effectively they were used to trade with or against short/mid term swings and trends.
The swing range give bigger bounces then our weighted levels that's the difference between weighted levels and swing ranges.
BULLISH TARGET
3318 - DONE
EMA5 CROSS AND LOCK ABOVE 3318 WILL OPEN THE FOLLOWING BULLISH TARGETS
3352
EMA5 CROSS AND LOCK ABOVE 3352 WILL OPEN THE FOLLOWING BULLISH TARGET
3388
EMA5 CROSS AND LOCK ABOVE 3388 WILL OPEN THE FOLLOWING BULLISH TARGET
3428
EMA5 CROSS AND LOCK ABOVE 3428 WILL OPEN THE FOLLOWING BULLISH TARGET
3478
BEARISH TARGETS
3281
EMA5 CROSS AND LOCK BELOW 3281 WILL OPEN THE FOLLOWING BEARISH TARGET
3254
EMA5 CROSS AND LOCK BELOW 3254 WILL OPEN THE FOLLOWING BEARISH TARGET
3210
EMA5 CROSS AND LOCK BELOW 3210 WILL OPEN THE SWING RANGE
3179
3146
As always, we will keep you all updated with regular updates throughout the week and how we manage the active ideas and setups. Thank you all for your likes, comments and follows, we really appreciate it!
Mr Gold
GoldViewFX

Perfect prediction of Monday's opening trendGold opened near 3310 today, and fell under pressure after reaching a high of 3321, which was in line with our previous prediction of the short-selling layout in the 3320-25 area. We successfully entered the short order and successfully stopped profit at 3305. Then the market was supported and stabilized near 3296. We decisively went long and also realized profit.
From the current trend, the short-term suppression during the day is still focused on the 3320-3325 line, and the key suppression area is around 3338-3345. Gold closed in an inverted hammer shape last week. From a technical point of view, the rebound is still mainly short-selling. If you are not in a good rhythm in gold trading recently, welcome to communicate and reduce unnecessary trial and error.
【Short-term technical analysis】
The upper short-term pressure focuses on the 3320-3325 area. If it rebounds to this point, it will be short first and look for a decline. If it rises strongly to the 3338-3345 range, it will still be the focus of short positions. The lower support focuses on the 3295-3285 area. The overall strategy of "high-short-low-long" is maintained. It is not recommended to frequently chase orders in the middle position. Be patient and wait for key point signals. I will remind you of the specific entry and exit plan during the session. It is recommended to pay attention in time.
【Gold operation strategy】
1. Go short first at the rebound 3320-3325 line. If it touches the 3338-3345 area, you can cover your position and go short. The target is 3306-3295. If it breaks, continue to hold and look down.

Gold on Monday depends on this wave of operationsBefore the non-agricultural data on Friday, gold maintained an overall oscillating pattern, opening at 3354, briefly rising to around 3375 and then falling under pressure, entering an overall oscillating downward mode. We also caught the rhythm of long orders many times and successfully exited the market with profits. Although the non-agricultural data was bearish, gold did not dive quickly, but rebounded to around 3363 after short-term fluctuations, and then fell under pressure again, and finally closed in an inverted head shape, with obvious technical bearish signals.
From the perspective of form, gold is expected to continue to rebound high and high next week. Focus on the support of this week's low point of 3296. Once it falls below, it is possible to further explore the 3270-3260 area. However, if this position remains stable and unbroken, the market still has room for rebound and repair.
From a specific technical perspective, the obstructed decline of the 3375 line on Friday is more critical, with the lowest intraday drop to 3307, and the bearish momentum is still strong. It is recommended to be prudent in operation and do not blindly chase orders.
🔸Operation ideas for gold next week:
1️⃣ If it rebounds to 3320-3325, you can try to arrange short orders. If it rebounds further to 3338-3345, it is recommended to cover short positions.
2️⃣ The first target is the 3295-3306 area. If it effectively falls below, continue to hold and look for a lower position.
3️⃣ The support below is focused on the 3295-3285 area, and the pressure above is still mainly 3335-3345. The market is mainly oscillating in the middle of the range. It is recommended to watch more and act less, and wait for key point signals before intervening.
If you are currently having trouble with gold operations, welcome to communicate with me. I will update the strategy as soon as possible according to the intraday market and try my best to make your investment less detours.

GOLD 1H CHART ROUTE MAP UPDATE & TRADING PLAN FOR THE WEEKHey Everyone,
Please see our updated 1h chart levels and targets for the coming week.
We are seeing price play between two weighted levels with a gap above at 3318 and a gap below at 3281. We will need to see ema5 cross and lock on either weighted level to determine the next range.
We will see levels tested side by side until one of the weighted levels break and lock to confirm direction for the next range.
We will keep the above in mind when taking buys from dips. Our updated levels and weighted levels will allow us to track the movement down and then catch bounces up.
We will continue to buy dips using our support levels taking 20 to 40 pips. As stated before each of our level structures give 20 to 40 pip bounces, which is enough for a nice entry and exit. If you back test the levels we shared every week for the past 24 months, you can see how effectively they were used to trade with or against short/mid term swings and trends.
The swing range give bigger bounces then our weighted levels that's the difference between weighted levels and swing ranges.
BULLISH TARGET
3318
EMA5 CROSS AND LOCK ABOVE 3318 WILL OPEN THE FOLLOWING BULLISH TARGETS
3352
EMA5 CROSS AND LOCK ABOVE 3352 WILL OPEN THE FOLLOWING BULLISH TARGET
3388
EMA5 CROSS AND LOCK ABOVE 3388 WILL OPEN THE FOLLOWING BULLISH TARGET
3428
EMA5 CROSS AND LOCK ABOVE 3428 WILL OPEN THE FOLLOWING BULLISH TARGET
3478
BEARISH TARGETS
3281
EMA5 CROSS AND LOCK BELOW 3281 WILL OPEN THE FOLLOWING BEARISH TARGET
3254
EMA5 CROSS AND LOCK BELOW 3254 WILL OPEN THE FOLLOWING BEARISH TARGET
3210
EMA5 CROSS AND LOCK BELOW 3210 WILL OPEN THE SWING RANGE
3179
3146
As always, we will keep you all updated with regular updates throughout the week and how we manage the active ideas and setups. Thank you all for your likes, comments and follows, we really appreciate it!
Mr Gold
GoldViewFX

GOLD 4H CHART ROUTE MAP UPDATE & TRADING PLAN FOR THE WEEKHey Everyone,
Please see our updated 4h chart levels and targets for the coming week.
We are seeing price play between two weighted levels with a gap above at 3376 and a gap below at 3302. We will need to see ema5 cross and lock on either weighted level to determine the next range.
We will see levels tested side by side until one of the weighted levels break and lock to confirm direction for the next range.
We will keep the above in mind when taking buys from dips. Our updated levels and weighted levels will allow us to track the movement down and then catch bounces up.
We will continue to buy dips using our support levels taking 20 to 40 pips. As stated before each of our level structures give 20 to 40 pip bounces, which is enough for a nice entry and exit. If you back test the levels we shared every week for the past 24 months, you can see how effectively they were used to trade with or against short/mid term swings and trends.
The swing range give bigger bounces then our weighted levels that's the difference between weighted levels and swing ranges.
BULLISH TARGET
3376
EMA5 CROSS AND LOCK ABOVE 3376 WILL OPEN THE FOLLOWING BULLISH TARGETS
3438
EMA5 CROSS AND LOCK ABOVE 3438 WILL OPEN THE FOLLOWING BULLISH TARGET
3498
EMA5 CROSS AND LOCK ABOVE 3498 WILL OPEN THE FOLLOWING BULLISH TARGET
3551
BEARISH TARGETS
3302
EMA5 CROSS AND LOCK BELOW 3302 WILL OPEN THE FOLLOWING BEARISH TARGET
3235
EMA5 CROSS AND LOCK BELOW 3235 WILL OPEN THE SWING RANGE
3171
3113
EMA5 CROSS AND LOCK BELOW 3113 WILL OPEN THE SECONDARY SWING RANGE
3045
2987
As always, we will keep you all updated with regular updates throughout the week and how we manage the active ideas and setups. Thank you all for your likes, comments and follows, we really appreciate it!
Mr Gold
GoldViewFX

GOLD WEEKLY CHART MID/LONG TERM ROUTE MAPHey Everyone,
Following up on last week’s chart update, we saw another perfect test of the channel top, right in line with our Goldturn Channel expectations. The new weekly candle completed the channel top challenge with precision, once again confirming the strength of our resistance levels.
As anticipated, the rejection came in cleanly, followed by a correction into EMA5 detachment, which halted just short of the 3281 level, a crucial axis we've been tracking for multiple weeks. This level continues to act as firm support, holding price within an evolving range.
We’re now seeing price action contained between 3281 and 3387, with potential for expansion higher as the ascending channel continues to rise. This expanding structure offers more room for strategic positioning, especially as price coils tighter within the upper band.
The 3387 gap remains active and is an obvious magnet if momentum builds. As long as we stay above the half line and especially above 3281, we remain in buy the dip mode, favouring long setups off our intraday Goldturns for quick 20 40 pip scalps or swing entries when conditions align.
Should we see a deeper pullback or close below 3281, we’ll reassess potential movement toward the lower channel boundary. Until then, the structure remains bullish within the channel.
The Goldturn methodology continues to prove its worth, cutting through noise and keeping us aligned with the real structure of the market.
Stay sharp, stay patient.
MR GOLD
GOLDVIEWFX

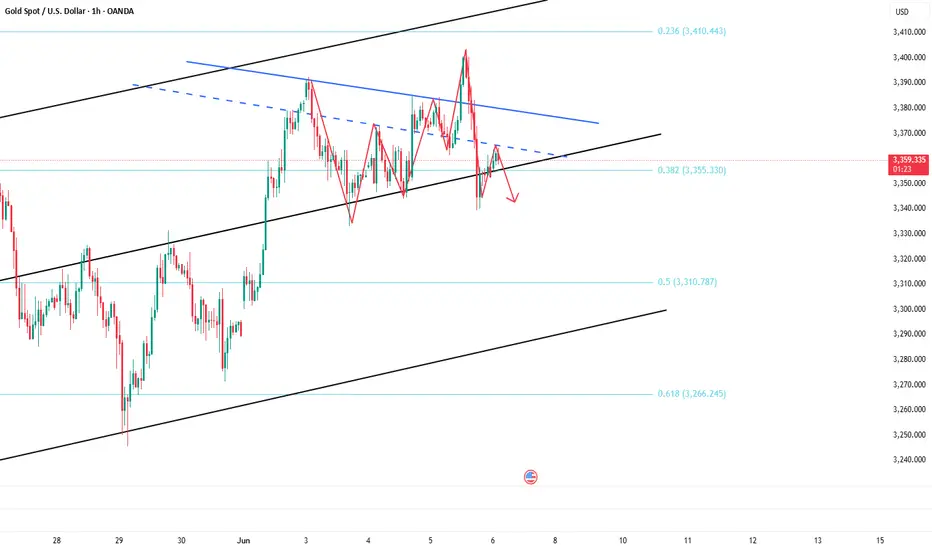
Gold falls below key support, short-term bearish approachAt present, the hourly level has fallen below the key support level of 3330, which is effectively broken as the short-term long-short watershed, which means that the market is weak and volatile in the short term. However, it does not constitute a short trend for the time being. The short-term trend in the future may still fluctuate downward, but there is no basis for a deep decline. Short-term short orders can be participated in, but the general direction remains bullish.
This week is coming to an end. If there are still operation plans, you can wait for a small rebound and then participate in a wave of short-term short operations. The target is controlled at 10-30 points. Enter and exit quickly, and don't be greedy.
Looking ahead to next week, it is expected that the market will fluctuate around 3,300 and then bottom out and then resume its upward trend. The thinking will continue to be mainly "short-term short and long-term long".
The current gold 1-hour moving average system has begun to turn downward. If a dead cross structure is further formed in the future, the downward space will be opened. After gold fell under pressure from a high level yesterday, it continued to be weak today. Combined with the bearish non-agricultural data, there is a lack of support for risk aversion. There is still room for short-term downward movement, and the overall rebound is still the main focus.
Operation suggestions:
Aggressive investors may consider shorting in the 3333-3335 range;
Conservative investors may wait for a rebound to the 3345-3350 area and enter the short position at an appropriate time.
The target is 10-30 points. It is not recommended to hold more than the target.

GOLD ROUTE MAP UPDATEHey Everyone,
A great finish to the week with our 1H chart idea finishing off with the rejection from 3389 with no further cross and lock above that level confirming the rejection. We continued to see a drop into the lower Goldturns with each level giving 20 to 40 pip bounces.,
We are now seeing 3334 Goldturn being tested. Lets see if we get the 20 to 40 pip reactional bounce before close of play.
We’ll be back now on Sunday with our multi-timeframe analysis and trading plans for the week ahead. Thanks again for all your likes, comments, and follows.
Wishing you all a fantastic weekend!!
MR GOLD

The rebound is not strong, and gold still has room to fallThere is no good entry point to participate in the transaction at present, but the highlight of today is the NFP market, so there is no need to rush to enter the market when there is no trading opportunity.
Although gold rebounded slightly after touching 3340 overnight, to be honest, the rebound strength is far less than expected, and as long as gold remains below 3365-3375, gold will remain weak in the short term, so I think gold still has room to fall. First, pay attention to the support near 3330, followed by the support near 3310. However, in trading, we must pay attention to guard against the trend of falling after rising in the NFP market.
Trading strategy:
1. Consider continuing to short gold in the 3375-3385 area, TP: 3360-3350;
2. Consider trying to go long gold in small batches in the 3325-3315 area, TP: 3340-3350

Short gold after reboundOvernight, gold broke through the 3400 mark due to the intensification of geopolitical risks, but plunged sharply due to the reduction of the risk of Sino-US trade decoupling. Because the news swept up and down, it brought certain difficulties to the transaction. Today, we will focus on the NFP market!
After overnight gold plunged to around 3340, it is currently maintaining a small rebound state. Relatively speaking, the rebound potential is weak, and with the sharp plunge of gold in the short term, the market bulls' confidence has been hit. At present, without major good news, it is difficult to make breakthrough progress based on technical support alone. The upper side faces short-term resistance of 3365-3375 area resistance. If gold cannot break through this area in the short term, gold will be weak!
Trading strategy:
Consider shorting gold in the 3370-3380 area, TP: 3355-3345
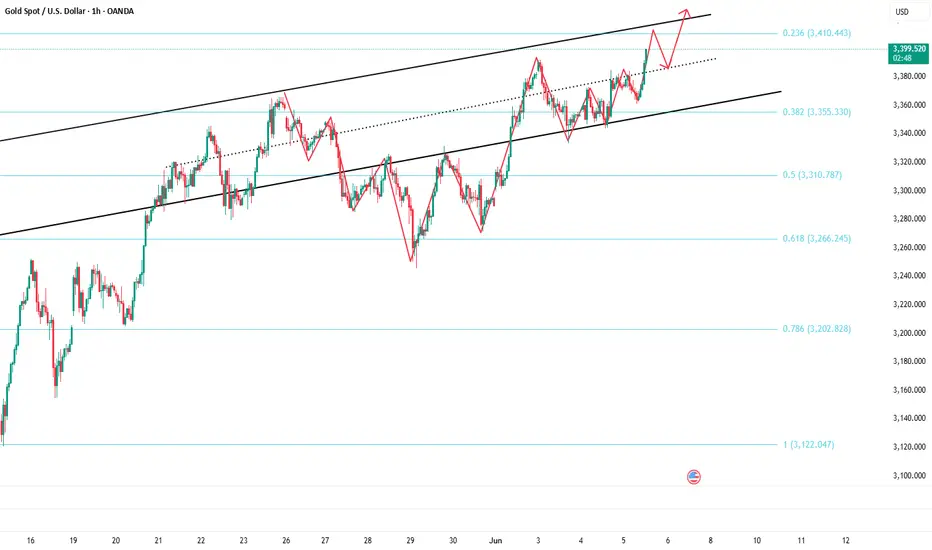
Buy gold, there is still potential to hit 3400Gold gradually fell after touching 3403, and the current lowest has fallen to 3364. Has the gold bull market ended? In fact, I think the gold retracement is a good time to buy, and I am not afraid of gold retracement.
From the overall perspective of the day, gold did not fall below the 3360 mark during today's retracement. This area has become the intraday strength and weakness dividing line. As long as gold can stay above 3360, I think gold still has the potential to continue to rebound. Moreover, the tariff issue and geopolitical conflicts have not been effectively resolved, which is still favorable for gold in terms of fundamentals. Moreover, gold has broken through 3400 twice. I think the bull market will not end easily, and there is still the potential to test 3400 again, and it may even rise to the 3410-3420 area.
Trading strategy:
Consider shorting gold in the 3365-3355 area, TP: 3390-3400
Today’s gold strategy: go long on support and short on pressure!Today, there is a high probability that the volatile bullish trend will continue. In terms of operation, we should seize the opportunity of short-term bullish. The key support level of the daily line is around 3350-3355. If it falls back to this level, you can arrange short-term bullish with a light position. If the market is strong and there is no obvious correction, you can enter the long position in advance at the 3370 line. Pay attention to the upper resistance level of 3400-3405. Once it breaks through effectively, wait for the opportunity to arrange short positions after the surge. In the volatile market, both long and short positions have opportunities. Don't chase the rise and sell the fall. Be sure to wait patiently for the right time to enter the market and strictly control the position.
Gold operation suggestions: short gold rebounds around 3400-3405. Go long gold when it falls back to around 3350-3360. Go long at 3370 first if it is strong and does not pull back.

GOLD 1H CHART ROUTE MAP UPDATEHey Everyone,
As anticipated, the market structure continues to respect our key levels and EMA5 dynamics to the letter.
After the clean bounce from 3334 into 3359, price did indeed push back toward 3389 for the retest, just as outlined. Once again ema5 failed to cross and lock above 3389, confirming rejection again. It’s important to highlight that price did retest 3389 exactly as projected, completing the range once again.
Crucially, no further EMA5 cross and lock above 3389 was seen, reconfirming the rejection and driving price back into the lower Goldturns, which we will now look for support and bounce off these levels.
The structure continues to unfold with precision, showing once again how effective our level based framework is when paired with EMA5 confirmations. This setup keeps us well aligned with market momentum.
As always, we remain focused and continue to buy dips using our support levels, capturing those 20 to 40 pip opportunities. As we’ve proven time and again, each level gives enough of a bounce for a quality entry and exit.
We encourage everyone to backtest our levels, we’ve shared them weekly for the past 3 years , and the data speaks for itself. These levels continue to work brilliantly with both short/mid term trends and countertrends.
BULLISH TARGET 3305 – ✅ DONE
EMA5 CROSS AND LOCK ABOVE 3305 WILL OPEN THE FOLLOWING BULLISH TARGETS
3334 – ✅ DONE
3359 – ✅ DONE
3389 – ✅ DONE (retested as forecasted)
EMA5 CROSS AND LOCK ABOVE 3389 WILL OPEN THE FOLLOWING BULLISH TARGET
3428
EMA5 CROSS AND LOCK ABOVE 3428 WILL OPEN THE FOLLOWING BULLISH TARGET
3478
BEARISH TARGETS 3271
EMA5 CROSS AND LOCK BELOW 3271 WILL OPEN THE FOLLOWING BEARISH TARGET
3227
EMA5 CROSS AND LOCK BELOW 3227 WILL OPEN THE SWING RANGE
3185
3146
Stay sharp, manage risk, and trust the levels. We’ll continue providing updates as the structure develops further.
Thank you again for all your likes, comments, and continued support.
Mr Gold
GoldViewFX

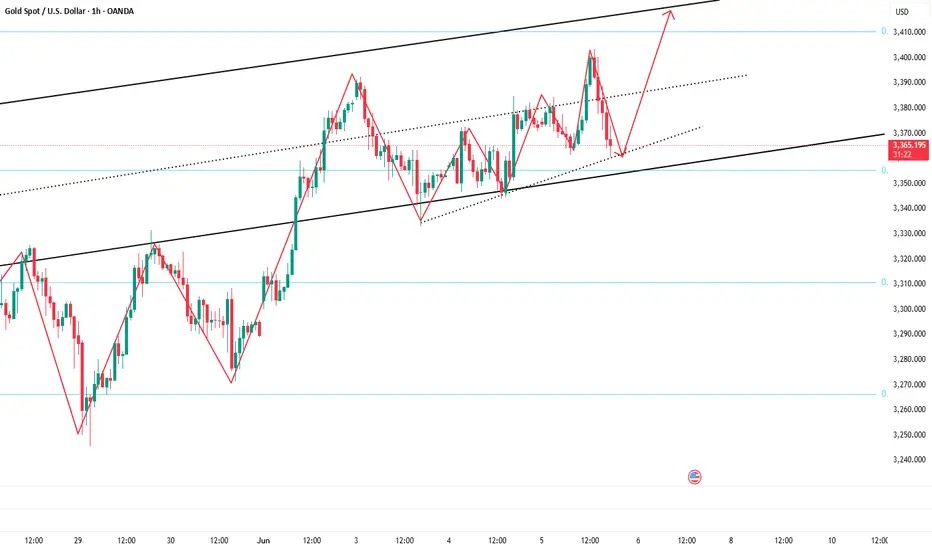
Gold is expected to continue to 3410-3420At present, gold has risen to around 3395 in the short term, breaking through the short-term high of around 3392, and there is no clear peak signal; and after breaking through the previous high of around 3392, there is no need to worry about the suppression of the technical double top structure for the time being. From this point of view, gold still has the potential to continue to rebound in the short term, and is even expected to reach the 3410-3420 area; this morning, gold has not fallen below 3360 during the adjustment process. As gold rises, the lower support area gradually moves up. The current short-term support area is in the 3385-3375 area.
Today's trading strategy:
1. Consider shorting gold when it first touches the 3410-3420 area, TP: 3395-3385
2. Consider trying to go long gold in small batches when gold falls back to the 3385-3375 area, TP: 3395-3405
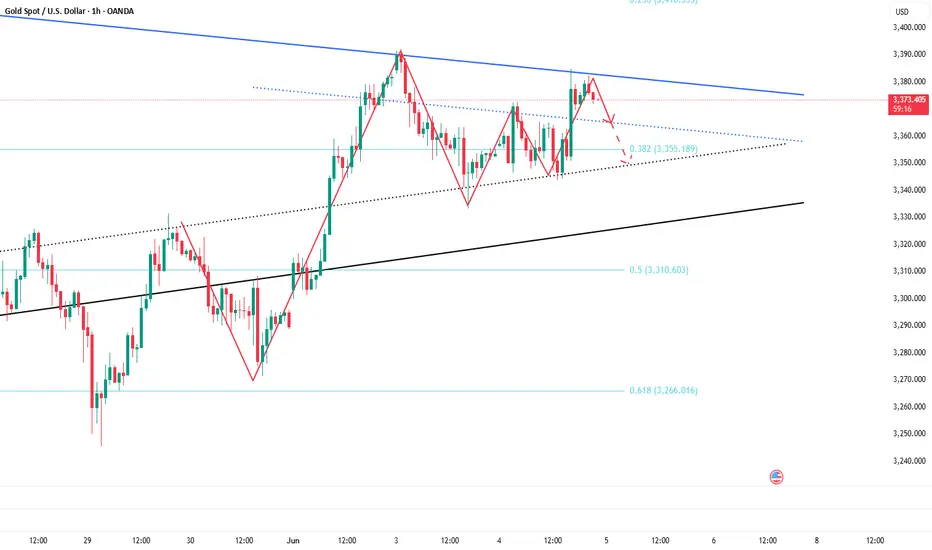
Double top pressure appears Gold short-term bearishThe current price shows a sign of hesitation after experiencing a sharp rise. The bulls hit a high of 3384 twice and then pulled back. The high point and yesterday's high point formed a double top suppression. Two attempts to test Monday's high of 3392 failed, indicating that the bullish momentum has weakened. The short-term high-altitude strategy for gold is mainly used. Pay attention to the key support of 3340-3345 below. If it is effectively broken, it may fall to the 3325 trend line conversion support level below. In terms of operation, it is recommended to rely on the double top pressure of 3384-3392 to arrange short orders at highs. Market volatility may intensify before the release of non-agricultural data.
Gold operation suggestions: short gold near 3384-3392, target 3370-3360.

I still have a short position.Although gold has risen sharply to above 3380 due to the intensification of the Russian-Ukrainian conflict, it has not made a substantial breakthrough, and has not stabilized above 3380. The bulls are not determined, which also shows that the technical suppression in the 3290-3295 area above is still strong. If gold does not break through in one fell swoop, gold is likely to usher in a wave of retracement in the short term.
Due to the fundamental impact of tariff issues and geopolitical conflicts, for short-term trading, we should not have too high expectations for the extent of the retracement for the time being, but it is expected to retrace to the 3365-3355 area. In terms of short-term trading, I still hold a short position executed near 3375, and I hope that gold can fall back and hit TP as expected.
Trading strategy:
Consider shorting gold in the 3375-3385 area, TP: 3365-3355
GOLD ROUTE MAP UPDATEHey Everyone,
Another powerful day in the markets with our chart idea unfolding exactly as anticipated.
In yesterday’s update, we highlighted that all our targets 3305, 3334, and 3359 were hit following the EMA5 cross and lock confirmation. We also pointed out the EMA5 lock above 3359, opening a clear gap to 3389, which was also hit perfectly. The absence of a further EMA5 lock above confirmed a precise rejection, sending price back down into the lower Goldturns for support, just as projected. We then had the bounce off the 3334 level, another clean reaction, just like we stated.
Now today, after testing and bouncing from 3334 into 3359, price is now charging back toward 3389 for a potential retest, as that level remains open once again.
The structure is playing out beautifully, we will stick to the plan, and manage risk wisely.
We will continue to buy dips using our support levels taking 20 to 40 pips and track the movement with ema5 lock or rejection. As stated before each of our level structures give 20 to 40 pip bounces, which is enough for a nice entry and exit. If you back test the levels we shared every week for the past 24 months, you can see how effectively they were used to trade with or against short/mid term swings and trends.
The swing range give bigger bounces then our weighted levels that's the difference between weighted levels and swing ranges.
BULLISH TARGET
3305 - DONE
EMA5 CROSS AND LOCK ABOVE 3305 WILL OPEN THE FOLLOWING BULLISH TARGETS
3334 - DONE
EMA5 CROSS AND LOCK ABOVE 3334 WILL OPEN THE FOLLOWING BULLISH TARGET
3359 - DONE
EMA5 CROSS AND LOCK ABOVE 3359 WILL OPEN THE FOLLOWING BULLISH TARGET
3389 - DONE
EMA5 CROSS AND LOCK ABOVE 3389 WILL OPEN THE FOLLOWING BULLISH TARGET
3428
EMA5 CROSS AND LOCK ABOVE 3428 WILL OPEN THE FOLLOWING BULLISH TARGET
3478
BEARISH TARGETS
3271
EMA5 CROSS AND LOCK BELOW 3271 WILL OPEN THE FOLLOWING BEARISH TARGET
3227
EMA5 CROSS AND LOCK BELOW 3227 WILL OPEN THE SWING RANGE
3185
3146
As always, we will keep you all updated with regular updates throughout the week and how we manage the active ideas and setups. Thank you all for your likes, comments and follows, we really appreciate it!
Mr Gold
GoldViewFX

Continue to short goldTechnical aspect:
Although the ADP data release is a big positive for gold, the trend of gold is quite different. It only rebounded to around 3362 and then gradually fell back, which to a certain extent strengthened the effectiveness of the short-term resistance area of 3365-3375. For the time being, technical indicators alone cannot support gold to continue to rebound. After consuming a certain degree of bullish momentum, gold will continue to retreat. And I think 3340 will be broken, and even continue to the 3330-3320 area. So in terms of short-term trading, I still prefer to short gold.
Trading strategy:
Consider shorting gold in the 3360-3370 area, TP: 3345-3335.

Continue to short gold after the reboundTechnical analysis:
Gold rebounded after hitting 3333 overnight. So far, it has reached 3361. However, it can be clearly seen from the rebound process that the rebound is not strong, so I think the rebound space may not be too high. In the short term, it faces resistance in the 3365-3375 area. The strong resistance above the 3390-3400 area still exists, so it may be difficult for bulls to make a major breakthrough in the short term; and the support area below in the short term is in the 3340-3330 area, and the important support is in the area around 3320;
Trading strategy:
Consider shorting gold in the 3365-3375 area, TP: 3350-3340
The pullback did not change the bullish trendGold maintained a weak structure of shock in the Asian and European sessions, and the price slowly adjusted back, forming a secondary bottoming pattern during the day. The current trend is mainly structural consolidation. From a technical perspective, 3328 and 3335 below constitute key short-term support. If it does not break expectations, it will effectively stop the decline and stabilize, and provide a basis for a rebound.
At present, the profit space for chasing shorts is limited. The only stable idea is to wait for the gold price to fall back and stabilize before participating in the long position layout. In terms of operation, it is recommended to arrange long positions near the support level, focusing on the strength of gold's retracement in the 3325-3330 range, and confirming the stabilization of the decline.
Once it stabilizes and rebounds, the short-term long target can be seen at 3350 and 3378, and the extended target focuses on the previous high of 3392. If it breaks through strongly and stands firm at this position, it will further open up to 3400-3410 space.
Operation suggestion: If gold falls back to the 3325-3330 range, go long with a light position. If it falls to 3335 and stabilizes, you can enter long orders in advance, with targets at 3350 and 3378.

Buy gold, TP: 3355-3365Technical aspect:
Gold stopped falling and rebounded after touching 3333. The highest price has only rebounded to 3353. It seems that the bullish potential is weak and the rebound is weak. However, the gold candlestick chart closed with a long lower shadow after touching 3333, proving that there is a certain degree of buying support below; if gold can maintain above 3340-3330 in the short term, gold bulls still have the opportunity to rebound to 3355-3365;
From the perspective of morphological structure, as long as gold remains above 3330, the gold bull structure has not been effectively destroyed, and bulls still have the opportunity to counterattack. It also proves that the buying support below is effective, and the bottoming and rebounding structure is established in the short term, so we can still consider continuing to go long on gold in short-term trading.
Trading strategy:
Consider the 3345-3335 area as support, and try to go long on gold in small batches;TP:3355-3365
