GOLD 12H CHART ROUTE MAP ANALYSIS FOR THE WEEKGOLD 12H CHART UPDATE: 24th FEB 2025
Hello Everyone,
Here’s the latest 12H GOLD chart update, offering a thorough review of recent price movements and key insights for the upcoming sessions. Since October 2023, our careful tracking has maintained 100% target accuracy, as reflected by the Golden Circle markers on the charts. Let’s explore the highlights and what lies ahead.
* Gold touched ATH last week at 2954.81
* Gold price has been fluctuating between two weighted level above with a gap 2948 and with a gap below 2903 the whole week. The Resistance 2948 and support level 2903 reacted well.
What is next for GOLD?
* Resistance Levels: 2948, 2993, 3041, 3092
* Support Levels (GoldTurn Levels): 2900, 2856, 2813, 2770, 2710, 2664, 2599
* FVG is providing strong support at 2920 which might push price bullish
EMA5 Behavior (Red Line):
Current EMA5: 2937.47
Bullish Targets
EMA5 cross and lock Above 2948, will open the following bullish target 2993
EMA5 cross and lock Above 2993, will open the following bullish target 3041
EMA5 cross and lock Above 3141, will open the following bullish target 3092
Bearish Targets
EMA5 hold and cross Below 2900: will open the following bearish target 2856
EMA5 cross and lock Below 2856: will open the following bearish target 2813
EMA5 cross and lock Below 2813: will open the following bearish target 2770
EMA5 cross and lock Below 2770: will open the following bearish target 210
EMA5 cross and lock Below 2710: will open the following bearish target 2664 (Retracement Range)
Long-Term Outlook:
Maintain a bullish bias while using pullbacks as buying opportunities.
Buying near key support levels ensures better entry points and mitigates risks, avoiding the pitfalls of chasing tops.
Trade with precision, discipline, and confidence. Our accurate, multi-timeframe analysis equips you to navigate the market effectively. Stay updated with daily insights to remain ahead of market trends.
We appreciate your support! Don’t forget to like, comment, and share this post to help others benefit.
Best regards,
📉💰 The Quantum Trading Mastery Team
Goldtradingstrategy

Good news for bears, gold will fall back to 3095-3085Driven by Trump’s tariff policies and geopolitical risks, gold has sustained a strong upward trajectory. However, after reaching around 3128, its momentum has visibly slowed, with multiple signs of pullbacks emerging within the short-term structure.
From the candlestick chart, it’s evident that gold has faced repeated rejection signals above 3125, characterized by long upper shadows. The 3125 level has now formed a notable resistance zone and appears to be acting as a short-term consolidation high. This price action increases the likelihood of a potential top formation.
Moreover, gold’s recent strength is largely attributed to growing concerns of a global trade war sparked by Trump’s tariff policies, prompting investors to rotate out of risk assets like equities and into safe-haven assets such as gold. However, if Trump softens his stance on the tariffs or adopts a more diplomatic approach to maintain confidence in the U.S. dollar, risk appetite may recover. This would likely drive funds back into equities and other risk assets, leading to an outflow from gold.
For gold trading, I prefer to avoid aggressively chasing long positions at this stage, as downside risks persist. If gold fails to decisively break through the 3125-3135 resistance zone, the bullish momentum may weaken, increasing the likelihood of a downward move. If gold break below the 3100 level during a pullback, it could accelerate further declines, with potential targets in the 3095-3085 range.
The trading strategy verification accuracy rate is more than 90%; one step ahead, exclusive access to trading strategies and real-time trading settings

GOLD ROUTE MAP UPDATEHey Everyone,
A fantastic start to the week with our chart idea playing out perfectly inline with our trading plans.
We started the day with our Bullish target 3090 hit, followed with 3103 and then cross and lock confirmation to complete 3117. We also got the cross and lock above 3117 to open 3128 and just fell short of a pip. We will keep this full gap in mind, as we continue with our plans to buy dips
Rejection at this level will see lower Goldlturns tested and likely continue to see bounces on the weighted Goldturn levels, which we can use inline with our plans to buy dips.
We will keep the above in mind when taking buys from dips. Our updated levels and weighted levels will allow us to track the movement down and then catch bounces up.
We will continue to buy dips using our support levels taking 30 to 40 pips. As stated before each of our level structures give 20 to 40 pip bounces, which is enough for a nice entry and exit. If you back test the levels we shared every week for the past 24 months, you can see how effectively they were used to trade with or against short/mid term swings and trends.
BULLISH TARGET
3090 - DONE
EMA5 CROSS AND LOCK ABOVE 3090 WILL OPEN THE FOLLOWING BULLISH TARGET
3103 - DONE
EMA5 CROSS AND LOCK ABOVE 3103 WILL OPEN THE FOLLOWING BULLISH TARGET
3117 - DONE
EMA5 CROSS AND LOCK ABOVE 3117 WILL OPEN THE FOLLOWING BULLISH TARGET
3128
BEARISH TARGETS
3074
EMA5 CROSS AND LOCK BELOW 3074 WILL OPEN THE FOLLOWING BEARISH TARGET
3055
EMA5 CROSS AND LOCK BELOW 3055 WILL OPEN THE FOLLOWING BEARISH TARGET
3039
EMA5 CROSS AND LOCK BELOW 3039 WILL OPEN THE FOLLOWING BEARISH TARGET
3020
EMA5 CROSS AND LOCK BELOW 3020 WILL OPEN THE SWING RANGE
SWING RANGE
2999 - 2985
As always, we will keep you all updated with regular updates throughout the week and how we manage the active ideas and setups. Thank you all for your likes, comments and follows, we really appreciate it!
Mr Gold
GoldViewFX

Short gold, pullback to 3110-3095 zoneToday gold rebounded sharply after falling back to around 3076. The current highest rebound is around 3128. The current highest rebound is around 3128. Although part of the reason is due to the support of the market's risk aversion, I think it is more of a catharsis of the market's bullish sentiment.
So at this time, we should not chase long gold; because with the sharp rebound of gold, the risk of going long is gradually accumulating; secondly, we can refer to the trend of silver. After reaching the high point, it has begun to fall. I think gold may refer to the trend of silver and choose to fall in the short term.
Therefore, in terms of short-term trading, you may wish to consider shorting gold in the 3125-3135 zone, and the 3105-3095 zone is the first focus of our attention to long gold levels after a short-term correction.
You must keep your trading mind active, only in this way can you avoid too many stupid trading signals.The trading strategy verification accuracy rate is more than 90%; one step ahead, exclusive access to trading strategies and real-time trading settings

Expect gold to retreat to the 3100-3090 zoneOn a crazy Monday, gold fell back to around 3076 and then rebounded, and continued to rise to around 3128. It has now fallen back slightly and is fluctuating in a narrow range around 3120!
Although gold does maintain a strong position at present, what makes me more alert is that once gold retreats $3-5, it will be enough to make more buyers crazy and actively rush into gold long transactions. This is an extremely dangerous signal in my opinion! Because if with the withdrawal of large funds and panic selling, more bulls will be defeated.
So I explicitly refuse to chase long gold above 3120, because as gold rises rapidly, the risk of going long is gradually accumulating, so the liquidity of gold is gradually weakening, so gold may need to retreat more to increase liquidity before continuing to rise! And if the tariff policy introduced on April 2 is carried out in a more moderate way, then market sentiment will be greatly eased, and gold may also collapse.
So I think in short-term trading, we can still short gold in batches in the 3125-3135 zone, and expect gold to at least fall back to the 3100-3090 zone.

GOLD 1H CHART ROUTE MAP & TRADING PLAN FOR THE WEEKHey Everyone,
Please see our updated 1h chart levels and targets for the coming week.
We are seeing price play between two weighted levels with a gap above at 3090 and a gap below at 3074. We will need to see ema5 cross and lock on either weighted level to determine the next range.
We will see levels tested side by side until one of the weighted levels break and lock to confirm direction for the next range.
We will keep the above in mind when taking buys from dips. Our updated levels and weighted levels will allow us to track the movement down and then catch bounces up.
We will continue to buy dips using our support levels taking 30 to 40 pips. As stated before each of our level structures give 20 to 40 pip bounces, which is enough for a nice entry and exit. If you back test the levels we shared every week for the past 24 months, you can see how effectively they were used to trade with or against short/mid term swings and trends.
BULLISH TARGET
3090
EMA5 CROSS AND LOCK ABOVE 3090 WILL OPEN THE FOLLOWING BULLISH TARGET
3103
EMA5 CROSS AND LOCK ABOVE 3103 WILL OPEN THE FOLLOWING BULLISH TARGET
3117
EMA5 CROSS AND LOCK ABOVE 3117 WILL OPEN THE FOLLOWING BULLISH TARGET
3128
BEARISH TARGETS
3074
EMA5 CROSS AND LOCK BELOW 3074 WILL OPEN THE FOLLOWING BEARISH TARGET
3055
EMA5 CROSS AND LOCK BELOW 3055 WILL OPEN THE FOLLOWING BEARISH TARGET
3039
EMA5 CROSS AND LOCK BELOW 3039 WILL OPEN THE FOLLOWING BEARISH TARGET
3020
EMA5 CROSS AND LOCK BELOW 3020 WILL OPEN THE SWING RANGE
SWING RANGE
2999 - 2985
As always, we will keep you all updated with regular updates throughout the week and how we manage the active ideas and setups. Thank you all for your likes, comments and follows, we really appreciate it!
Mr Gold
GoldViewFX

GOLD DAILY CHART MID/LONG TERM UPDATEHey Everyone,
This is an update on our daily chart idea that we are now tracking for a while now. If you have only started following us, please read the updates below at the bottom from previous weeks to see how effectively we have been tracking this.
Now after completing the target to the channel top we stated that if we see ema5 lock outside the channel then we will look for support outside the channel on the channel top for a continuation, which played out perfectly, as the channel top after the breakout provided support for a continuation.
We then stated and expected price to play between 3052 and 3007 until we see a break to confirm our next range. We got the test on 3007 with no body close or ema5 lock, which confirmed the rejection and the bounce perfectly into 3052, which then followed with the body close above 3052 opening the range above, giving a nice clean run of over 300 pips. Gap remains open and ema5 lock will only further confirm this but we are happy with the run already and will now continue to buy from dops only.
This is the beauty of our Goldturn channels, which we draw in our unique way, using averages rather than price. This enables us to identify fake-outs and breakouts clearly, as minimal noise in the way our channels are drawn.
We will use our smaller timeframe analysis on the 1H and 4H chart to buy dips from the weighted Goldturns for 30 to 40 pips clean. Ranging markets are perfectly suited for this type of trading, instead of trying to hold longer positions and getting chopped up in the swings up and down in the range.
We will keep the above in mind when taking buys from dips. Our updated levels and weighted levels will allow us to track the movement down and then catch bounces up using our smaller timeframe ideas.
Our long term bias is Bullish and therefore we look forward to drops from rejections, which allows us to continue to use our smaller timeframes to buy dips using our levels and setups.
Buying dips allows us to safely manage any swings rather then chasing the bull from the top.
Thank you all for your likes, comments and follows, we really appreciate it!
Mr Gold
GoldViewFX
OLD UPDATES ON THIS CHART IDEA
MARCH 23RD WEEK UPDATE
The half line of our unique channel gave the perfect bounce into the next axis target at 2904, inline with our plans to buy dips just like we stated. We now have a body close once again with ema5 cross and lock above 2904 leaving the range above open. We will continue to look for support at the ascending half-line of the channel, as we climb into the range.
PREVIOUS WEEKS UPDATE
After completing our Bullish targets we stated that the channel top will act as resistance confirmed with ema5 rejection. A break of the channel top with ema5 would confirm a continuation and failure would confirm rejection. This allowed us to identify true breakouts against fake outs.
We also stated that we need to keep in mind the channel half line below to establish floor to provide support for the range, should we continue to track further up. A break below the half line will open the lower part of the channel to establish floor on the channel bottom. The safest way to track this movement is by buying dips.
- Once again this played out perfectly as we got the rejection on the channel top followed with the channel half line test, which gave the perfect bounce like we stated. We will now either look for a continuation from this bounce or a cross and lock below the half line for a break into the lower channel floor.

GOLD WEEKLY CHART MID/LONG TERM ROUTE MAPHey Everyone,
Please see update on our weekly chart idea, that we have been tracking from last week since completing our previous long range/term weekly chart idea.
Last week we stated that we were seeing a candle break above the channel half-line and will need ema5 to follow to confirm the break out for a continuation above. We got the cross and breakout, which gave a nice push up now heading towards 3094 and just fell short leaving this gap open.
We have a small detachment to ema5 lagging also potentially due for a correction. The play range on the weekly chart is 2943 below and 3094 above. We will look for ema5 lock or body close above or below to confirm the next mid to long term range.
This is the beauty of our channels, which we draw in our unique way, using averages rather than price. This enables us to identify fake-outs and breakouts clearly, as minimal noise in the way our channels are drawn.
Thank you all for your likes, comments and follows, we really appreciate it!
Mr Gold
GoldViewFX

GOLD ROUTE MAP UPDATEHey Everyone,
Another awesome finish to the week with our charts idea playing out to perfection!!!
After completing our 3050 target yesterday, we got our cross and lock above 3050 opening 3065, followed with a further cross and lock above 3065 opening 3080, Both 3065 and 3080 were completed today for a perfect finish.
We will now need a cross and lock above 3080 for a continuation into the next Goldturn or failure to lock will see rejections into the lower Goldturns.
BULLISH TARGET
3032 - DONE
EMA5 CROSS AND LOCK ABOVE 3032 WILL OPEN THE FOLLOWING BULLISH TARGET
3050 - DONE
EMA5 CROSS AND LOCK ABOVE 3050 WILL OPEN THE FOLLOWING BULLISH TARGET
3065 - DONE
EMA5 CROSS AND LOCK ABOVE 3065 WILL OPEN THE FOLLOWING BULLISH TARGET
3080 - DONE
EMA5 CROSS AND LOCK ABOVE 3080 WILL OPEN THE FOLLOWING BULLISH TARGET
3097
BEARISH TARGETS
3015 - DONE
We will now come back Sunday with our updated Multi time-frame analysis, Gold route map and trading plans for the week ahead and also a new Daily chart long term chart idea, now that this one is complete.
Have a smashing weekend!! And once again, thank you all for your likes, comments and follows, we really appreciate it!
Mr Gold
GoldViewFX

Gold Approaches 3100, Short Opportunity EmergesGold has reached a high of around 3085, now just a step away from the 3100 level. However, for short-term trading, I view the 3085-3105 range as an ideal zone to consider short positions on gold.
📍Short-Term Trading Strategy:
Consider scaling into short positions within the 3085-3105 range. Pay close attention to position sizing and risk management when setting up trades.
📍Key Support Levels to Watch:
-First target: 3065-3055
-Second target: 3045-3040
The trading strategy verification accuracy rate is more than 90%; one step ahead, exclusive access to trading strategies and real-time trading settings

Gold trading zones: 28-MAR-2025Today’s Gold trading zones: For educational purposes only, use at your own risk.

GOLD ROUTE MAP UPDATEHey Everyone,
A Piptastic day on the markets today with the breakout finally taking off, perfectly inline with our plans to buy dips and then into our Bullish targets.
We had 3 tests on our Bullish target at 3032 this week and then finally a cross and lock opening 3050, which was hit perfectly. We will now need a cross and lock above 3050 for a continuation into the next Goldturn or failure to lock will see rejections into the lower Goldturns for the bounces inline with our plans to buy dips.
We will keep the above in mind when taking buys from dips. Our updated levels and weighted levels will allow us to track the movement down and then catch bounces up.
We will continue to buy dips using our support levels taking 30 to 40 pips. As stated before each of our level structures give 20 to 40 pip bounces, which is enough for a nice entry and exit. If you back test the levels we shared every week for the past 24 months, you can see how effectively they were used to trade with or against short/mid term swings and trends.
BULLISH TARGET
3032 - DONE
EMA5 CROSS AND LOCK ABOVE 3032 WILL OPEN THE FOLLOWING BULLISH TARGET
3050 - DONE
EMA5 CROSS AND LOCK ABOVE 3050 WILL OPEN THE FOLLOWING BULLISH TARGET
3065
EMA5 CROSS AND LOCK ABOVE 3065 WILL OPEN THE FOLLOWING BULLISH TARGET
3080
EMA5 CROSS AND LOCK ABOVE 3080 WILL OPEN THE FOLLOWING BULLISH TARGET
3097
BEARISH TARGETS
3015 - DONE
EMA5 CROSS AND LOCK BELOW 3015 WILL OPEN THE FOLLOWING BEARISH TARGET
2999
EMA5 CROSS AND LOCK BELOW 2999 WILL OPEN THE FOLLOWING BEARISH TARGET
2978
EMA5 CROSS AND LOCK BELOW 2978 WILL OPEN THE SWING RANGE
SWING RANGE
2950 - 2927
As always, we will keep you all updated with regular updates throughout the week and how we manage the active ideas and setups. Thank you all for your likes, comments and follows, we really appreciate it!
Mr Gold
GoldViewFX

Gold analysis: 27-MAR-2025Good morning, traders! Today's Gold analysis will help you achieve your trading goals. Let's work together towards success.

GOLD ROUTE MAP UPDATEHey Everyone,
Another great day on the markets today, allowing us to bounce between the Goldturns, inline with our plans to buy dips. Not much to report as we are seeing Gold range sideways consolidating ready for a breakout.
We still have the gap left open at 2999, which fell short by a few pips. We will continue to use the lower Goldturns to buy dips until we see the weighted levels cross and lock to confirm the next range. Failure to break 3032 will keep seeing rejections into the lower Goldturns for the bounces.
We will keep the above in mind when taking buys from dips. Our updated levels and weighted levels will allow us to track the movement down and then catch bounces up.
We will continue to buy dips using our support levels taking 30 to 40 pips. As stated before each of our level structures give 20 to 40 pip bounces, which is enough for a nice entry and exit. If you back test the levels we shared every week for the past 24 months, you can see how effectively they were used to trade with or against short/mid term swings and trends.
BULLISH TARGET
3032 - DONE
EMA5 CROSS AND LOCK ABOVE 3032 WILL OPEN THE FOLLOWING BULLISH TARGET
3050
EMA5 CROSS AND LOCK ABOVE 3050 WILL OPEN THE FOLLOWING BULLISH TARGET
3065
EMA5 CROSS AND LOCK ABOVE 3065 WILL OPEN THE FOLLOWING BULLISH TARGET
3080
EMA5 CROSS AND LOCK ABOVE 3080 WILL OPEN THE FOLLOWING BULLISH TARGET
3097
BEARISH TARGETS
3015 - DONE
EMA5 CROSS AND LOCK BELOW 3015 WILL OPEN THE FOLLOWING BEARISH TARGET
2999
EMA5 CROSS AND LOCK BELOW 2999 WILL OPEN THE FOLLOWING BEARISH TARGET
2978
EMA5 CROSS AND LOCK BELOW 2978 WILL OPEN THE SWING RANGE
SWING RANGE
2950 - 2927
As always, we will keep you all updated with regular updates throughout the week and how we manage the active ideas and setups. Thank you all for your likes, comments and follows, we really appreciate it!
Mr Gold
GoldViewFX

XAU/USD 26 March 2025 Intraday AnalysisH4 Analysis:
-> Swing: Bullish.
-> Internal: Bullish.
Bias and analysis remains the same as analysis dated 23 March 2025.
Price has printed a bearish CHoCH following printing further all time highs.
Price is now trading within an established internal range. I will however continue to monitor price.
Intraday Expectation:
Price to trade down to either discount of internal 50% EQ, or nested Daily and H4 demand levels before targeting weak internal high priced at 3,057.590.
Note:
With the Federal Reserve's dovish stance and persisting geopolitical uncertainties, heightened volatility in Gold is expected to continue. Traders should proceed with caution and adjust risk management strategies in this high-volatility environment.
Price could also be driven by President Trump's policies, geopolitical moves and economic decisions which are sparking uncertainty.
H4 Chart:
M15 Analysis:
-> Swing: Bullish.
-> Internal: Bearish.
Analysis and bias remains the same as analysis dated 24 March 2025.
As per analysis dated 19 March 2025 whereby I mentioned as an alternative scenario that internal range has significantly narrowed. All HTF's require a pullback, therefore, it would be completely viable if price printed a bearish iBOS.
This is how price printed, by printing a bearish iBOS.
Price has yet to print a bullish CHoCH to indicate bullish pullback phase initiation, however, price has traded into premium of 50% internal EQ, therefore, I am happy to confirm internal range.
Intraday Expectation:
Price has traded in to premium of 50% EQ and has mitigated M15 supply zone.
Technically, price to target weak internal low priced at 2,999.465.
Note:
With the Federal Reserve maintaining a dovish stance and ongoing geopolitical tensions, volatility in Gold prices is expected to remain elevated. Traders should exercise caution, adjust risk management strategies, and stay prepared for potential price whipsaws in this high-volatility environment.
M15 Chart:

Gold Faces Repeated Rejections, Bearish Outlook RemainsAlthough gold has yet to confirm a significant downtrend, it has faced multiple rejections around the 3030-3040 resistance zone in recent sessions. Notably, after touching 3036 yesterday, gold experienced a sharp pullback, forming a long upper shadow on the candlestick chart. This price action has diminished the supportive effect of the underlying W-bottom structure.
If gold continues to struggle to break above the 3030-3040 zone, the current seemingly strong price action may prove to be a false signal, merely a setup for a subsequent decline. Additionally, with geopolitical risks easing and no significant fundamental drivers supporting further upside, I remain optimistic about a bearish continuation in gold.
We can consider scaling into short positions within the 3028-3038 range, patiently targeting a retest of the 3010-3000 zone. A confirmed break below 3000 could accelerate further downside toward the 2995-2985 region.
I would make more detailed trading plans and trading signals every day according to the real-time market situation, which is also the testimony of every successful transaction and profit of mine; the article has a certain lag, if you want to copy the trading signals to make a profit, or master independent trading skills and thinking, you can choose to join the channel at the bottom of the article

Gold is expected to rise to the 3030-3040 zone againGold encountered a clear rejection signal after reaching around 3036, indicating the presence of resistance and a technical need to retest support. Currently, gold is undergoing this support retest.
Within the current structure, gold has established a notable W-bottom pattern, with key support formed around the 3000 and 3003 levels. This structural support remains relatively strong. If gold manages to hold above the 3015-3005 support zone during the retest, a renewed upward move is likely. In that scenario, gold could resume its ascent, potentially retesting the 3030-3040 resistance range.
So in terms of short-term trading, if gold pulls back to the 3015-3005 zone, we can consider going long on gold in moderation.I would make more detailed trading plans and trading signals every day according to the real-time market situation, which is also the testimony of every successful transaction and profit of mine; the article has a certain lag, if you want to copy the trading signals to make a profit, or master independent trading skills and thinking, you can choose to join the channel at the bottom of the article

Gold trading insights: 26-MAR-2025Gold trading insights: Not signals, but informative zones to aid your decision-making. Please note: These zones are not trading advice. Use them as a starting point for your own analysis.

GOLD ROUTE MAP UPDATEHey Everyone,
Another great day on the markets today with out plans to buy dips playing out perfectly. We had the gap left open at 2999 yesterday, which had the move down but just fell short of the full gap. We were able to use the dip to ride back up to our bullish target 3032 once again.
No further lock above 3032 confirmed the rejection again. We are looking for this level to break to confirm a continuation. Failure to break this level will keep seeing rejections into the lower Goldturns for the bounces. We also need to keep in mind the full gap at 2999, inline with our plans to buy dips.
We will keep the above in mind when taking buys from dips. Our updated levels and weighted levels will allow us to track the movement down and then catch bounces up.
We will continue to buy dips using our support levels taking 30 to 40 pips. As stated before each of our level structures give 20 to 40 pip bounces, which is enough for a nice entry and exit. If you back test the levels we shared every week for the past 24 months, you can see how effectively they were used to trade with or against short/mid term swings and trends.
BULLISH TARGET
3032 - DONE
EMA5 CROSS AND LOCK ABOVE 3032 WILL OPEN THE FOLLOWING BULLISH TARGET
3050
EMA5 CROSS AND LOCK ABOVE 3050 WILL OPEN THE FOLLOWING BULLISH TARGET
3065
EMA5 CROSS AND LOCK ABOVE 3065 WILL OPEN THE FOLLOWING BULLISH TARGET
3080
EMA5 CROSS AND LOCK ABOVE 3080 WILL OPEN THE FOLLOWING BULLISH TARGET
3097
BEARISH TARGETS
3015 - DONE
EMA5 CROSS AND LOCK BELOW 3015 WILL OPEN THE FOLLOWING BEARISH TARGET
2999
EMA5 CROSS AND LOCK BELOW 2999 WILL OPEN THE FOLLOWING BEARISH TARGET
2978
EMA5 CROSS AND LOCK BELOW 2978 WILL OPEN THE SWING RANGE
SWING RANGE
2950 - 2927
As always, we will keep you all updated with regular updates throughout the week and how we manage the active ideas and setups. Thank you all for your likes, comments and follows, we really appreciate it!
Mr Gold
GoldViewFX

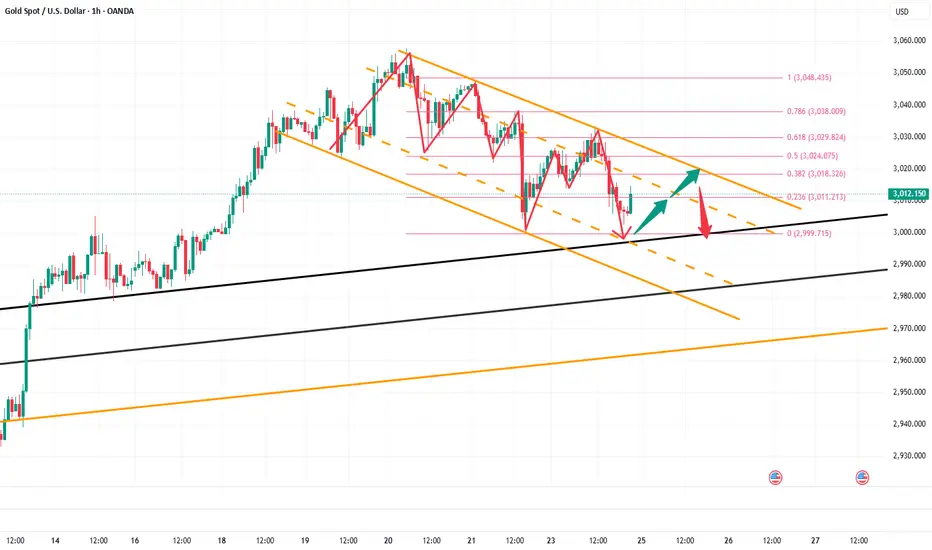
Gold Likely to Extend Decline Toward the 2995-2985 ZoneGold encountered resistance and pulled back after reaching around 3026 during the rebound, failing to break the descending channel effectively. In the short term, bearish momentum remains dominant. On the daily chart, gold has closed with three consecutive bearish candlesticks, it weakens rebound expectations and suggests further downside remains possible.
The key short-term level to watch is around 3010. If gold breaks below this level during the pullback, the downtrend structure will become more pronounced. This would likely lead to another test of the 3000 level, with further downside potential extending toward the 2995-2985 range.
I remain committed to shorting gold on rebounds. My primary plan is to enter short positions within the 3020-3030 range. I will make more detailed trading plans and trading signals every day according to the real-time market situation, which is also the testimony of every successful transaction and profit of mine; the article has a certain lag, if you want to copy the trading signals to make a profit, or master independent trading skills and thinking, you can choose to join the channel at the bottom of the article

The rebound presents a perfect opportunity to short gold.📍Gold has once again rebounded to the 3020-3025 range in the short term. You might think the bulls have regained control, but I see this rebound as a prime opportunity to short gold.
📍Currently, a new descending channel has formed within gold’s short-term structure. Despite multiple rebound attempts, the price has failed to break above this channel, further reinforcing its downward pressure. Additionally, on the daily chart, gold has printed three consecutive bearish candlesticks, undermining bullish sentiment and weakening confidence. This has also diminished the effectiveness of the 3000 support level, increasing the likelihood of further downside.
🔎Trade Idea:
Xauusd: Sell at 3015-3025
TP:3005-2995
SL:Adjust according to risk tolerance.
📩Trading means that everything has results and everything has feedback. I have been committed to market trading and trading strategy sharing, striving to improve the winning rate of trading and maximize profits. If you want to copy trading signals to make a profit, or master independent trading skills and thinking, you can follow the channel at the bottom of the article to copy trading strategies and signals

The downward channel appears, or there will be a deep callback📍Gold's current upward momentum appears weak, with signs of a descending channel forming in the short-term technical structure. If gold fails to decisively break through the 3015-3025 resistance zone, it will confirm and reinforce the descending channel pattern, exerting further technical pressure on the metal.
📍Moreover, if gold breaks below the critical 3000 level during its decline, it would severely undermine bullish confidence, triggering further downside. In this scenario, the downside potential would expand, with gold likely extending its decline toward the 2990-2980 support zone.
🔎Trade Idea:
Xauusd: Sell at 3015-3025
TP:3005-2995
SL:Adjust according to risk tolerance.
📩Trading means that everything has results and everything has feedback. I have been committed to market trading and trading strategy sharing, striving to improve the winning rate of trading and maximize profits. If you want to copy trading signals to make a profit, or master independent trading skills and thinking, you can follow the channel at the bottom of the article to copy trading strategies and signals

Short gold at the right time after rebound📍Gold experienced a sharp decline to around 3002 in the short term — did it catch you off guard? Despite the rapid drop, I remained committed to my trading logic and strategy. As long as gold holds above the 3005-2995 support zone, a rebound toward the 3015 level remains likely. After stabilizing, gold has already rebounded above 3014, nearly reaching our target zone of 3015. In response, we opted to manually close our positions to lock in profits.
📍Looking ahead, our primary focus will be on the 3015-3025 resistance zone. In the short term, gold has shown signs of forming a descending channel structure. If it fails to decisively break above the 3015-3025 zone and invalidate the downtrend channel, there remains a possibility of a retest of the 3000 level, with further downside potential toward the 2995-2985 range.
🔎Trade Idea:
Xauusd: Sell at 3015-3025
TP:3010-3000
SL:Adjust according to risk tolerance.
📩Trading means that everything has results and everything has feedback. I have been committed to market trading and trading strategy sharing, striving to improve the winning rate of trading and maximize profits. If you want to copy trading signals to make a profit, or master independent trading skills and thinking, you can follow the channel at the bottom of the article to copy trading strategies and signals