Short gold? No, I choose to buy gold📍Gold Plunges to Around 3006 — Is This Really a Good Opportunity to Chase Shorts? To be frank, despite the sharp short-term decline in gold, bullish resilience remains evident. As long as the price holds above the 3000-2995 support zone, the defensive line remains strong and unbroken. Therefore, I don’t consider chasing shorts a prudent decision at this stage. On the contrary, the presence of strong buying interest and solid support below significantly increases my preference for long positions in gold.
🔎Trade Idea:
Xauusd: Buy at 3015-3005
TP:3025-3035
SL:Adjust according to risk tolerance.
📩Trading means that everything has results and everything has feedback. I have been committed to market trading and trading strategy sharing, striving to improve the winning rate of trading and maximize profits. If you want to copy trading signals to make a profit, or master independent trading skills and thinking, you can follow the channel at the bottom of the article to copy trading strategies and signals
Goldtradingstrategy

GOLD ROUTE MAP UPDATEHey Everyone,
Great start to the week with our chart idea playing out as analysed.
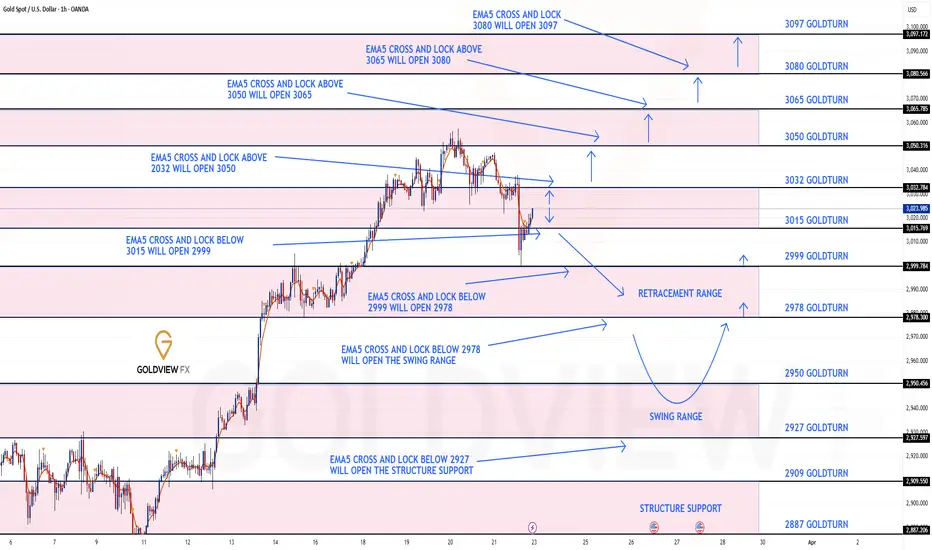
We got our Bullish target hit at 3032 with no cross and lock above confirming the rejection after the hit. We also got our Bearish target hit at 3015 now also following with a cross and lock leaving 2999 Goldturn open.
We will keep the above in mind when taking buys from dips. Our updated levels and weighted levels will allow us to track the movement down and then catch bounces up.
We will continue to buy dips using our support levels taking 30 to 40 pips. As stated before each of our level structures give 20 to 40 pip bounces, which is enough for a nice entry and exit. If you back test the levels we shared every week for the past 24 months, you can see how effectively they were used to trade with or against short/mid term swings and trends.
BULLISH TARGET
3032 - DONE
EMA5 CROSS AND LOCK ABOVE 3032 WILL OPEN THE FOLLOWING BULLISH TARGET
3050
EMA5 CROSS AND LOCK ABOVE 3050 WILL OPEN THE FOLLOWING BULLISH TARGET
3065
EMA5 CROSS AND LOCK ABOVE 3065 WILL OPEN THE FOLLOWING BULLISH TARGET
3080
EMA5 CROSS AND LOCK ABOVE 3080 WILL OPEN THE FOLLOWING BULLISH TARGET
3097
BEARISH TARGETS
3015 - DONE
EMA5 CROSS AND LOCK BELOW 3015 WILL OPEN THE FOLLOWING BEARISH TARGET
2999
EMA5 CROSS AND LOCK BELOW 2999 WILL OPEN THE FOLLOWING BEARISH TARGET
2978
EMA5 CROSS AND LOCK BELOW 2978 WILL OPEN THE SWING RANGE
SWING RANGE
2950 - 2927
As always, we will keep you all updated with regular updates throughout the week and how we manage the active ideas and setups. Thank you all for your likes, comments and follows, we really appreciate it!
Mr Gold
GoldViewFX

THE KOG REPORT THE KOG REPORT:
In last week’s KOG Report we said we would anticipate a potential curveball and that being that price may just support on the open at the immediate support level and give the move upside into the 3010 and above that 3020 region which was achieved. We then updated traders with the FOMC report suggesting a further move upside into the 3050-55 region which is where we suggested the potential short will come from.
After the push up into the level and then some accumulation, Friday gave us the volume we needed to break away from the range and complete the move downside to end the week.
Again, nearly all of our bias level targets were completed, the bias level worked well, Excalibur performed well and the red box indi’s worked a dream, even in the choppy market conditions.
So, what can we expect in the week ahead?
We have an issue with gold at the moment, although it’s broken the immediate range, it’s still above 3000 with a larger range low around the 2990 and below that 2970-75 region. That potential swing point below is an area of interest for us this week and leading up towards the end of the month. For that reason, if we can support at the first red box below, and continue the move that started on Friday up into those 3025, 3030 and above that 3035-7 price points we’ll want to monitor this careful for a reversal to form. If we can get it, an opportunity to add or take the short may be available to traders, this time in attempt to break below the 3000 level into those lower support level mentioned and shown on the chart, which also correspond with the red boxes. As many of you have seen over the last year or so, we’ve been sharing these indicator boxes on the 4H for the wider community for free, as they are extremely powerful in identifying turning points and entry and exit points for traders. So let’s keep an eye on them this week for the break and closes, RIP’s and rejections.
We’re mostly looking for this one move to complete, however, there has to be a flip! This week, the flip is breaking above that 3035-37 level which will also be this week’s bias level. If we do breach, we’ll be looking at this to then continue higher, breaking 3050 and then resuming the move into the active Excalibur targets above which ideally, we don't want to see happen yet!
So, we know we want higher, what we do want though is better entry levels for the longs, until then, if we can capture these short trades we’ll of course gratefully take them.
KOG’s bias for the week:
Bearish below 3040 with targets below 3010, 3006, 2997, 2985 and below that 2978
Bullish on break of 3040 with targets above 3050, 3055, 3063 and above that 3067
RED BOXES:
Break above 3037 for 3040, 3047, 3050, 3055, 3063 and 3066 in extension of the move
Break below 3010 for 3006, 3000, 2997, 2990 and 2985 in extension of the move
This should give you an idea of your levels, please use them!
Please do support us by hitting the like button, leaving a comment, and giving us a follow. We’ve been doing this for a long time now providing traders with in-depth free analysis on Gold, so your likes and comments are very much appreciated.
As always, trade safe.
KOG

Bearish Bias Under Head and Shoulders Formation📍Gold is currently leaning towards a bearish trend under the pressure of a well-defined head and shoulders pattern. Therefore, our primary trading approach remains focused on short positions.
📍In the short term, the key resistance to watch is in the 3030-3040 zone. However, it's worth noting that on Friday, gold quickly recovered most of its losses after testing the 3000 level, indicating the presence of strong buying interest and solid support below.
📍From a trading perspective, there is still an opportunity to capture profits from potential technical rebounds. The main support levels to monitor are:
📌3010-3000 as the initial support zone
📌2995 as the secondary support level
🔎Trade Idea:
1. Xauusd: Sell at 3035-3045
TP:3020-3010
SL:Adjust according to risk tolerance.
📎But if gold shows signs of holding support, a short-term rebound could provide opportunities for counter-trend trades.
2. Xauusd: Buy at 3015-3005
TP:3025-3035
SL:Adjust according to risk tolerance.
📩Trading means that everything has results and everything has feedback. I have been committed to market trading and trading strategy sharing, striving to improve the winning rate of trading and maximize profits. If you want to copy trading signals to make a profit, or master independent trading skills and thinking, you can follow the channel at the bottom of the article to copy trading strategies and signals

XAU/USD 24 March 2025 Intraday AnalysisH4 Analysis:
-> Swing: Bullish.
-> Internal: Bullish.
Bias and analysis remains the same as analysis dated 23 March 2025.
Price has printed a bearish CHoCH following printing further all time highs.
Price is now trading within an established internal range. I will however continue to monitor price.
Intraday Expectation:
Price to trade down to either discount of internal 50% EQ, or nested Daily and H4 demand levels before targeting weak internal high priced at 3,057.590.
Note:
With the Federal Reserve's dovish stance and persisting geopolitical uncertainties, heightened volatility in Gold is expected to continue. Traders should proceed with caution and adjust risk management strategies in this high-volatility environment.
Price could also be driven by President Trump's policies, geopolitical moves and economic decisions which are sparking uncertainty.
H4 Chart:
M15 Analysis:
-> Swing: Bullish.
-> Internal: Bearish.
As per analysis dated 19 March 2025 whereby I mentioned as an alternative scenario that internal range has significantly narrowed. All HTF's require a pullback, therefore, it would be completely viable if price printed a bearish iBOS.
This is how price printed, by printing a bearish iBOS.
Price has yet to print a bullish CHoCH to indicate bullish pullback phase initiation, however, price has traded into premium of 50% internal EQ, therefore, I am happy to confirm internal range.
Intraday Expectation:
Price has traded in to premium of 50% EQ and has mitigated M15 supply zone.
Technically, price to target weak internal low priced at 2,999.465.
Note:
With the Federal Reserve maintaining a dovish stance and ongoing geopolitical tensions, volatility in Gold prices is expected to remain elevated. Traders should exercise caution, adjust risk management strategies, and stay prepared for potential price whipsaws in this high-volatility environment.
M15 Chart:

Gold market analysis: 24-MAR-2025Good morning! Happy New Week! Happy New Day! Here's your daily Gold market analysis. Learn, grow, and trade wisely.

GOLD 1H CHART ROUTE MAP & TRADING PLAN FOR THE WEEKHey Everyone,
Please see our updated 1h chart levels and targets for the coming week.
We are seeing price play between two weighted levels with a gap above at 3032 and a gap below at 3015. We will need to see ema5 cross and lock on either weighted level to determine the next range.
We will see levels tested side by side until one of the weighted levels break and lock to confirm direction for the next range.
We will keep the above in mind when taking buys from dips. Our updated levels and weighted levels will allow us to track the movement down and then catch bounces up.
We will continue to buy dips using our support levels taking 30 to 40 pips. As stated before each of our level structures give 20 to 40 pip bounces, which is enough for a nice entry and exit. If you back test the levels we shared every week for the past 24 months, you can see how effectively they were used to trade with or against short/mid term swings and trends.
BULLISH TARGET
3032
EMA5 CROSS AND LOCK ABOVE 3032 WILL OPEN THE FOLLOWING BULLISH TARGET
3050
EMA5 CROSS AND LOCK ABOVE 3050 WILL OPEN THE FOLLOWING BULLISH TARGET
3065
EMA5 CROSS AND LOCK ABOVE 3065 WILL OPEN THE FOLLOWING BULLISH TARGET
3080
EMA5 CROSS AND LOCK ABOVE 3080 WILL OPEN THE FOLLOWING BULLISH TARGET
3097
BEARISH TARGETS
3015
EMA5 CROSS AND LOCK BELOW 3015 WILL OPEN THE FOLLOWING BEARISH TARGET
2999
EMA5 CROSS AND LOCK BELOW 2999 WILL OPEN THE FOLLOWING BEARISH TARGET
2978
EMA5 CROSS AND LOCK BELOW 2978 WILL OPEN THE SWING RANGE
SWING RANGE
2950 - 2927
As always, we will keep you all updated with regular updates throughout the week and how we manage the active ideas and setups. Thank you all for your likes, comments and follows, we really appreciate it!
Mr Gold
GoldViewFX
GOLD 4H CHART ROUTE MAP & TRADING PLAN FOR THE WEEKHey Everyone,
Please see our updated 4h chart levels and targets for the coming week.
We are seeing price play between two weighted levels with a gap above at 3045 and a gap below at 3018. We will need to see ema5 cross and lock on either weighted level to determine the next range.
We will see levels tested side by side until one of the weighted levels break and lock to confirm direction for the next range.
We will keep the above in mind when taking buys from dips. Our updated levels and weighted levels will allow us to track the movement down and then catch bounces up.
We will continue to buy dips using our support levels taking 30 to 40 pips. As stated before each of our level structures give 20 to 40 pip bounces, which is enough for a nice entry and exit. If you back test the levels we shared every week for the past 24 months, you can see how effectively they were used to trade with or against short/mid term swings and trends.
BULLISH TARGET
3045
EMA5 CROSS AND LOCK ABOVE 3045 WILL OPEN THE FOLLOWING BULLISH TARGET
3067
EMA5 CROSS AND LOCK ABOVE 3067 WILL OPEN THE FOLLOWING BULLISH TARGET
3089
EMA5 CROSS AND LOCK ABOVE 3089 WILL OPEN THE FOLLOWING BULLISH TARGET
3114
BEARISH TARGETS
3018
EMA5 CROSS AND LOCK BELOW 3018 WILL OPEN THE FOLLOWING BEARISH TARGET
2985
EMA5 CROSS AND LOCK BELOW 2985 WILL OPEN THE SWING RANGE
SWING RANGE
2947 - 2918
As always, we will keep you all updated with regular updates throughout the week and how we manage the active ideas and setups. Thank you all for your likes, comments and follows, we really appreciate it!
Mr Gold
GoldViewFX

GOLD DAILY CHART MID/LONG TERM UPDATEHey Everyone,
This is an update on our daily chart idea that we are now tracking for a while now. If you have only started following us, please read the updates below at the bottom from previous weeks to see how effectively we have been tracking this.
Last week we completed target to the channel top and stated that if we see ema5 lock outside the channel then we will look for support outside the channel on the channel top for a continuation.
- This played out perfectly with ema5 cross outside of the channel top and then the channel top provided support for a continuation. We are now seeing no candle body close or ema5 lock above 3052 confirming the rejection and expect to see play between 3007 and 3052 to break and confirm our next range.
This is the beauty of our Goldturn channels, which we draw in our unique way, using averages rather than price. This enables us to identify fake-outs and breakouts clearly, as minimal noise in the way our channels are drawn.
We will use our smaller timeframe analysis on the 1H and 4H chart to buy dips from the weighted Goldturns for 30 to 40 pips clean. Ranging markets are perfectly suited for this type of trading, instead of trying to hold longer positions and getting chopped up in the swings up and down in the range.
We will keep the above in mind when taking buys from dips. Our updated levels and weighted levels will allow us to track the movement down and then catch bounces up using our smaller timeframe ideas.
Our long term bias is Bullish and therefore we look forward to drops from rejections, which allows us to continue to use our smaller timeframes to buy dips using our levels and setups.
Buying dips allows us to safely manage any swings rather then chasing the bull from the top.
Thank you all for your likes, comments and follows, we really appreciate it!
Mr Gold
GoldViewFX
LAST WEEK UPDATE
The half line of our unique channel gave the perfect bounce into the next axis target at 2904, inline with our plans to buy dips just like we stated. We now have a body close once again with ema5 cross and lock above 2904 leaving the range above open. We will continue to look for support at the ascending half-line of the channel, as we climb into the range.
PREVIOUS WEEKS UPDATE
After completing our Bullish targets we stated that the channel top will act as resistance confirmed with ema5 rejection. A break of the channel top with ema5 would confirm a continuation and failure would confirm rejection. This allowed us to identify true breakouts against fake outs.
We also stated that we need to keep in mind the channel half line below to establish floor to provide support for the range, should we continue to track further up. A break below the half line will open the lower part of the channel to establish floor on the channel bottom. The safest way to track this movement is by buying dips.
- Once again this played out perfectly as we got the rejection on the channel top followed with the channel half line test, which gave the perfect bounce like we stated. We will now either look for a continuation from this bounce or a cross and lock below the half line for a break into the lower channel floor.

GOLD WEEKLY CHART MID/LONG TERM ROUTE MAPHey Everyone,
After tracking and completing our last weekly chart successfully we have now updated a new weekly chart idea to track our long term range and targets.
We are currently seeing a candle break above the channel half-line and will need ema5 to co=follow to confirm the break out for a continuation above.
However, we have a detachment to ema5 lagging also potentially due for a correction. The play range on the weekly chart is 2943 below and 3094 above. We will look for ema5 lock or body close above or below to confirm the next mid to long term range.
This is the beauty of our channels, which we draw in our unique way, using averages rather than price. This enables us to identify fake-outs and breakouts clearly, as minimal noise in the way our channels are drawn.
Thank you all for your likes, comments and follows, we really appreciate it!
Mr Gold
GoldViewFX

The Bear Awakens: A Perfectly Executed Short on Gold📍Over the past few days, I’ve consistently emphasized that the bear is on the verge of fully awakening, warmly inviting everyone to watch it dance. Today, gold has indeed pulled back to the 3000 level as anticipated, making our short position from the 3035-3045 range a resounding success!
📍Since gold has tested the 3000 level for the first time, a second test is highly likely. Therefore, the primary trading strategy remains focused on selling gold on rebounds. The head-and-shoulders formation continues to exert significant pressure, making a sustained breakout to the upside unlikely in the near term.
📍With this in mind, the resistance zone can be adjusted lower to 3025-3035. If gold fails to break through this region during its rebound, further downside movement is expected. In that case, gold will likely retest the 3000 level and could potentially breach it, extending losses towards the 2995-2985 range.
🔎Trade Idea:
Xauusd: Sell at 3025-3035
TP:3005-2995
SL:Adjust according to risk tolerance.
📩Trading means that everything has results and everything has feedback. I have been committed to market trading and trading strategy sharing, striving to improve the winning rate of trading and maximize profits. If you want to copy trading signals to make a profit, or master independent trading skills and thinking, you can follow the channel at the bottom of the article to copy trading strategies and signals

The bearish trend will continue📍Since the day before yesterday, I've been sincerely inviting everyone to watch the bear dance.Gold has decisively broken below the recent support zone at 3030-3026 and extended its decline to around 3021. Based on this price action, two key conclusions can be drawn:
1. 3057 is now confirmed as the current high.
2. Gold has successfully formed a head and shoulders pattern in the short term.
📍This indicates that bearish momentum remains strong and far from exhausted. Under the pressure of structural resistance, gold is likely to continue testing lower support levels around 3010-3000, with a possible extension toward 2995.
🔎Trade Idea:
Xauusd: Sell at 3035-3045
TP:3015-3005
SL:Adjust according to risk tolerance.
📩Trading means that everything has results and everything has feedback. I have been committed to market trading and trading strategy sharing, striving to improve the winning rate of trading and maximize profits. If you want to copy trading signals to make a profit, or master independent trading skills and thinking, you can follow the channel at the bottom of the article to copy trading strategies and signals

XAUUSD Analysis todayHello traders, this is a complete multiple timeframe analysis of this pair. We see could find significant trading opportunities as per analysis upon price action confirmation we may take this trade. Smash the like button if you find value in this analysis and drop a comment if you have any questions or let me know which pair to cover in my next analysis.

Boldly short gold, the bear has awakened!📌Bros, as mentioned in the previous article, Marvin invites you to grab a cup of coffee and quietly watch the dancing bears.
📍As I just said, if gold cannot break through the 3040-3050 area, it will build a head and shoulders structure in the short-term structure, and gold may accelerate downward to the 3020-3010 zone.
🔎Xauusd: @3040-3050 Sell
📩Trading means that everything has results and everything has feedback. I have been committed to market trading and trading strategy sharing, striving to improve the winning rate of trading and maximize profits. If you want to copy trading signals to make a profit, or master independent trading skills and thinking, you can follow the channel at the bottom of the article to copy trading strategies and signals

GOLD ROUTE MAP UPDATEHey Everyone,
Another Piptastic day on the charts with our analysis playing out perfectly.
After completing all our Bullish targets yesterday we confirmed the gap to 3049 remained open after cross and lock above 3029.
- This was hit perfectly today completing this target. No further cross and lock above 3049 confirmed the rejection into the lower Goldturn for the bounce just like we said!!
We will now see price play between both these Goldturns until we see a cross and lock on either level to confirm the next range.
We will keep the above in mind when taking buys from dips. Our updated levels and weighted levels will allow us to track the movement down and then catch bounces up.
We will continue to buy dips using our support levels taking 30 to 40 pips. As stated before each of our level structures give 20 to 40 pip bounces, which is enough for a nice entry and exit. If you back test the levels we shared every week for the past 24 months, you can see how effectively they were used to trade with or against short/mid term swings and trends.
BULLISH TARGET
2993 - DONE
EMA5 CROSS AND LOCK ABOVE 2993 WILL OPEN THE FOLLOWING BULLISH TARGET
3011 - DONE
EMA5 CROSS AND LOCK ABOVE 3011 WILL OPEN THE FOLLOWING BULLISH TARGET
3029 - DONE
EMA5 CROSS AND LOCK ABOVE 3029 WILL OPEN THE FOLLOWING BULLISH TARGET
3049 - DONE
EMA5 CROSS AND LOCK ABOVE 3049 WILL OPEN THE FOLLOWING BULLISH TARGET
3068
BEARISH TARGETS
2968
EMA5 CROSS AND LOCK BELOW 2968 WILL OPEN THE FOLLOWING BEARISH TARGET
2942
EMA5 CROSS AND LOCK BELOW 2942 WILL OPEN THE FOLLOWING BEARISH TARGET
2922
EMA5 CROSS AND LOCK BELOW 2922 WILL OPEN THE SWING RANGE
SWING RANGE
2906 - 2886
As always, we will keep you all updated with regular updates throughout the week and how we manage the active ideas and setups. Thank you all for your likes, comments and follows, we really appreciate it!
Mr Gold
GoldViewFX

Watch as the bears are about to dance!📍Bros, we must pay attention to the 3040-3050 area next. If gold cannot break through this area during the rebound, then the technical level may build a head and shoulders top structure, further stimulating the decline of gold. The market bullish factors for gold have all appeared. If there is no extra force to support the rise of gold, then the bears will fully wake up and may even go down to the 3020-3010 area.
📌So in terms of short-term trading, we can try to short gold in the 3040-3050 area.
🔎Xauusd:@3040-3050 Sell
📩Trading means that everything has results and everything has feedback. I have been committed to market trading and trading strategy sharing, striving to improve the winning rate of trading and maximize profits. If you want to copy trading signals to make a profit, or master independent trading skills and thinking, you can follow the channel at the bottom of the article to copy trading strategies and signals

Seize the callback opportunity to go long goldBros, after hitting a high near 3057, gold fell back as expected. It has now fallen back to around 3030.
📍Although the fall in gold was expected, the strength of the fall was less than expected. According to the current strength of the fall, gold may not be able to form an effective downward force. It is more likely to attract friends who missed the entry ticket in the early stage to enter the market again to buy gold;
📍After the breakthrough, there are many supports below. It may be difficult to break through the heavy support area in a short period of time. The primary support below is in the 3025-3015 area. We can try to buy gold with this area.
🔎Xauusd:@3030-3020 Buy
📩Trading means that everything has results and everything has feedback. I have been committed to market trading and trading strategy sharing, striving to improve the winning rate of trading and maximize profits. If you want to copy trading signals to make a profit, or master independent trading skills and thinking, you can follow the channel at the bottom of the article to copy trading strategies and signals

THE KOG REPORT - FOMCTHE KOG REPORT – FOMC
This is our view for FOMC, please do your own research and analysis to make an informed decision on the markets. It is not recommended you try to trade the event if you have less than 6 months trading experience and have a trusted risk strategy in place. The markets are extremely volatile, and these events can cause aggressive swings in price.
While gold is relatively new to this range we have to entail some caution if we’re even going to consider trading this FOMC. Markets are a little fragile, we’re at ATH’s and the moves are extremely aggressive. So, we’ll highlight the red box levels and the potential move we’ll be looking for, sticking to the extreme and key levels, ignoring the intermediate levels.
Looking at the chart we have a support region below 3010-15 which if spiked into and held can push this back up this time to break above 3030 and attempt to attack that 3050 region. That in our opinion would be the first point to start looking for price to exhaust, but it will only give us the flip so longer scalps are likely to be all we’ll get.
If we break above the 3055 region we’re likely to go higher giving us a red box resistance level of 3065-75. It’s this level we would ideally like to target from a lot lower down if we can get that entry. For that reason, we have given the level below on the break of 3010 sitting around 2990-80, we’ll have to wait and see, but if we can get down there a nice swing could present itself.
RED BOX INDICATOR:
Break above 3030 for 3050, 3055, 3063 and 3070 in extension of the move
Break below 3020 for 3912, 3006, 2996 and 2990 in extension of the move
Please do support us by hitting the like button, leaving a comment, and giving us a follow. We’ve been doing this for a long time now providing traders with in-depth free analysis on Gold, so your likes and comments are very much appreciated.
As always, trade safe.
KOG

How to Trade News!Heads up, everyone! The Federal Reserve's interest rate decision will be announced in one hour! Currently, gold is consolidating in a narrow range around the 3035 level. At this point, it's not advisable to enter short positions on gold just yet.
📍From a technical perspective, gold has formed an ascending triangle pattern. If it fails to break below the 3027-3025 support zone, the bullish momentum could persist, with an upside target in the 3045-3055 range. Therefore, it's best to hold off on aggressive short positions for now.
📍However, if gold, driven by the upcoming announcement, struggles to break above the 3045-3055 resistance area, 3045 may establish itself as a short-term top. In that scenario, short positions can be considered using the 3040-3050 zone as a resistance level.
🔎Xauusd:@3040-3050 Sell,TP:3030-3020;
📍On the other hand, if gold decisively breaks below the 3025-3020 support level, attention should be focused on the 3010-3000 range. Should gold find support and stabilize within this range, it may present a favorable opportunity to go long once again.
🔎Xauusd:@3010-3000 Buy, TP:3030-3040
📩Trading means that everything has results and everything has feedback. I have been committed to market trading and trading strategy sharing, striving to improve the winning rate of trading and maximize profits. If you want to copy trading signals to make a profit, or master independent trading skills and thinking, you can follow the channel at the bottom of the article to copy trading strategies and signals
GOLD ROUTE MAP UPDATEHey Everyone,
Once again our chart levels are being respected and playing out, as analysed in true level to level fashion.
After completing all our Bullish targets 2993, 3011 and 3029, all confirmed with cross and lock, we then confirmed a lock above 3029 opening 3049 yesterday. We got the nice move up but just short of the full gap, which then followed with a rejection into the lower Goldturn for the bounce, giving us plenty of opportunities to milk the bounces just like we stated.
We still have the gap remaining open and we are seeing price play between two weighted levels. We will now look for either level to be tested and broken with cross and lock to confirm the next range.
We will keep the above in mind when taking buys from dips. Our updated levels and weighted levels will allow us to track the movement down and then catch bounces up.
We will continue to buy dips using our support levels taking 30 to 40 pips. As stated before each of our level structures give 20 to 40 pip bounces, which is enough for a nice entry and exit. If you back test the levels we shared every week for the past 24 months, you can see how effectively they were used to trade with or against short/mid term swings and trends.
BULLISH TARGET
2993 - DONE
EMA5 CROSS AND LOCK ABOVE 2993 WILL OPEN THE FOLLOWING BULLISH TARGET
3011 - DONE
EMA5 CROSS AND LOCK ABOVE 3011 WILL OPEN THE FOLLOWING BULLISH TARGET
3029 - DONE
EMA5 CROSS AND LOCK ABOVE 3029 WILL OPEN THE FOLLOWING BULLISH TARGET
3049
EMA5 CROSS AND LOCK ABOVE 3049 WILL OPEN THE FOLLOWING BULLISH TARGET
3068
BEARISH TARGETS
2968
EMA5 CROSS AND LOCK BELOW 2968 WILL OPEN THE FOLLOWING BEARISH TARGET
2942
EMA5 CROSS AND LOCK BELOW 2942 WILL OPEN THE FOLLOWING BEARISH TARGET
2922
EMA5 CROSS AND LOCK BELOW 2922 WILL OPEN THE SWING RANGE
SWING RANGE
2906 - 2886
As always, we will keep you all updated with regular updates throughout the week and how we manage the active ideas and setups. Thank you all for your likes, comments and follows, we really appreciate it!
Mr Gold
GoldViewFX

Bears are about to revive, short gold!Gold has rebounded to around 3040 once again. It is undeniable that the risk of going long is gradually increasing. At this level, the primary strategy should be to avoid blindly chasing long positions in gold to mitigate the risk of a significant pullback.
Additionally, during the recent retracement, gold only briefly touched the 3023 level before rebounding. Given the insufficient depth of the pullback, this swift rebound suggests that gold may continue to test its short-term highs. Currently, there is no clear technical topping pattern, and the candlestick formations remain strong, indicating further upward potential. Gold could extend its gains toward the 3050-3060 range.
From a trading perspective, it may be prudent to consider short positions in the 3045-3055 range.Trading means that everything has results and everything has feedback. I have been committed to market trading and trading strategy sharing, striving to improve the winning rate of trading and maximize profits. If you want to copy trading signals to make a profit, or master independent trading skills and thinking, you can follow the channel at the bottom of the article to copy trading strategies and signals

Short gold with 2930-2940 zone as resistanceBros, the situation in the Middle East is turbulent again! Gold took advantage of the trend and continued to rise to around 3028. Stimulated by the news, gold's rise was obviously abnormal and showed a disorderly rise! This kind of price rise is actually very dangerous, so we can't directly chase gold. According to my expectations, the highest price of gold will only reach around 3040, so I think shorting gold with 2930-2940 zone as resistance is the best trading opportunity at the moment.
However, in the short term, the correction of gold may be smaller than expected because the market is enthusiastic about going long. So the first thing we should pay attention to below is the 3005-2995 zone.
Trading means that everything has results and everything has feedback. I have been committed to market trading and trading strategy sharing, striving to improve the winning rate of trading and maximize profits. If you want to copy trading signals to make a profit, or master independent trading skills and thinking, you can follow the channel at the bottom of the article to copy trading strategies and signals

Open your eyes and watch the bear dance!Bros, I have clearly pointed out in the last article update that gold will continue to rise and hit the 3030-3040 area, and the highest will only reach around 3040; gold has risen to this area as expected, and has reached a maximum of around 3038.
I have doubled my short position in gold around 3038; gold has risen sharply due to fundamental support and has seriously deviated from the technical side, so the faster gold rises, the more dangerous it is! After the market calms down, gold may experience a deep retracement.
So I’m looking forward to when the bears dance next! And I am always optimistic about gold falling back to the 3015-3005 area!
Trading means that everything has results and everything has feedback. I have been committed to market trading and trading strategy sharing, striving to improve the winning rate of trading and maximize profits. If you want to copy trading signals to make a profit, or master independent trading skills and thinking, you can follow the channel at the bottom of the article to copy trading strategies and signals
