Gold trading zones: 07-Jan-2025Today's Gold trading zones: A starting point for your market analysis.
Goldtradingstrategy

Gold prices continue to decline after a correction on Tuesday Gold prices continue to decline after a correction on Tuesday
When news of Trump's tariffs broke earlier, the US dollar fell nearly 1% and gold took the opportunity to turn higher and approach the 2650 level. However, given that the 2639 level was broken in the morning, it is difficult for gold to return to strength immediately. Therefore, it is necessary to close positions at this time and move to sell. The rise and fall of the market price has also been confirmed. my judgment.
Next, focus on the support line formed by the lows of 2610-2615. It is important to note that even if there is a price buffer in late trading, you can still consider selling around 2640. Pay attention to. the 2610-2615 support situation below. If there are signs of stability, you can strike back in time.
Gold trading tip: sell around 2640-2645 after a bounce SL 2652 TP 2620.
🚀 Trade with the professionals of THS - Wave Theory!
🔹 All trades are based on wave analysis.
🔹 Fixed stop loss and take profit for risk management.
🔹 100% automation: copy trades through CopyFX service.
🔹 Reliability and transparency: the results are confirmed by the market.
📈 Don't miss the chance to earn steadily!
👉 Connect to CopyFX with THS and start copying profitable trades right now!
💡 Details on our channel and in the app!

GOLD ROUTE MAP UPDATEHey Everyone,
Great start to the week with our plans to buy dips playing out, as analysed.
We started the day with the bearish target 2633 being hit, followed with a bounce allowing us to safely capture a clean 40 pips.
We did not chase any further, as we got the ema5 lock below 2633 opening 261. Our lock confirmed further movement was due down and just like we analysed another drop followed. The drop was just short of the full gap to 2611 and just above the retracement range, which followed with the bounce inline with our plans.
2611 is a weighted level and as long as we see no lock below 2611, we should see a continuation of the bounce into completing the Bullish gap above.
We will see levels tested side by side until one of the weighted levels break and lock to confirm direction for the next range.
We will keep the above in mind when taking buys from dips. Our updated levels and weighted levels will allow us to track the movement down and then catch bounces up.
We will continue to buy dips using our support levels taking 30 to 40 pips. As stated before each of our level structures give 20 to 40 pip bounces, which is enough for a nice entry and exit. If you back test the levels we shared every week for the past 24 months, you can see how effectively they were used to trade with or against short/mid term swings and trends.
BULLISH TARGET
2661
EMA5 CROSS AND LOCK ABOVE 2661 WILL OPEN THE FOLLOWING BULLISH TARGET
2681
EMA5 CROSS AND LOCK ABOVE 2681 WILL OPEN THE FOLLOWING BULLISH TARGET
2711
BEARISH TARGETS
2633 - DONE
EMA5 CROSS AND LOCK BELOW 2633 WILL OPEN THE FOLLOWING BEARISH TARGET
2611
EMA5 CROSS AND LOCK BELOW 2611 WILL OPEN THE FOLLOWING BEARISH TARGET
2593
EMA5 CROSS AND LOCK BELOW 2593 WILL OPEN THE SWING RANGE
SWING RANGE
2570 - 2551
As always, we will keep you all updated with regular updates throughout the week and how we manage the active ideas and setups. Thank you all for your likes, comments and follows, we really appreciate it!
Mr Gold
GoldViewFX

Buy gold!Bros, earlier today, we initiated our first trade by going long on gold around the 2628 level, and we have now closed our long position near 2647. While we didn’t capture the absolute peak, we still secured an easy profit of nearly 200 pips.
Currently, after touching the 2649 level, gold has slightly pulled back and is now trading around 2642. Despite gold briefly dipping to the 2625 level earlier today, the overall bullish structure remains intact. As I mentioned on Friday, short-term pullbacks in gold are merely corrections of the prior uptrend and serve to build momentum for further upside. Therefore, I continue to maintain a bullish bias in my trading approach.
Since gold has resumed its rebound, for the upcoming short-term trades, we can consider using the 2640-2635 zone as a support level and start going long on gold again!
Bros, do you believe gold will extend its rebound? If you’re interested in learning more detailed trading strategies and receiving additional trade signals, you can join the channel linked at the bottom of the article. Let’s make trading easier and turn profit-making into an enjoyable journey!

THE KOG REPORT THE KOG REPORT:
In last week's KOG Report we said we would look for two levels from the open to be attempted where we wanted to short the market. The first level of 2630-5 worked extremely well for us giving us a level to level, point to point short into the red box region and target level we had shared. This move completed a majority of our bearish targets apart from one, also giving us the opportunity to then long back up into the Excalibur targets we had above.
During the later part of the week we shared the updated chart and gave the levels again to attempt the short, and again, a pinpoint short came from the level we wanted and we closed the week with runners left on those trades.
Another decent week in Camelot, not only on Gold but also the other pairs we trade and analyse giving us a 15 out of 16 targets completed.
So, what can we expect from the week ahead?
To start, we have NFP towards the end of the week, so we’ll use this report for the first half of the week and then release the NFP KOG Report with our view per-event. After the bearish move on Friday, we’ll be looking for a base during the early sessions, potentially deeper into the 2625-30 region before then attempting the long trade back up to target the resistance levels. It’s those resistance levels 2640 and above that again the 2650-55 region that need to be monitored this week for the break, if held, further opportunities may be available to short again unless broken. We’re still in the larger range with key level support 2605 and resistance sitting way up at 2670-75 so it gives us some idea of the play.
If we do break above that 2550 level and hold with a close, we'll look higher again into the range high trading level to level.
KOG’s bias for the week:
Bullish above 2630 with targets above 2650, 2655 and above that 2667
Bearish below 2630 with targets below 2624, 2620, 2610 and below that 2604
RED BOXES:
Break above 2640 for 2646, 2650, 2659 and 2670 in extension of the move
Break below 2625 for 2620, 2617, 2610 and 2604 in extension of the move
Please do support us by hitting the like button, leaving a comment, and giving us a follow. We’ve been doing this for a long time now providing traders with in-depth free analysis on Gold, so your likes and comments are very much appreciated.
As always, trade safe.
KOG

GOLD TRADE IDEA: SHORT | SELL (06/01/25)Quick sell while we are waiting for the real move. While in this range, gold has created a new range. I’d enter for a sell, especially if price returns to the premium.
RR: 2.6
NOTE: this is not financial advice. Trade safely and at your own risk
Target Achieved: Our XAUUSD Forecast Was Spot On!The market has hit the target just as we predicted! 🚀 Our analysis of the strong 4H trendline and bullish momentum proved accurate, with the price continuing to push upward as anticipated. This is a testament to the power of technical analysis and staying disciplined with the trend. 📈
Stay tuned for more insights and forecasts! 💡

SWING AND GROW RICHlooking for a great start for the new year, gold holds some great potential to make your dreams come true. looking for a bullish swing on gold. the weekly trend is bullish and the daily has made it's pull back to the 200 moving average, the 4h has gone bullish from the 2nd of january and it made a pull back on friday and today, looking for a pin bar in line with the trend on the 4h, the 1h has made a bullish enguling parttern. so looking to close out at a new all time high. trade with proper risk management. enjoy the year.

XAU/USD 06 January 2025 Intraday AnalysisH4 Analysis:
-> Swing: Bearish.
-> Internal: Bullish.
Analysis/Intraday expectation remains the same as analysis dated 16 December 2024.
Price is clearly unable to target weak internal. This is due to the fact that Daily and Weekly Timeframe remain in bearish pullback phase.
Price Action Analysis:
Technically price is to target weak internal priced at 2,721.420. Price has sweeped liquidity,
for two possible reasons.
1. To assist price to complete bearish pullback phase, react at either discount of internal 50% or H4 demand zone before targeting weak internal high.
2. To assist Daily and H4 TF's to complete bearish pullback phase with price to print a bearish iBOS and target strong internal low priced at 2,536.855.
Intraday Expectation:
Intraday expectation and alternative scenario as per points 1 and 2.
Note:
With the Federal Reserve's dovish stance and persisting geopolitical uncertainties, heightened volatility in Gold is expected to continue. Traders should proceed with caution and adjust risk management strategies in this high-volatility environment.
H4 Chart:
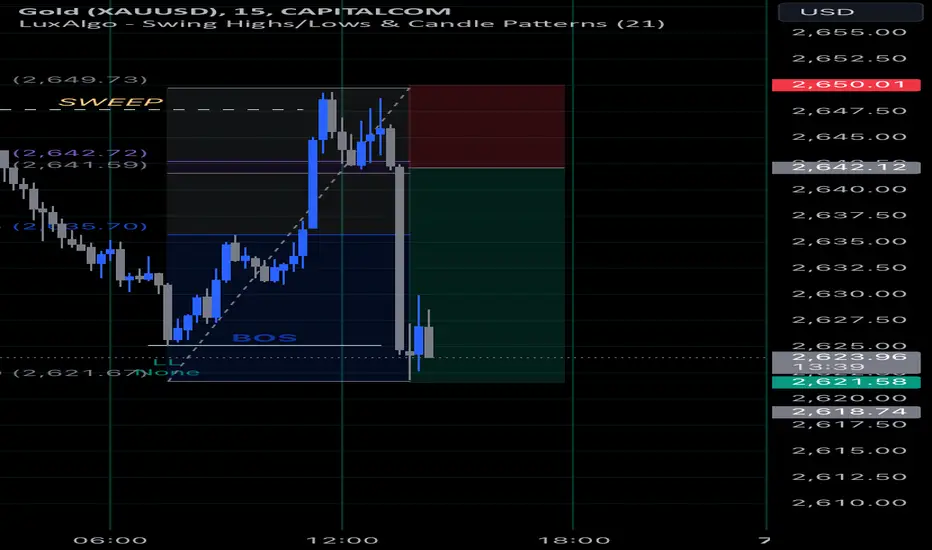
M15 Analysis:
-> Swing: Bearish.
-> Internal: Bearish.
Price Action Analysis:
Price has most recently printed a bearish iBOS.
Price has printed a bullish CHoCH indicating, but not confirming bullish pullback phase initiation.
We are now trading within an established internal range.
Intraday Expectation:
Price is expected to react at either premium of internal 50% EQ or M15 supply zone before targeting weak internal low priced at 2,625.260.
Note:
With the Federal Reserve maintaining a dovish stance and ongoing geopolitical tensions, volatility in Gold prices is expected to remain elevated. Traders should exercise caution, adjust risk management strategies, and stay prepared for potential price whipsaws in this high-volatility environment.
M15 Chart:

XAUUSDHello Traders! 👋
What are your thoughts on GOLD?
Gold, after a short-term upward movement, is now approaching a key resistance level, which coincides with the upper boundary of the short-term ascending channel. This resistance zone is expected to act as a strong barrier, potentially halting the bullish momentum.
As the price reaches this level, there is a high probability of a bearish reversal, leading to a decline toward the identified support level.
Don’t forget to like and share your thoughts in the comments! ❤️

Am I the only one who is waiting for a bearish trend for #gold?hello guys!
let's analyze gold together!
Double Top Formation:
A double top has been identified near the $2,675-$2,680 level, signaling a potential reversal from the bullish trend.
Broken Channel:
The previous upward channel has been broken, indicating a shift in market structure and possible bearish momentum.
Two Scenarios Outlined:
First Scenario (Blue Path): The price may consolidate or retest the $2,630-$2,640 range before resuming its downward trend toward $2,578.
Second Scenario (Red Path): A bullish retracement toward the $2,675-$2,680 resistance zone is possible, followed by a reversal and significant decline.
Support and Resistance Levels:
Resistance: $2,675-$2,680 (critical zone for the second scenario).
Support: $2,629 (short-term) and $2,578 (major support).
Outlook:
The bias appears bearish due to the broken channel and the double-top pattern. Confirmation of either scenario depends on price action near the outlined key levels.

XAUUSD - Todays PlanWe are back after the festive period! Here is our view and update on XAUUSD . Potential opportunities and what to look out for after the Holiday season and start of the New Year.
Let’s take a step back and take a look at XAUUSD from a bigger perspective. For this we are attaching the long-term overview on the pair.
We are still following the sell bias we have published on November 27th.
XAUUSD is currently trading at around 2635 .
Scenario 1: SELLS from 2636 or 2630
That would confirm our pullback to the upside and breaking below 2630 would give us an opportunity to drop back down to 2611 or 2604 which is still one of our major Key Levels. Next we would be targeting a very important KL (Key Level) 2590.
Scenario 2: BUYS from 2645
We broke above 2636 and are trading above it. We should see more upside towards 2645 potentially reaching and breaking 2660. If 2660 is broken, it would invalidate our long-term analysis on XAUUSD.
Personal opinion:
We are still extremely bearish on XAUUSD. Safe sells would be placed at breaks of 2630 and we could potentially reach our target today (2611 - 2604). On the other hand if we start breaking above 2636 and breaking 2645, we would be looking to finally change our long-term bias and look for further buys reaching 2714 again.
KEY NOTES
- XAUUSD breaking below 2630 would confirm sells down to 2611 - 2604.
- XAUUSD breaking above 2645 would confirm further buys up to 2660.
- DXY is still holding strength and shows no signs of stopping.
Thank you everyone for your amazing support lately. We will continue to provide value to you.
Happy trading!
FxPocket

Xauusd Sell Till 10 Jan 2025hi i have added reversal dates for xauusd 10 jan 2025 you will gold will make low and market will go bullish till 24 jan 2025 where gold will make high and again xauusd will drop from 24 jan

THE KOG REPORT - WeeklyWhen we first started publishing on Tradingview we used to share the long term charts along with the weekly plan but then decided to stop. We've had quite a few requests for our long term projections so we'll try and keep up to date with publishing them.
Weekly Chart:
On this chart we can see a clean reversal formed with the resistance level now at the 2655-65 region just like the monthly chart. If the level holds us down, we have support below 2555-60 on what could be the breaker swing! This entails caution, if we attack that region and break the kings swing takes us again into that 2480 region before then bouncing. This could be the shake up the market has been waiting for.
Red boxes on this chart represent the key levels for the swing trades and longer captures. Together with the strategy and the indicators, they'll help keep us in the right direction.
Key level resistance 2660-70 break for 2720
Key level support 2560, break for 2480
Please do support us by hitting the like button, leaving a comment, and giving us a follow. We’ve been doing this for a long time now providing traders with in-depth free analysis on Gold, so your likes and comments are very much appreciated.
As always, trade safe.
KOG


GOLD 1H CHART ROUTE MAP & TRADING PLAN FOR THE WEEKHey Everyone,
Please see our updated 1h chart levels and targets for the coming week.
We are seeing price play between two weighted levels with a gap above at 2661 and a gap below at 2633. We will need to see ema5 cross and lock on either weighted level to determine the next range.
We will see levels tested side by side until one of the weighted levels break and lock to confirm direction for the next range.
We will keep the above in mind when taking buys from dips. Our updated levels and weighted levels will allow us to track the movement down and then catch bounces up.
We will continue to buy dips using our support levels taking 30 to 40 pips. As stated before each of our level structures give 20 to 40 pip bounces, which is enough for a nice entry and exit. If you back test the levels we shared every week for the past 24 months, you can see how effectively they were used to trade with or against short/mid term swings and trends.
BULLISH TARGET
2661
EMA5 CROSS AND LOCK ABOVE 2661 WILL OPEN THE FOLLOWING BULLISH TARGET
2681
EMA5 CROSS AND LOCK ABOVE 2681 WILL OPEN THE FOLLOWING BULLISH TARGET
2711
BEARISH TARGETS
2633
EMA5 CROSS AND LOCK BELOW 2633 WILL OPEN THE FOLLOWING BEARISH TARGET
2611
EMA5 CROSS AND LOCK BELOW 2611 WILL OPEN THE FOLLOWING BEARISH TARGET
2593
EMA5 CROSS AND LOCK BELOW 2593 WILL OPEN THE SWING RANGE
SWING RANGE
2570 - 2551
As always, we will keep you all updated with regular updates throughout the week and how we manage the active ideas and setups. Thank you all for your likes, comments and follows, we really appreciate it!
Mr Gold
GoldViewFX

GOLD 4H CHART ROUTE MAP & TRADING PLAN FOR THE WEEKHey Everyone,
Please see our updated 4h chart levels and targets for the coming week.
We are seeing ema5 and price play between two weighted levels with a gap above at 2655 and a gap below at 2629. We need ema5 to cross and lock above or below the weighted Goldturns to determine the next range.
We will see levels tested side by side until one of the weighted levels break and lock to confirm direction for the next range.
We will keep the above in mind when taking buys from dips. Our updated levels and weighted levels will allow us to track the movement down and then catch bounces up.
We will continue to buy dips using our support levels taking 30 to 40 pips. As stated before each of our level structures give 20 to 40 pip bounces, which is enough for a nice entry and exit. If you back test the levels we shared every week for the past 24 months, you can see how effectively they were used to trade with or against short/mid term swings and trends.
BULLISH TARGET
2655
EMA5 CROSS AND LOCK ABOVE 2655 WILL OPEN THE FOLLOWING BULLISH TARGET
2694
EMA5 CROSS AND LOCK ABOVE 2694 WILL OPEN THE FOLLOWING BULLISH TARGET
2726
EMA5 CROSS AND LOCK ABOVE 2726 WILL OPEN THE FOLLOWING BULLISH TARGET
2753
BEARISH TARGETS
2629
EMA5 CROSS AND LOCK BELOW 2629 WILL OPEN THE FOLLOWING BEARISH TARGET
2600
EMA5 CROSS AND LOCK BELOW 2600 WILL OPEN THE SWING RANGE
SWING RANGE
2561
As always, we will keep you all updated with regular updates throughout the week and how we manage the active ideas and setups. Thank you all for your likes, comments and follows, we really appreciate it!
Mr Gold
GoldViewFX

GOLD DAILY CHART MID/LONG TERM UPDATEHey Everyone,
Please see the daily chart update we have been trading and tracking for a while now, to give you all an overall view of the range.
As stated last week the retracement range is still providing support and we also stated that we had a candle body close above 2629 opening 2686 gap and will also need ema5 lock to further confirm this.
- This gave a nice push up last week with over 200 pips. We now also have the ema5 confirmation for the long range gap above at 2686. As long as the retracement range holds and provides support we will continue to buy dips knowing we have the gap above open.
We will use our smaller timeframe analysis on the 1H and 4H chart to buy dips from the weighted Goldturns for 30 to 40 pips clean. Ranging markets are perfectly suited for this type of trading, instead of trying to hold longer positions and getting chopped up in the swings up and down in the range.
We will keep the above in mind when taking buys from dips. Our updated levels and weighted levels will allow us to track the movement down and then catch bounces up using our smaller timeframe ideas.
Our long term bias is Bullish and therefore we look forward to drops like this, which allows us to continue to use our smaller timeframes to buy dips using our levels and setups.
Buying dips allows us to safely manage any swings rather then chasing the bull from the top.
Thank you all for your likes, comments and follows, we really appreciate it!
Mr Gold
GoldViewFX

GOLD WEEKLY CHART MID/LONG TERM ROUTE MAPHey Everyone,
Another update on the weekly chart idea we have been tracking for over a month now and still playing out as analysed.
As stated already this chart allowed us to project the long term corrections and direction. We are using this chart to track our bullish targets until no ema5 lock to confirm rejections on the levels.
The channel top is continuing to provide support like we stated for the past few weeks, We had a test within the channel into 2590 axis inline with the retracement range, which gave the perfect reactional support bounce.
This is the beauty of our Gold channels, which we draw in our unique way, using averages rather than the price. This enables us to identify fake-outs and breakouts clearly, as minimal noise in the way our channels are drawn.
As long as we see no ema5 break and lock below into the channel, we cane safely continue with our plans to buy dips in this range using the the levels just like the last few weeks reactional bounce above the retracement axis level.
Ema5 is still playing above the channel top and has not broken into the channel providing support above the channel.
We will continue to track the movement down and trade the bounces up, inline with our plans to buy dips, using our smaller time-frames, keeping in mind the long range gaps above for the future.
Thank you all for your likes, comments and follows, we really appreciate it!
Mr Gold
GoldViewFX

Unlocking Gold’s Potential in 2025: What Traders Must Know!!!COMEX:GC1! After a strong rise in 2024, gold has started to solidify its position in 2025. Known for its status as a safe-haven asset, gold benefited from economic uncertainty, geopolitical tensions, and changes in monetary policy. Undoubtedly, by the end of 2024, profit-taking occurred, which caused gold prices to fall from their historic highs. However, as 2025 begins, traders are readjusting their perspectives and strategies, which is providing support to gold.
1. Review of 2024: A Glorious Year for Gold
• In 2024, gold saw a significant surge, with prices rising sharply due to various factors. Changes in central bank policies, particularly the Federal Reserve's rate cuts, played a crucial role in driving gold prices higher. Gold ended the year up 27%, marking a 23% increase compared to the previous year.
• The primary reasons for the pullback from gold's historic highs were twofold. First, traders began to lock in profits, as the annual price increase for this precious metal seemed too good to be true. Second, U.S. economic data, particularly inflation figures, began to show signs of an unexpected reversal. After dropping to its lowest point in 2024, U.S. inflation data began to rise, causing the Federal Reserve to reconsider its extremely dovish monetary policy, which led to multiple rate cuts throughout the year. By the end of 2024, traders' sentiment indicated that the Fed was unlikely to cut rates further in its next meeting, which resulted in the U.S. dollar index rising relative to gold prices.
2. Recalibrating with a New Perspective
• As we enter 2025, traders are considering three key factors that could significantly support gold prices. First, a major event will take place on January 20, when the new president will be inaugurated. The elected president may pressure the Federal Reserve to cut rates further, advocating for a lower interest rate environment. This suggests that, despite some members of the Fed being reluctant to lower rates, the Federal Reserve may be compelled to do so under pressure from the new president.
• Second, the incoming president is expected to escalate trade tensions with other countries, potentially affecting economic growth and increasing geopolitical uncertainty. If this occurs, it may lead some investors to reconsider the U.S. dollar’s status as a safe-haven currency, which could increase demand for gold.
• Third, we are entering a period in which most investors are reallocating funds within their portfolios. Considering the performance over the past two years and the potential for trade policy-driven geopolitical tensions, we may see a fresh influx of capital into gold.
3. Price Trends
• Gold prices have now surpassed the 50-day simple moving average (SMA), which is a positive indicator for the trend. As long as prices remain above this level, we may see a more bullish momentum in the market.

BITCOIN can continue upward new record in this month Bitcoin's bullish momentum shows strong potential to continue, with market analysts suggesting that it may push towards a new all-time high within this month. If the upward trend holds steady, we could see record-breaking levels by January 20th, driven by increasing investor confidence and market dynamics.

GOLD- Levels for Monday 6th- Friday 11th JanuaryHope this benefits you guys. This is not typical S&R or S&D. These levels are based on volume profile and really powerful. NOTE, don't treat these levels as buy and sell points. You will still need to have context behind your trade and use these levels as a reference point. one of the strategy I use is, volume profile along with cumulative delta and footprint. Look for shift in value, delta divergence etc. and when price reaches one of those levels, use footprint for entry. Bottom line is, you have to have context behind your trade. Without context, you are hunting in the dark. Have fun and enjoy

Stick to buying gold on dipsBros, during the second pullback, gold touched the 2639 level but failed to decisively break below it. Clearly, the bullish structure of gold remains intact. In fact, as long as gold holds above 2635, it indicates that the bulls have not entirely lost control.
I believe this pullback is merely a healthy correction within the broader uptrend, serving as a consolidation phase. Once gold stabilizes, it is likely to resume its upward trajectory. If gold can rebound above 2645 in the short term, bullish momentum will undoubtedly gain further strength, reinforcing the bullish signal.
Therefore, I see this short-term pullback as an excellent opportunity to accumulate gold at discounted levels. Let’s use this retracement to build positions at favorable prices, and once gold rebounds, it may deliver surprising and exceptional returns!
Bros, are you optimistic about the rebound of gold? If you want to learn more detailed trading ideas and get more trading signals, you can choose to join the channel at the bottom of the article to make trading no longer difficult and make making money a pleasure!
