THE KOG REPORT THE KOG REPORT:
In last week’s KOG Report we said we would be looking for the levels of resistance above at the 2670-75 region where we anticipated the short trade to come from and the lower levels of support standing at 2630 where we wanted to see a reaction in price. We managed to get the short just below around the 2665 region giving us a nice start to the week in Camelot, targeting lower and breaking through 2630. We then continued to short completing the bias target levels as well as the red box targets which were shared with the wider community.
Pre-FOMC we suggested traders pause and wait for the reversal which we managed to get based on the indicator and the FOMC report enabling us to capture the move upside into the close of the week, giving us a phenomenal pip capture on Gold. Add to that the other pairs we’ve traded and analysed through the week, and it was a nice end to week giving us an opportunity to now take it lightly for the remainder of the year.
So, what can we expect in the week ahead?
For this week we will be expecting thin volume so potential for ranging and slow movement with sudden burst of unexpected volume. We again have the key level of 2630-35 above which is a reasonable target region for the start of the week as long as the support level just below here holds us up 2610. If we can start the week with a move into that region we feel an opportunity to long is there with the first region being 2630 and above that 2635. 2635 is the level we’re anticipating a break of into the higher levels of 2650-55 and above that 2660-6, which is where we ideally want to be waiting for the short opportunity to take this back down into the lower levels with potential to then break below the 2600 level.
We say it a lot but this week and most probably for the remainder of the year we will be taking this level to level, hence the report is showing you’re the 4H red boxes which together with our 15min and 1H indicators work well to capture the moves for intra-day trading across all pairs.
KOG’s bias for the week:
Bearish below 2660 with targets below 2610, 2596, 2580 and 2578
Bullish on break of 2660 with targets above 2667 and above that 2670
RED BOXES:
Break of 2625 for 2630, 2635, 2645 and 2660 in extension of the move
Break of 2610 for 2606, 2590, and 2680 in extension of the move
Please do support us by hitting the like button, leaving a comment, and giving us a follow. We’ve been doing this for a long time now providing traders with in-depth free analysis on Gold, so your likes and comments are very much appreciated.
As always, trade safe.
KOG
Goldtradingstrategy

GOLD 1H CHART ROUTE MAP & TRADING PLAN FOR THE WEEKHey Everyone,
Please see our updated 1h chart levels and targets for the coming week.
We are seeing price play between two weighted levels with a gap above at 2647 and a gap below at 2618. We will need to see ema5 cross and lock on either weighted level to determine the next range.
We will see levels tested side by side until one of the weighted levels break and lock to confirm direction for the next range.
We will keep the above in mind when taking buys from dips. Our updated levels and weighted levels will allow us to track the movement down and then catch bounces up.
We will continue to buy dips using our support levels taking 30 to 40 pips. As stated before each of our level structures give 20 to 40 pip bounces, which is enough for a nice entry and exit. If you back test the levels we shared every week for the past 24 months, you can see how effectively they were used to trade with or against short/mid term swings and trends.
BULLISH TARGET
2647
EMA5 CROSS AND LOCK ABOVE 2647 WILL OPEN THE FOLLOWING BULLISH TARGET
2668
EMA5 CROSS AND LOCK ABOVE 2668 WILL OPEN THE FOLLOWING BULLISH TARGET
2691
EMA5 CROSS AND LOCK ABOVE 2691 WILL OPEN THE FOLLOWING BULLISH TARGET
2719
BEARISH TARGETS
2618
EMA5 CROSS AND LOCK BELOW 2618 WILL OPEN THE FOLLOWING BEARISH TARGET
2595
EMA5 CROSS AND LOCK BELOW 2595 WILL OPEN THE SWING RANGE
SWING RANGE
2570 - 2551
As always, we will keep you all updated with regular updates throughout the week and how we manage the active ideas and setups. Thank you all for your likes, comments and follows, we really appreciate it!
Mr Gold
GoldViewFX

GOLD 4H CHART ROUTE MAP & TRADING PLAN FOR THE WEEKHey Everyone,
Please see our updated 4h chart levels and targets for the coming week.
We are seeing ema5 play between two weighted levels with a gap above at 2629 and a gap below at 2600. We need ema5 to cross and lock above or below the weighted Goldturns to determine the next range.
We will see levels tested side by side until one of the weighted levels break and lock to confirm direction for the next range.
We will keep the above in mind when taking buys from dips. Our updated levels and weighted levels will allow us to track the movement down and then catch bounces up.
We will continue to buy dips using our support levels taking 30 to 40 pips. As stated before each of our level structures give 20 to 40 pip bounces, which is enough for a nice entry and exit. If you back test the levels we shared every week for the past 24 months, you can see how effectively they were used to trade with or against short/mid term swings and trends.
BULLISH TARGET
2629
EMA5 CROSS AND LOCK ABOVE 2629 WILL OPEN THE FOLLOWING BULLISH TARGET
2655
EMA5 CROSS AND LOCK ABOVE 2655 WILL OPEN THE FOLLOWING BULLISH TARGET
2694
EMA5 CROSS AND LOCK ABOVE 2694 WILL OPEN THE FOLLOWING BULLISH TARGET
2726
BEARISH TARGETS
2600
EMA5 CROSS AND LOCK BELOW 2600 WILL OPEN THE FOLLOWING BEARISH TARGET
2561
EMA5 CROSS AND LOCK BELOW 2561 WILL OPEN THE SWING RANGE
SWING RANGE
2518 - 2486
As always, we will keep you all updated with regular updates throughout the week and how we manage the active ideas and setups. Thank you all for your likes, comments and follows, we really appreciate it!
Mr Gold
GoldViewFX

GOLD DAILY CHART MID/LONG TERM UPDATEHey Everyone,
Please see the daily chart update we have been trading and tracking for a while now, to give you all an overall view of the range.
After completing 2686 previously we were left with a candle body close break opening the gap above but had no cross and lock therefore confirming rejection for the move down.
We are now seeing price play in the retracement range and expect this range to provide support with the lowest in the range we can see 2560 and support above this level should provide bounces to chase targets above.
We will use our smaller timeframe analysis on the 1H and 4H chart to buy dips from the weighted Goldturns for 30 to 40 pips clean. Ranging markets are perfectly suited for this type of trading, instead of trying to hold longer positions and getting chopped up in the swings up and down in the range.
We will keep the above in mind when taking buys from dips. Our updated levels and weighted levels will allow us to track the movement down and then catch bounces up using our smaller timeframe ideas.
Our long term bias is Bullish and therefore we look forward to drops like this, which allows us to continue to use our smaller timeframes to buy dips using our levels and setups.
Buying dips allows us to safely manage any swings rather then chasing the bull from the top.
Thank you all for your likes, comments and follows, we really appreciate it!
Mr Gold
GoldViewFX

WEEKLY CHART MID/LONG TERM ROUTE MAPHey Everyone,
Another update on the weekly chart idea we have been tracking for over a month now and still playing out as analysed.
As stated already this chart allowed us to project the long term corrections and direction. We are using this chart to track our bullish targets until no ema5 lock to confirm rejections on the levels.
The channel top is continuing to provide support like we stated for the past few weeks, We had a test within the channel into 2590 axis inline with the retracement range, which gave the perfect reactional support bounce.
This is the beauty of our Gold channels, which we draw in our unique way, using averages rather than the price. This enables us to identify fake-outs and breakouts clearly, as minimal noise in the way our channels are drawn.
As long as we see no ema5 break and lock below into the channel, we cane safely continue with our plans to buy dips in this range within the boxes using the levels just like last weeks reactional bounce on the retracement axis level.
We will continue to track the movement down and trade the bounces up, inline with our plans to buy dips, using our smaller time-frames, keeping in mind the long range gaps above for the future.
Thank you all for your likes, comments and follows, we really appreciate it!
Mr Gold
GoldViewFX

Summary of 12.21 Golden WeekendThis week, gold experienced continuous shrinkage, but we also followed the trend and finally won a great victory. Our members also successfully completed the goals set at the beginning of the week.
Finally, I wish you all a happy weekend. Let us continue to complete our profit plan next week.

Gold 30min Chart Short Gartley pattern Gold 30min Chart Short Gartley pattern, Price end AB=CD, stop should be strong above all SMAs and take profit is EA leg of the pattern

GOLD ROUTE MAP UPDATEHey Everyone,
A PIPTASTIC finish to the week!!!!
Yesterday we got the swing range activation and caught a nice move up but the full swing range was not compete.
This followed with another test on the swing range allowing us to catch the move again, inline with our plans to buy dips.
The full move into 2630 completed the full swing today, catching over 400 pips.
We will now come back Sunday with our updated Multi time-frame analysis, Gold route map and trading plans for the week ahead.
Have a smashing weekend!! And once again, thank you all for your likes, comments and follows, we really appreciate it!
Mr Gold
GoldViewFX

#GOLD XAUUSD ALL TARGET HIT SAME LOOKOUT CHARTXAUUSD has showcased exceptional precision, with the chart reflecting a clear trend and all designated targets being successfully achieved. A textbook example of strategic planning and execution, highlighting the power of technical analysis in forecasting market movements.

XAUUSD: Market Analysis and StrategiesGold technical analysis
Daily resistance 2627, support below 2583
Four-hour resistance 2627, support below 2600
Gold operation suggestions: On Thursday, gold rose from 2583 to 2626, rebounding 43 dollars, just touching the area near the daily short-term moving average MA5 and falling to 2586. The ups and downs made it difficult for investors to see the market clearly. Yesterday, the gold price maintained a wide range of long and short shocks and closed weakly below 2600. Today's idea is to continue to be bearish and continue to sell on rebounds.
For European and American market operations, the 5-day moving average of the daily line is at 2614, and the strong resistance is at yesterday's high point 2626. The current price is 2605. Don't rush to enter the short position for the time being.
SELL2626near
SELL2614near
BUY:2600near
BUY:2583near
The strategy only provides trading directions.
Since it is not a real-time trading guide, please use a small SL to test the signal.

XAUUSD - continuation sells? What about Pullbacks?Here is our in-depth view and update on XAUUSD . Potential opportunities and what to look out for.
XAUUSD is currently trading at around 2605 .
We are still following our long-term analysis on XAUUSD which was posted on November 27th (almost a month ago).
Last time, we took a step back and took a look at XAUUSD from a bigger perspective (H4 time-frame). We are now using H1 to show you possible outcomes we might have in play.
Overall XAUUSD is still extremely bearish . We could see the following scenarios happen.
Scenario 1: SELL from 2620
We could see a potential pullback to 2620, which was respected last time we made a pullback from the massive drop on XAUUSD. This would give us an amazing entry for further gold sells.
Scenario 2: SELL from 2633
A deeper pullback could happen if we break to the upside from 2620. Entering in 2633 would give us an amazing opportunity to hop into sells and hold it long-term, still targeting the 2480 level.
Scenario 3: SELL from 2590
Breaks below 2590 would result in more sells on the pair. As we failed to break to the upside that would confirm the 2620 being the “pullback area” and we will most likely continue to the downside. We would be targeting 2550 and possible breaks of it. If 2550 would be broken we could start seeing more extreme sells on XAUUSD.
Personal opinion:
The direction for now is bearish in our opinion. We are looking for sells and we do believe gold could see some more sell-offs in December before the year of 2024 ends.
KEY NOTES
- XAUUSD is overall bearish.
- XAUUSD sells are valid from key pullback areas 2620 and 2633.
- XAUUSD breaks below 2590 would also confirm further sells.
Happy trading!
FxPocket

Don’t worry when buying gold at the bottom
The Fed's interest rate decision on Wednesday and Powell's subsequent speech, although the interest rate was cut by 25 basis points as expected, its "hawkish" tone had a significant impact on the price of gold. The Fed lowered its expectations for future easing policies, predicting only two interest rate cuts of 25 basis points in 2025, lower than the previous forecast. This shows that the Fed is more concerned about inflation risks and remains cautious about economic growth.
This policy shift resonates with strong US economic data, further strengthening the market's expectations for the Fed's future policies. The final value of US GDP in the third quarter was revised up to 3.1%, higher than expected, and the number of initial jobless claims also fell sharply, showing that the labor market is still strong. These data show that the resilience of the US economy is stronger than expected, providing support for the Fed to maintain a relatively tight monetary policy.
For the gold market, the Fed's "hawkish" stance has put significant pressure on gold prices. As a non-interest-bearing asset, gold's price is negatively correlated with interest rates. A low interest rate environment is usually good for gold because it reduces the opportunity cost of holding gold. However, the Fed has hinted at a slower pace of rate cuts, or even a pause, raising the opportunity cost of holding gold, dampening demand for the metal. The strengthening of the U.S. dollar index has also had a negative impact on gold prices denominated in U.S. dollars.
The market is currently divided over expectations for inflation. While recent inflation data has retreated, it is still above the Fed’s target level. Fed officials have also expressed concerns about persistently high inflation. The upcoming core PCE data (the Fed’s preferred inflation indicator) will be the focus of market attention, and the results will have an important impact on gold prices. If the data shows persistently high inflation, it could push up gold prices; otherwise, it could put further pressure on gold prices.
While the Russia-Ukraine conflict is still ongoing, the market has adapted to its impact on the global economy and financial markets. Recently, some geopolitical events have had a relatively short-lived and limited impact on gold prices.
Market sentiment plays an important role in gold price fluctuations. Recent stock market volatility reflects investors’ concerns about the outlook for global economic growth, which could boost demand for gold as a safe-haven asset. However, strong economic data and the Fed's "hawkish" stance have eased market concerns about risky assets to a certain extent, weakening the safe-haven function of gold.
1 The Fed hinted that it will slow down the pace of interest rate cuts in the future, which will put some pressure on gold.
2 The speed of global economic growth will affect investors' preference for risky assets, weakening the safe-haven function of gold.
3 The current 1-hour downward trend of gold is clear.
In summary, the current short-term trend of gold is weak. Today, investors are paying attention to the pressure area of the 1-hour downward trend line above, and gold will be shorted after adjustment under pressure.

Buy gold, there is still a chance to rebound to 2640Bros, gold has fallen sharply due to the hawkish rate cut, and the lowest has reached around 2584, and then rebounded; just now, gold touched around 2687 during the second decline, and then rebounded to above 2690, showing signs of building a W double bottom in the structure.
Although the rebound of gold is relatively weak, the downward space is gradually converging. I was optimistic that gold would continue to fall to around 2670, but at present, since gold has signs of forming a W double bottom structure, after consuming a certain amount of short energy, once the W double bottom structure is successfully built, gold may still rebound to 2640 again.
So in trading, I think it is best not to continue to chase short gold in short-term trading. We can go long on gold with the 2590-2580 area as the support area, and the defense position is 2570. So in short-term trading, I am currently more inclined to go long on gold.
Bros, are you as optimistic about the gold rebound as I am? If you want to learn more detailed trading ideas and get more trading signals, you can choose to join the channel at the bottom of the article to make trading no longer difficult and make making money a pleasure!

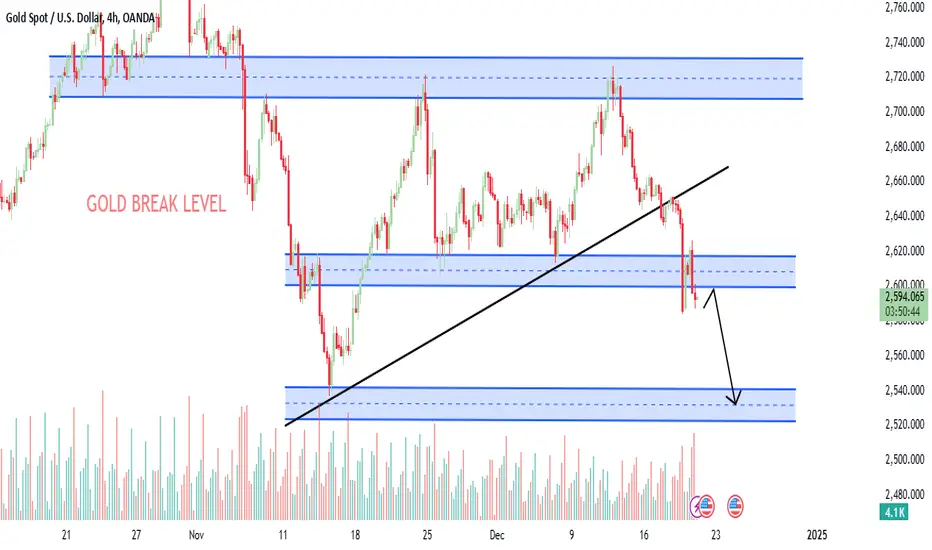
GOLD next weekKept this in mind that I told yall about this sell out this week, if the weekly candle closed bearish, that one line I drew below would be our next target/DOL.

12.20 Gold short-term short-selling trend remains unchangedAgainst the backdrop of changes in the Fed's expectations for a rate cut in 2025, and the reduction in the number of rate cuts and the reduction in the magnitude, the gold market plunged sharply on Wednesday night. Although there was a rebound on Thursday, the price once reached 2626. However, it should be noted that this seemingly strong rebound is actually a bullish counterattack after the decline, and it is difficult to reverse the overall downward trend.
From the daily trend pattern, the closing line of the high-rise and fall leaves a long upper shadow, which means that the increase cannot be maintained and the strong pattern is difficult to return.
This rebound, on the one hand, vented the resistance of the bulls, and on the other hand, it confirmed the pullback of the previous bottom support and completed the top-bottom conversion. Once the key support level is broken, the bears will continue. In addition, after the short-term touches the whole hundred mark, there will be repeated situations. From the technical perspective, whether it is rising or falling in the short-term, after touching the whole hundred mark, there will be short-term repetitions. Therefore, after yesterday's decline and the price fell below 2600, it is normal for the price to rebound.
Although the current market has not started to fall, it is very difficult for the price to return to the original support level, and the downward trend has become a high probability event.
Today's trading strategy:
SELL: 2620 Target 2600 90 80

Gold trading zones: 20-Dec-2024Today’s Gold trading zones: For educational purposes only, use at your own risk.

XAUUSD (Gold) Bullish trade Idea over the breakout of 2604.02 leXAUUSD (Gold) Bullish trade idea over the breakout of 2604.02 level.
Gold fell on the recent 18 Dec 2024 FOMC, and on 19 Dec 2024 the unemployment data was strong for the US dollar, so now I am watching the buy-side trade idea over the breakout of the 2604.02 level with strong confirmations of price at this level.
The setup must meet the required momentum in the price. The sentiments also show the price will move as per the data revelled from various sites.
Setup;
Gold Buy at level: 2604.2-2605.2
Stop Loss: 2599.2 (50 pips) or the low of previous candle
Take Profit; 2623
*Note; If the valid breakout will be found then the setup also valid otherwised find more oppercunity.

#GOLD READY FOR A PULL BACK ...XAU/USD is showing signs of exhaustion near resistance, suggesting a potential pullback could be on the horizon. Traders should keep an eye on key levels for confirmation, as the price could retest lower support zones. A retracement here might offer fresh buying opportunities if the overall uptrend remains intact. Stay alert for breakout or reversal signals to plan your next move effectively!

Gold Market Update:Corective Phase Set Stage for Further DeclineGold has entered a corrective phase following yesterday's substantial decline, with price action consolidating within a defined range. This period of consolidation is expected to persist, allowing the market to recalibrate before the prevailing bearish momentum likely resumes. Downside targets remain intact, with the next leg lower anticipated once the correction concludes. Engage with this analysis by liking, sharing, or sharing your perspectives in the comments below.
GOLD ROUTE MAP UPDATEHey Everyone,
What can I say...we totally smashed the pips today !!!
Our chart idea and levels were respected perfectly allowing us to track the movement down with ema5 cross and lock confirmations on our weighted levels, giving us the bounces.
The break from the retracement range opened and completed the swing range, which did exactly what it says on the tin giving us the full swing, which we were able to catch for a clean 280pips!!
The beauty of our strategy to buy dips from our weighted levels allows us to catch pips regardless which way the market goes.
We will continue to buy dips using our support levels taking 30 to 40 pips. As stated before each of our level structures give 20 to 40 pip bounces, which is enough for a nice entry and exit. If you back test the levels we shared every week for the past 24 months, you can see how effectively they were used to trade with or against short/mid term swings and trends.
BULLISH TARGET
2666
EMA5 CROSS AND LOCK ABOVE 2666 WILL OPEN THE FOLLOWING BULLISH TARGET
2682
EMA5 CROSS AND LOCK ABOVE 2682 WILL OPEN THE FOLLOWING BULLISH TARGET
2697
EMA5 CROSS AND LOCK ABOVE 2697 WILL OPEN THE FOLLOWING BULLISH TARGET
2719
BEARISH TARGETS
2645 - DONE
EMA5 CROSS AND LOCK BELOW 2645 WILL OPEN THE FOLLOWING BEARISH TARGET
2628 - DONE
EMA5 CROSS AND LOCK BELOW 2628 WILL OPEN THE SWING RANGE
SWING RANGE
2606 - 2586 - DONE
As always, we will keep you all updated with regular updates throughout the week and how we manage the active ideas and setups. Thank you all for your likes, comments and follows, we really appreciate it!
Mr Gold
GoldViewFX

12.20 Gold Short-term Operation Analysis StrategyYesterday, the gold market opened at 2645.2 in the morning, and then the market rose slightly. The daily line reached a high of 2652, and then the market was in a range. Before 3 am, the daily line reached a low of 2632.9, and then the market was in a range. Although the Fed cut interest rates by 25 basis points in the early morning, the dot plot showed that the rate cuts next year would be reduced from 4 to 2, and the Fed Chairman later confirmed that the market broke through and fell sharply. The daily line reached a low of 2583.1, and then the market was in a range. The daily line finally closed After the line reached 2585.2, the daily line closed with a saturated large negative line with a slightly longer upper shadow line. After this pattern ended, the rebound trend was destroyed. The market has a need to continue to fall back within a certain period of time. In terms of points, the short position at 2600 this morning was reduced and the stop loss was followed up at 2602. Today's market first rose to give a 2600 short conservative 2612 short stop loss of 2616. The lower targets are 2590 and 2583. If it falls below, it will focus on the 2572 and 2563-2554 support range.

Gold price analysis December 19⭐️Fundamental Analysis
Gold prices fell sharply due to the impact of the Fed's less dovish outlook.
Fed Chairman Powell emphasized cautious policy in the context of ongoing high inflation risks.
The Fed forecasts inflation target to reach 2% in the next 1-2 years, indicating slow progress.
The latest dot chart shows few interest rate cuts until 2026, stabilizing the Fed funds rate at 3.4%.
⭐️Technical Analysis
Gold prices fell to the 2685 area and were accepted by buyers to push prices up around 2610 in the Asian session. If the European session fails to break 2613, Gold will continue to fall in the European session and the destination is relatively far away at 2585-2558. In case the resistance zone at 2613 is broken, the direction is towards 2633, which is the first corrective wave SELL zone and the second corrective wave SELL zone around 2663

GOLD KEEP SELL? LOOKOUT CHARTIf today the price breaks the 2580 zone, there is a possibility that gold will continue to fall to the 2550 zone...
