Short gold, it will fall again when encountering resistanceIn the short term, gold retreated to around 3274 and then rebounded again, and it is only one step away from 3300. Will gold regain its bullish trend again?
I think it is difficult for gold to break through in the short term. Although gold retreated to around 3274 and successfully built a double bottom structure with the second low point and the low point of 3245, it only increased the rebound space; it is not enough for gold to regain its bullish trend. Since gold fell and broke through, the confidence of bulls has been hit hard. The previous support at the technical level has formed a strong resistance area after the top and bottom conversion, and to a certain extent helped the short force. In the short term, gold faces resistance in the 3310-3320 area. Before gold breaks through this area, the short energy still has the upper hand.
Therefore, shorting gold is still the first choice for short-term trading.
It is appropriate to consider shorting gold in batches in the 3300-3320 area, and look at the target: 3385-3375-3365
Goldtradingstrategy

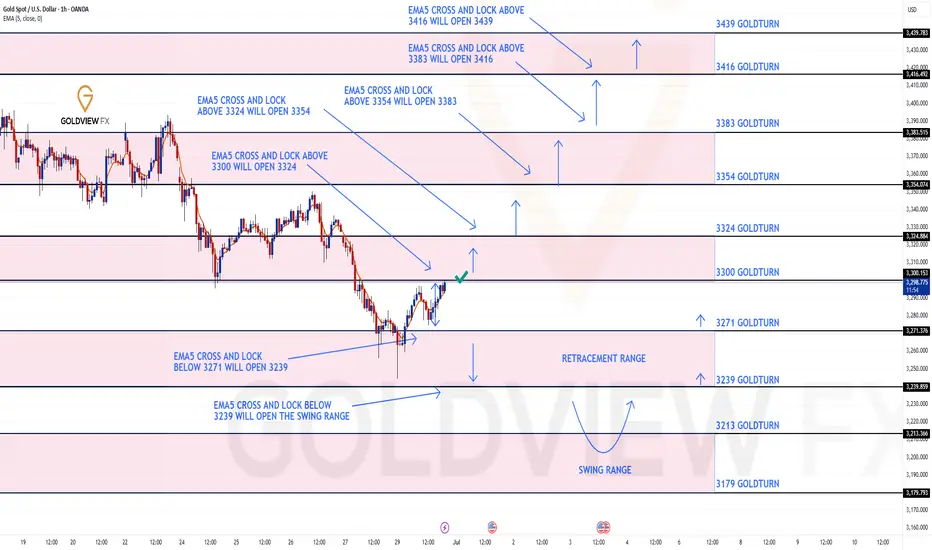
GOLD ROUTE MAP UPDATEHey Everyone,
Great start to the week with our Bullish target at 3300 hit perfectly!!!!
We will now look for ema5 cross and lock to confirm a continuation or failure to lock will follow with a rejection into the lower Goldturns for support and bounce.
We will see levels tested side by side until one of the weighted levels break and lock to confirm direction for the next range.
We will keep the above in mind when taking buys from dips. Our updated levels and weighted levels will allow us to track the movement down and then catch bounces up.
We will continue to buy dips using our support levels taking 20 to 40 pips. As stated before each of our level structures give 20 to 40 pip bounces, which is enough for a nice entry and exit. If you back test the levels we shared every week for the past 24 months, you can see how effectively they were used to trade with or against short/mid term swings and trends.
The swing range give bigger bounces then our weighted levels that's the difference between weighted levels and swing ranges.
BULLISH TARGET
3300 - DONE
EMA5 CROSS AND LOCK ABOVE 3300 WILL OPEN THE FOLLOWING BULLISH TARGETS
3324
EMA5 CROSS AND LOCK ABOVE 3324 WILL OPEN THE FOLLOWING BULLISH TARGET
3354
EMA5 CROSS AND LOCK ABOVE 3354 WILL OPEN THE FOLLOWING BULLISH TARGET
3383
BEARISH TARGETS
3271
EMA5 CROSS AND LOCK BELOW 3354 WILL OPEN THE FOLLOWING BEARISH TARGET
3239
EMA5 CROSS AND LOCK BELOW 3239 WILL OPEN THE SWING RANGE
3213
3179
As always, we will keep you all updated with regular updates throughout the week and how we manage the active ideas and setups. Thank you all for your likes, comments and follows, we really appreciate it!
Mr Gold
GoldViewFX
Seize the opportunity to short gold!Last week, we mentioned that if gold continues to fall, it will go to around 3245-3250. This position is 618 of the retracement from 3120 to 3450, and it is also the previous rising point. After the opening, it tested this position as expected and rebounded. If it continues to break down, it will gradually go to around 3225 and 3204. Last Friday, it opened weak and eventually fell to 3255. Although it rebounded at the end of the session, it was not enough to change the weak pattern. Today, we will focus on the rebound strength. The pressure is at 3291 and 3301. Short according to the rebound strength, and look at the 3245 support below. If it does not break, consider going long.
Gold operation suggestion: short around 3291-3001, target 3370-3360.

GOLD 1H CHART ROUTE MAP UPDATE & TRADING PLAN FOR THE WEEKHey Everyone,
Please see our updated 1h chart levels and targets for the coming week.
We are seeing price play between two weighted levels with a gap above at 3300 and a gap below at 3271. We will need to see ema5 cross and lock on either weighted level to determine the next range.
We will see levels tested side by side until one of the weighted levels break and lock to confirm direction for the next range.
We will keep the above in mind when taking buys from dips. Our updated levels and weighted levels will allow us to track the movement down and then catch bounces up.
We will continue to buy dips using our support levels taking 20 to 40 pips. As stated before each of our level structures give 20 to 40 pip bounces, which is enough for a nice entry and exit. If you back test the levels we shared every week for the past 24 months, you can see how effectively they were used to trade with or against short/mid term swings and trends.
The swing range give bigger bounces then our weighted levels that's the difference between weighted levels and swing ranges.
BULLISH TARGET
3300
EMA5 CROSS AND LOCK ABOVE 3300 WILL OPEN THE FOLLOWING BULLISH TARGETS
3324
EMA5 CROSS AND LOCK ABOVE 3324 WILL OPEN THE FOLLOWING BULLISH TARGET
3354
EMA5 CROSS AND LOCK ABOVE 3354 WILL OPEN THE FOLLOWING BULLISH TARGET
3383
BEARISH TARGETS
3271
EMA5 CROSS AND LOCK BELOW 3354 WILL OPEN THE FOLLOWING BEARISH TARGET
3239
EMA5 CROSS AND LOCK BELOW 3239 WILL OPEN THE SWING RANGE
3213
3179
As always, we will keep you all updated with regular updates throughout the week and how we manage the active ideas and setups. Thank you all for your likes, comments and follows, we really appreciate it!
Mr Gold
GoldViewFX

GOLD 4H CHART ROUTE MAP UPDATE & TRADING PLAN FOR THE WEEKHey Everyone,
Please see our updated 4h chart levels and targets for the coming week.
We are seeing price play between two weighted levels with a gap above at 3301 and a gap below at 3242. We will need to see ema5 cross and lock on either weighted level to determine the next range.
We will see levels tested side by side until one of the weighted levels break and lock to confirm direction for the next range.
We will keep the above in mind when taking buys from dips. Our updated levels and weighted levels will allow us to track the movement down and then catch bounces up.
We will continue to buy dips using our support levels taking 20 to 40 pips. As stated before each of our level structures give 20 to 40 pip bounces, which is enough for a nice entry and exit. If you back test the levels we shared every week for the past 24 months, you can see how effectively they were used to trade with or against short/mid term swings and trends.
The swing range give bigger bounces then our weighted levels that's the difference between weighted levels and swing ranges.
BULLISH TARGET
3301
EMA5 CROSS AND LOCK ABOVE 3301 WILL OPEN THE FOLLOWING BULLISH TARGETS
3370
EMA5 CROSS AND LOCK ABOVE 3370 WILL OPEN THE FOLLOWING BULLISH TARGET
3429
EMA5 CROSS AND LOCK ABOVE 3429 WILL OPEN THE FOLLOWING BULLISH TARGET
3499
BEARISH TARGETS
3242
EMA5 CROSS AND LOCK BELOW 3242 WILL OPEN THE FOLLOWING BEARISH TARGET
3171
EMA5 CROSS AND LOCK BELOW 3171 WILL OPEN THE SWING RANGE
3089
3171
EMA5 CROSS AND LOCK BELOW 3171 WILL OPEN THE SECONDARY SWING RANGE
3089
3001
As always, we will keep you all updated with regular updates throughout the week and how we manage the active ideas and setups. Thank you all for your likes, comments and follows, we really appreciate it!
Mr Gold
GoldViewFX

GOLD DAILY CHART ROUTE MAPHey Everyone,
Following up on our previous Goldturn channel post – the recent price action has played out exactly as anticipated. We saw a clean rejection at the channel top around 3433, with price failing to lock above and confirming that resistance is still very much in control at the range ceiling.
This rejection was perfect and it led to a decisive move back down into the 3272 Goldturn support. This level is now acting as a critical pivot. From here, we’re watching closely for one of two outcomes:
1. Bounce Scenario: If price holds and we see a supportive reaction from 3272, particularly with no EMA5 cross and lock confirmation, we will look for long opportunities to slowly ascend the channel again. Expect a grind with testing of in-between levels as structure develops.
2. Breakdown Scenario: If 3272 fails to hold, we expect the next key test to occur at the channel’s midline – a level that has acted as support. A further breakdown would likely target 3106, our next Goldturn support zone, for potential reversal setups.
This price action continues to validate the effectiveness of the Goldturn channel structure keeping us grounded and responsive rather than reactive.
We remain focused on level to level trading, guided by the channel and supported by EMA5 confirmations for directional analysis.
Key Levels to Watch:
Resistance: 3433
Support: 3272 (current test), 3106 (if breakdown continues)
Stay patient and let price confirm. The best trades continue to come from structure respecting reactions, not from chasing.
Mr Gold
GoldViewFX

GOLD WEEKLY CHART MID/LONG TERM ROUTE MAPHey Everyone,
Follow up on our Weekly Goldturn channel outlook.
Last week’s action delivered the rejection at the channel top, right in line with expectations. Importantly, we did not get an EMA5 lock confirmation, reinforcing the rejection. We still have the previous weekly candle body close above 3387, leaving the gap at 3482 active and exposed overhead.
The early rejection saw a swift retrace into the 3281 Goldturn axis support, where price is currently attempting to stabilise. This is a pivotal level. From here, we are watching two potential paths unfold:
1. Bounce Scenario: If 3281 holds and buyers step in, we’ll look for a gradual climb within the channel, testing key in between levels. EMA5 cross and lock confirmation will be key for directional bias. A reclaim and continuation higher keeps the 3482 gap firmly in play as a target.
2. Breakdown Scenario: If 3281 gives way, we have a body close gap to the channel mid-line, which becomes the next key level for potential support and Goldturn reaction. A move into this area could offer another structured long opportunity, aligned with the overall bullish framework.
Despite the rejection at the highs, the broader channel structure remains intact, and the longer term outlook still favours a measured move up level by level, using Goldturn levels and EMA5 as our compass.
Key Focus:
Support: 3281 → Channel Half-line (if broken)
Resistance: 3387 → 3482 (gap target)
We remain patient and continue reacting to clean structure backed opportunities.
Mr Gold
GoldViewFX

It’s the right time to make a golden layout!Gold opened at 3328 today and started the downward mode. After the European session, it continued to fall and broke the new low. The negative opening data of the US session also continued the downward mode. So far, it has reached the lowest point of 3255 and rebounded, but the strength is not very strong. After all, the upper pressure is still very strong. In the short term, we pay attention to the previous low point of 3295-3300, and focus on the upper 3305-3311. Today, the short-term operation of gold is mainly short-selling on rebounds, and long-selling on callbacks is supplemented.
From the 4-hour analysis, the upper short-term resistance is around 3295-3300, with focus on the important suppression at 3305-3311. The rebound will continue to be mainly short and look to fall back. The lower short-term support is around 3255-3245. Relying on this range as a whole, the main tone of high-altitude and low-multiple participation remains unchanged.
Gold operation strategy:
1. Short-selling in batches near the rebound of gold near 3295-3310, with a target of 3380-3370.
2. When gold falls back to around 3345-3455, go long in batches, with the target at 3370-3380.

GOLD ROUTE MAP UPDATEHey Everyone,
A fantastic close to the week as our analysis once again played out level to level with precision!
As a follow-up from yesterday's post:
- The swing range completed the move into 3348, as expected.
- However, we had no further EMA5 lock above, confirming rejection back into the swing range.
- This was followed by an EMA5 cross and lock below 3306, opening the secondary swing range.
- That range played out perfectly today, hitting both 3288 and 3271 targets.
We’re now seeing a bounce off those levels giving the 20 to 40 pips, and we will now be observing to see if the full secondary swing is completed.
It's Friday, and it's been a PIPTASTIC week across the board. Well done to everyone following the plan and sticking to the levels.
QUICK RECAP
BULLISH TARGET
3376 - DONE
BEARISH TARGETS
3348 - DONE
EMA5 CROSS AND LOCK BELOW 3348 WILL OPEN THE SWING RANGE
3330 - DONE
3306 - DONE
EMA5 CROSS AND LOCK BELOW 3306 WILL OPEN THE SECONDARY SWING RANGE
3288 - DONE
3271 - DONE
We’ll be back now on Sunday with our multi-timeframe analysis and trading plans for the week ahead. Thanks again for all your likes, comments, and follows.
Wishing you all a fantastic weekend!!
Mr Gold
GoldViewFX

Where will gold go?In 4 hours, it has fallen below the previous low of 3295, and will continue to fall. There are two supports below, namely 3280 and 3265. Don't expect a big rebound before going short in a negative market. If the rebound is large, it will not fall. This kind of negative decline is generally judged by the 15- and 30-minute patterns. When resistance appears in the big cycle, the market has actually fallen a lot.
Today, I think the pressure is mainly in the 3300 and 3310 areas. 3310 can be considered as the pressure of the top and bottom conversion. Pay attention to 3280 and 3265 below. If you consider going long, these two positions are the main positions. For the time being, the general direction is mainly short.

There are opportunities for both bulls and bears in gold!Gold fell back and closed lower yesterday. The daily line closed with a negative cross overnight. The overall market has not changed much. The short-term repeated tug-of-war is temporarily consolidating. Today is the closing of the weekly line, and we will continue to maintain the volatile thinking. In the 4H cycle, the Bollinger Bands closed, temporarily exerting pressure on the middle track. After rebounding to 3350 yesterday, it failed to continue and remained in a weak shock pattern. Therefore, today's operation is mainly short and supplemented by long. The upper pressure is at 3328 and 3336. Short according to the rebound strength, pay attention to the rise and fall of 3310 below. A breakthrough may see the previous low of 3295. If the support is not broken, you can consider going long.🔔For more specific operation details and strategy updates, please pay attention to the notification 🌐 at the bottom.
Gold operation suggestion: short gold around 3328-3338, target 3315-3310.

Gold shorting opportunity not to be missedGold hit the key resistance of 3350 and then fell under pressure, reaching a low of 3309, and was temporarily supported by the low point on Wednesday. The intraday showed a pattern of rapid decline after a volatile rise, highlighting the long-short tug-of-war pattern. The hourly line fell again after a pullback to 3328, indicating that there is still room for short-term retracement. The current operation needs to focus on key points: short orders can be entered again near the pullback of 3328-3335. If the market continues to decline, focus on the support range of 3300-3290, and long orders can be arranged if it stabilizes. The overall idea of oscillation is maintained. Before effectively breaking through 3350 or losing 3290, high-altitude and low-long are still the main strategy.
Gold recommendation: short near 3328-3335, target 3315-3305

Gold reaches the lower support and makes a bold attemptWith the official ceasefire in the Middle East, risk aversion has returned to normal. Russia and Ukraine are now expected to return to the negotiation table. The situation that was in full swing last week has suddenly become calm. Then the focus of market attention has shifted again to the Federal Reserve's monetary policy. Federal Reserve Powell reiterated in his testimony to the Senate Committee on the semi-annual monetary policy report that there is no rush to act. The tariffs are unprecedented and it is difficult to predict the impact on inflation. Consumers may have to bear part of the tariffs. The trade agreement may make the Federal Reserve consider cutting interest rates, continuing its previous hawkish tone and suppressing the rebound in gold prices.
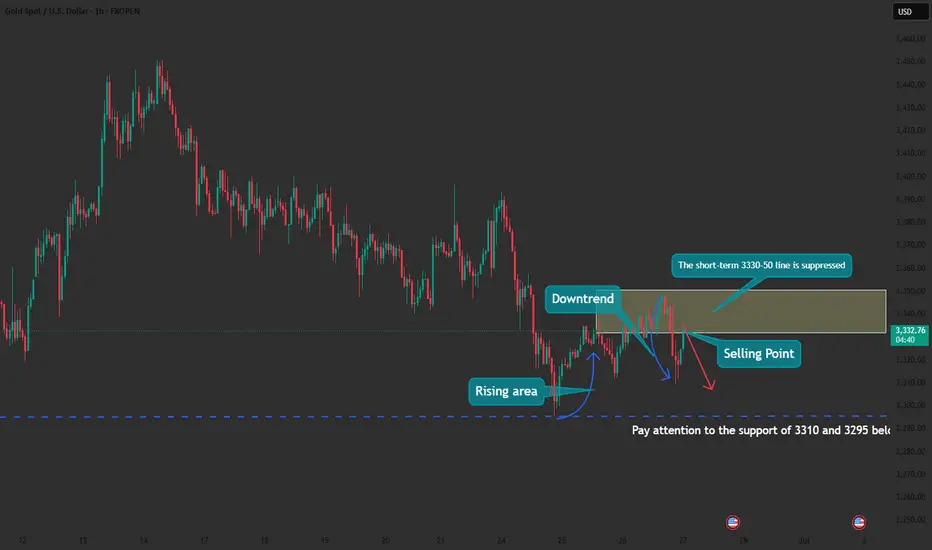
Gold hourly chart;
Short-term analysis of gold; The recent fluctuations of 1-200 US dollars have greatly increased the difficulty of trading for retail investors. It seems that there are many opportunities in a day, but in fact, the big market mainly appears in a few times. If you can't keep up in time, you can only watch the price jump up and down. The most feared thing is not to keep up with the market, but the price returns to the same point, but the principal is gradually reduced.
From the 4-hour analysis of gold, there are repeated resistances from the bulls before the downward break; once the downward break, the market will go further short, and pay attention to 3280 below. The upper short-term 3330-50 line is the key to suppression. Only by breaking the bulls can the rebound continue. In terms of operation, sell high and buy low, and pay attention to the breakthrough!
There are too many long orders at high levels of gold at present, and the market will not rise easily. The current international situation is so tense, and gold is still slowly declining. It is difficult to rebound sharply in this situation.
Seize the rebound opportunity and prepare to short goldGold continued to rebound as expected and has now extended to above 3340. In the short term, it tends to fluctuate and rise. In the previous trading idea overnight, I emphasized that everyone should not take the risk of shorting gold near 3330. Now it seems that this reminder is completely necessary. Although gold continues to rebound, the overall performance of the bulls is still not strong, and the upper side is still under pressure in the 3350-3360-3370 area. So I still advocate that you can consider shorting gold in the 3350-3360 area after the rebound.
The Premium privilege of my account will end in 10 hours. Friends in the channel have already made a lot of money by following my trading strategy. Friends who have not joined yet can join and receive the latest trading strategies and trading signals as soon as possible to escort your trading!

GOLD ROUTE MAP UPDATEHey Everyone,
A PIPTASTIC day on the markets with our analysis playing out in true level to level fashion.
Yesterday we stated that that we had the cross and lock below 3348 opening the swing range, which was hit perfectly and gave the bounce and that we will now wait to see if the full swing is completed to 3348.
- This was played out to perfection with the full swing completed into 3348. No further lock above confirmed the rejection back into the swing range.
We will continue to buy dips using our support levels taking 20 to 40 pips. As stated before each of our level structures give 20 to 40 pip bounces, which is enough for a nice entry and exit. If you back test the levels we shared every week for the past 24 months, you can see how effectively they were used to trade with or against short/mid term swings and trends.
The swing range give bigger bounces then our weighted levels that's the difference between weighted levels and swing ranges.
BULLISH TARGET
3376 - DONE
EMA5 CROSS AND LOCK ABOVE 3376 WILL OPEN THE FOLLOWING BULLISH TARGETS
3395
EMA5 CROSS AND LOCK ABOVE 3395 WILL OPEN THE FOLLOWING BULLISH TARGET
3419
EMA5 CROSS AND LOCK ABOVE 3419 WILL OPEN THE FOLLOWING BULLISH TARGET
3440
BEARISH TARGETS
3348 - DONE
EMA5 CROSS AND LOCK BELOW 3348 WILL OPEN THE SWING RANGE
3330 - DONE
3306 - DONE
EMA5 CROSS AND LOCK BELOW 3306 WILL OPEN THE SECONDARY SWING RANGE
3288
3271
As always, we will keep you all updated with regular updates throughout the week and how we manage the active ideas and setups. Thank you all for your likes, comments and follows, we really appreciate it!
Mr Gold
GoldViewFX

Gold rebound is blocked and high-altitude strategy continuesGold continued its bullish correction yesterday, reaching 3336 in the European session, and continued to retreat in the US session, reaching a low of around 3312 before temporarily stopping, and started a second pullback correction, and finally closed around 3332. Today, it opened at 3333, rebounded to 3340, and then entered a shock consolidation. Currently, the upper side focuses on the suppression of the 3342-3350 area. If the price cannot effectively break through and stand firm in this area, gold still has room for further retracement. In terms of operation, it will continue to rely on this suppression range to maintain a high-altitude thinking during the day, and follow the trend to see a decline. The recent market trends are basically the same, bottoming out and rebounding. In terms of strategy, keep a sense of rhythm and mainly short at highs.For more specific operation points, please pay attention to the notification at the bottom🌐.

Gold is obviously suppressed, so we must go short!Yesterday, gold continued to fluctuate and fall under pressure at the 3360 mark. The US market further accelerated downward to break through the 3300 integer mark and reached a weak closing near 3295. The daily K-line closed with a suppressed fall and broke the bottom of the middle shadow. The overall gold price continued to fluctuate and fall in a weak rhythm. After reaching the lowest level of 3295, it rebounded and closed at 3323. Today, it opened at 3324. As of now, it has reached the highest level of 3337. At present, we are focusing on the suppression of 3340-3348. If the rebound is under pressure, we can still intervene in short orders. The recent market trends are basically the same - bottoming out and rebounding. In terms of operation, continue to keep shorting under pressure and long positions after bottoming out and rebounding.
From the current market trend, today's upper short-term resistance focuses on the 3338-3342 area. If it rebounds to this range and is under pressure, you can consider choosing an opportunity to arrange short orders. The lower support focuses on the 3315-3305 line. If it falls back and stabilizes, there is a possibility of a short-term rebound. The overall situation is still in a range-bound structure. It is recommended to focus on key points, buy high and sell low, follow the trend, and strictly control risks. For more specific operation points, please pay attention to the 🌐 notification at the bottom.

GOLD ROUTE MAP UPDATEHey Everyone,
Another smashing day on the charts with our levels being respected perfectly inline with our plans to buy dips.
After completing our bearish 3348 and bullish 3376 target we had the cross and lock above 3376 leaving a gap to 3395, which fell short just by few pips.
We then had the cross and lock below 3348 opening the swing range, which was also hit perfectly. We got the perfect bounce, just like we analysed allowing us to buy dips and now seeing the swing range carry out the move. We will see if this is completed for the full swing range 3348.
We will keep the above in mind when taking buys from dips. Our updated levels and weighted levels will allow us to track the movement down and then catch bounces up.
We will continue to buy dips using our support levels taking 20 to 40 pips. As stated before each of our level structures give 20 to 40 pip bounces, which is enough for a nice entry and exit. If you back test the levels we shared every week for the past 24 months, you can see how effectively they were used to trade with or against short/mid term swings and trends.
The swing range give bigger bounces then our weighted levels that's the difference between weighted levels and swing ranges.
BULLISH TARGET
3376 - DONE
EMA5 CROSS AND LOCK ABOVE 3376 WILL OPEN THE FOLLOWING BULLISH TARGETS
3395
EMA5 CROSS AND LOCK ABOVE 3395 WILL OPEN THE FOLLOWING BULLISH TARGET
3419
EMA5 CROSS AND LOCK ABOVE 3419 WILL OPEN THE FOLLOWING BULLISH TARGET
3440
BEARISH TARGETS
3348 - DONE
EMA5 CROSS AND LOCK BELOW 3348 WILL OPEN THE SWING RANGE
3330 - DONE
3306 - DONE
EMA5 CROSS AND LOCK BELOW 3306 WILL OPEN THE SECONDARY SWING RANGE
3288
3271
As always, we will keep you all updated with regular updates throughout the week and how we manage the active ideas and setups. Thank you all for your likes, comments and follows, we really appreciate it!
Mr Gold
GoldViewFX

Start going long on goldAlthough gold is under pressure and weak at present, gold still rebounded near 3295 under the influence of yesterday's major negative news, proving that there is still a large amount of buying funds below, limiting the retracement space of gold; and from 3295 to 3335, there is still a rebound space of $40, proving that gold is not extremely weak. Moreover, there is a gap left above, and there is a technical need to rebound to fill the gap;
In addition, yesterday gold fell sharply due to news, and there should be many longs trapped in the market. If gold is relatively stable, there may be self-rescue behavior of the trapped longs, so gold longs still have the opportunity to rebound to 3340-3350. At present, the main focus is on the short-term support area of 3315-3305, and we can moderately consider going long on gold in this area.

The current price of gold is 3330-3335, go short directly!Gold rebounded after hitting the bottom of 3295. At present, gold is just a rebound, not enough to reverse directly. Gold rebounds and continues to be short. After all, the daily line has fallen continuously, so the short momentum of gold is still there. In the short term, the rebound of gold is just a repair after oversold. Gold is currently priced at 3330-3335 and is directly short.
The 1-hour moving average of gold continues to be arranged in a short position downward. After gold fell below the previous low of 3340 yesterday, gold has not been able to rebound again. In the short term, 3340 has become the key to long and short positions. In the short term, gold rebounds below 3340 and continues to be shorted. If gold breaks through and stabilizes at 3340 again, then gold may start to fluctuate again. Before breaking through 3340, gold is still weak and continues to maintain a short trend.

Opportunities only come to those who ambush in advanceAfter Trump announced that Israel and Iran had reached a comprehensive ceasefire agreement, the market's risk aversion sentiment cooled significantly, and the price of gold once plummeted by more than $30. Although the stability of the ceasefire agreement is in doubt, the rebound in risk appetite dominates the market trend, with stock markets rebounding, oil prices falling, and demand for safe-haven assets falling. Powell will deliver a semi-annual monetary policy testimony, and the market is paying attention to his statement on the timing of the July rate cut. At present, the internal differences of the Federal Reserve on interest rate cuts have intensified. If Powell sends a signal that the number of interest rate cuts this year is limited, it may strengthen the rebound of the US dollar and suppress gold prices; on the contrary, if the stance is dovish, it may ease the downward pressure on gold prices. In the short term, the fading of geopolitical risks and the warming of risk appetite are the main reasons for the decline in gold prices, but the weakening of the US dollar and the potential dovish tendency of the Federal Reserve still provide support. In the medium and long term, global economic uncertainty, geopolitical risks and expectations of the Federal Reserve's loose policy still constitute structural support for gold.
From a technical perspective, the gold daily moving average system is in an intertwined state, and the forces of bulls and bears are relatively balanced. The current short-term resistance above is around 3320-3333, which is an important psychological level. If an effective breakthrough is achieved or the upside space is opened, the support below will focus on the 3285-3295 line, which is the lower edge of the May oscillation platform. If it falls below, the pressure of the correction may increase. The loss of the middle track in the 4-hour chart further confirms the short-term weak structure and provides technical support for the downward trend. It is recommended to go long on the pullback near 3285-3295. At present, gold continues to fall in line with the trend.

The rebound is an opportunity to short goldAfter the ceasefire agreement between Iran and Israel and Powell's hawkish remarks that strongly refuted the possibility of a rate cut, gold fell sharply and hit a low near 3295. Although gold has rebounded, it is particularly difficult during the rebound process, which shows that the bulls are not willing to attack, and the rebound is only a technical repair of the decline.
Since gold fell below 3300 yesterday, the current bull structure has been changed in stages and the confidence of the bulls has been greatly weakened. As gold falls, it will be under pressure in the 3345-3355 area in the short term. Before gold breaks through this area, any rebound may give us an opportunity to short gold; in addition, after gold falls below 3300 once, in order to move downward and test support, gold has the need to retreat again.
So in the next short-term trading, we can try to use the 3345-3355 area as resistance, short gold appropriately, and look to the 3315-3305 area.

GOLD 4H CHART ROUTE MAP UPDATEHey Everyone,
Great day on the markets once again. This is an update on our 4H chart idea from Sunday, also playing out perfectly.
We started with our bullish target hit at 3375 with no cross and lock confirming the rejection into completing our bearish target at 3306. We will now need to see ema5 cross and lock on either weighted level to determine the next range.
We will keep the above in mind when taking buys from dips. Our updated levels and weighted levels will allow us to track the movement down and then catch bounces up.
We will continue to buy dips using our support levels taking 20 to 40 pips. As stated before each of our level structures give 20 to 40 pip bounces, which is enough for a nice entry and exit. If you back test the levels we shared every week for the past 24 months, you can see how effectively they were used to trade with or against short/mid term swings and trends.
The swing range give bigger bounces then our weighted levels that's the difference between weighted levels and swing ranges.
BULLISH TARGET
3375 - DONE
EMA5 CROSS AND LOCK ABOVE 3375 WILL OPEN THE FOLLOWING BULLISH TARGETS
3439
EMA5 CROSS AND LOCK ABOVE 3439 WILL OPEN THE FOLLOWING BULLISH TARGET
3499
EMA5 CROSS AND LOCK ABOVE 3499 WILL OPEN THE FOLLOWING BULLISH TARGET
3561
BEARISH TARGETS
3306 - DONE
EMA5 CROSS AND LOCK BELOW 3306 WILL OPEN THE SWING RANGE
3236
3171
EMA5 CROSS AND LOCK BELOW 3171 WILL OPEN THE SECONDARY SWING RANGE
3089
2995
As always, we will keep you all updated with regular updates throughout the week and how we manage the active ideas and setups. Thank you all for your likes, comments and follows, we really appreciate it!
Mr Gold
GoldViewFX
